citadel and two sigma pay millions for positioning data. same data is free on a government website, updated every friday since 1986
it's called the commitment of traders report, published by the CFTC
every week: exact net positions of commercial hedgers, large speculators, and small traders across every futures market on earth
commercial hedgers are the ones who actually move price - producers, banks, institutions trading to hedge real exposure
they've been net-short before every major equity crash in the last 30 years
when commercials flip heavily net-short while large speculators go max long, that setup has resolved bearish 74% of the time on a 6-week window
that's not a prediction. it's reading a positioning table published for free every single friday
quant desks run this as a regime filter - if the report shows big money hedged against your direction, you're buying into an invisible wall
data goes back to 1986, sits on cftc. gov, and takes maybe 2 hours in python to clean
you've been reading the chart, which is the outcome of this positioning
save this - you should be reading the cause
7 years ago I started my "financial career" by forecasting the S&P 500 with LSTM RNNs with tensorflow.
LSTMs were still fairly new back then.
I spent a lot of time thinking about each of the hyperparameters (activation function, number of layers and neurons, training epochs, dropout rate, optimizer).
Recently I wanted to see how far the field has come. So I tried @nixtlainc , which my friends Max and Cristian have been building for the past 5 years. And also backed by @Microsoft !!!
One of their most advanced models is TimeGPT-2, a transformer-based foundation model trained on over 100 billion data points. You point it at a time series, pass a few parameters, and you get a forecast. The API even does embedded fine-tuning.
Crazy how far I can get with a couple lines of code, what took me weeks in the past ....
So, obviously I applied TimeGPT-2 to a few macro data series and the experience was seamless. It feels like at some point we might have Forecasting as a Service lmao
Anyway, I made the entire experiment open source, and it runs as an @openbb_finance App that you can add directly to the OpenBB Workspace. The recipe is also available so it's easier to extend to different timeseries.
Let me know what you think!
If an adviser wants access to long/short strategies for an ultra-high-net-worth client, but Fidelity and Schwab have restricted their access, they have three options:
1. Join up with a bigger practice
2. Use another custodian like Interactive Brokers, Goldman Sachs, and Pershing
3. Trade directly with prime brokers like Morgan Stanley, JP Morgan, and Goldman Sachs.
To trade with prime brokers, an investor typically establishes a legal entity to house the assets, usually a limited liability company (LLC) or a limited partnership (LP).
The wrapper makes a big difference in how tax benefits ultimately flow.
My latest blog post is about the pros/cons of LLCs and LPs in the context of long/short strategies.
Link in profile.
Another hangup I'm seeing: why did Jane Street have long momentum exposure? Not because they're yoloing a factor. Because many stat arb strategies organically accrue momentum exposure and residualizing it out would reduce risk-adjusted returns.
A stylized example with no IP since it's in the literature: your signal is xsection(analyst earnings revision). Long equities with upside revision acceleration, short equities with downside revision acceleration. This is _not_ a bet on price continuation/trend.
However! Analysts empirically cluster around news that has already moved the price. The legitimate fundamental information seeding the cross-section has a latent loading on momentum, via human behavior.
If you try to orthogonalize this signal to momentum, you linearly downweight the equities in the cross-section which report the highest analyst conviction, because that conviction is mechanically reflexive on momentum, even though it is a qualitatively distinct source of information!
Consequently, your residualization will flatten the distribution: post-resid top quintile of the xsection has shifted names with weaker signal from the middle three quintiles, and likewise for the bottom quintile.
Realistic numbers - you squeeze a 1.0 Sharpe out of analyst revisions, 8% annualized on 8% vol. You residualize out momentum, your vol does drop because you took out the momentum risk. Maybe it goes to 6%. But oops - because of the distribution smearing effect, your returns have fallen faster, to around 5%, and now you've got like a 0.85 Sharpe.
Jane Street are not idiots. They understand this intimately well, and far better than I'm even describing here. They're still up $40B net revenue YTD after losing $15B because they rationally accept the higher risk adjusted returns that keep in the factor prone to sharp drawdowns.
I finished reading “The strangest Man” a couple of days ago and am still thinking about it (and Dirac’s life and beliefs); which, to me, is the mark of a good book.
A movie about Dirac would be far more interesting (if not more commercially successful) than “Oppenheimer”. And why don’t we have a decent biopic of Newton, or Hilbert, or Gauss? These were genuinely interesting people! “Wittgenstein” by Jarman was just a collection of known sketches. “I Ragazzi di via Panisperna” (about Fermi) was excellent. “The man who knew infinity” (about Ramanujan) was also very good (Patel and Irons could make a list of groceries interesting). “Death of a Neapolitan Mathematician” (Caccioppoli): also great, if you can find it.
We need far more biopics of scientists and philosophers. The mix of mundanity, humanity, and their unique obsessions. Make scientists cool again.
a physicist at bell labs accidentally solved trading in 1956
he wasn't trying to. he was working on information theory for telephone signals
the paper sat in an academic journal for two decades. renaissance technologies found it, wired it into their entire operation, and ran 66% annual returns for 35 years without a single losing year
it's called kelly criterion and it answers the one question no indicator on earth can touch: how much do you risk on any given trade
retail obsesses over entries. quant desks figured out decades ago that entries are maybe 20% of the edge
edge:
f = (p * b - q) / b
p = win rate
b = reward-to-risk ratio
q = 1 minus p
55% win rate on 2:1 trades → kelly outputs 32.5% of your risk pool per trade, not your full account
the difference between those two things compounded over 300 trades is not subtle
run this on any system you've backtested and something uncomfortable shows up - most retail "edges" fail the math at 50-60 trades. the signal was fine. the sizing destroyed it
quants don't guess size. the formula runs. the formula decides. no override, no feel, no vibes
the paper is free on google scholar. the implementation is 8 lines of python
Bookmark it
they had you studying rsi divergence for 10 years while the actual variable sat in a 1956 physics journal
Many of you have sent me messages saying my implied-volatility mean-reversion framework inspired you to build, and now trade your own variations.
That is exactly why I published it.
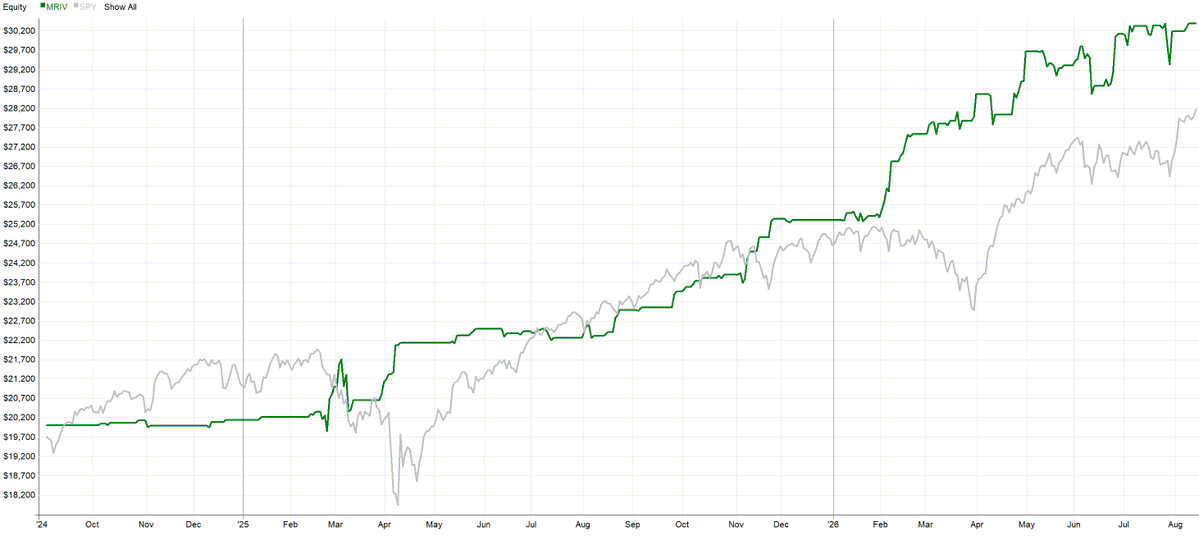
MRIV has continued to perform well in the post-publication backtest:
• Sharpe: 2.24
• Outperformed SPY over the same period
• Average exposure: only 6.51%
Many stock mean-reversion systems time entries using realized volatility.
MRIV uses implied volatility instead.
The general logic:
• Compare today’s decline with the range implied by volatility
• If the decline is unusually large, look for another drop the following day
• Use implied volatility to define the expected range and profit target
This makes the rules adapt to how the options market is pricing each stock’s current risk.
When implied volatility is already high, even a deep decline may not be exceptional. The expected range expands, the entry hurdle rises and there may be no trade.
Simple principle. Adaptive rules.
I download the required implied-volatility data free through IBKR.
Full deep dive + daily updated statistics:
https://t.co/NC1UpC3Q5M
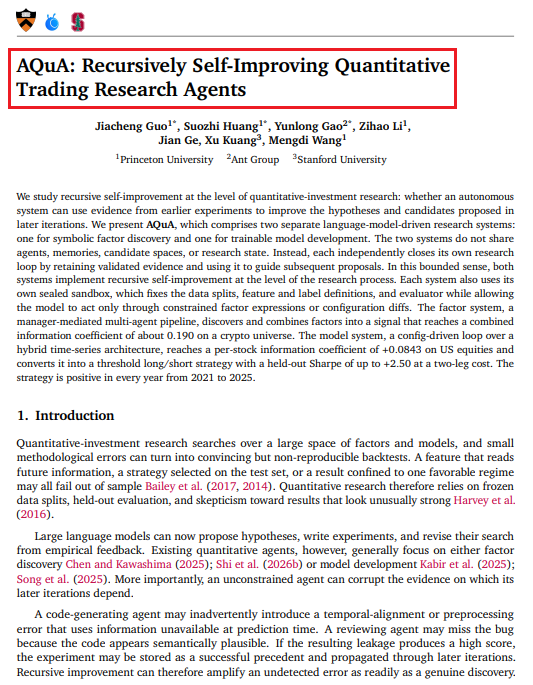
A new paper from Stanford, Princeton and Ant Group introduces AQuA, an autonomous quant research agent.
To stop the AI from accidentally looking into the future, they locked it in a "sealed sandbox."
The resulting threshold long/short strategy generated a +2.50 Sharpe ratio out-of-sample.
Structural constraints beat prompt engineering every single time.
Bookmark and read the full paper.
the smartest young people in sf were working on agi/alignment 5-10y ago.
they are working on bci today.
naomi is a total star and is one of an explosion of young talent into the bci space recently. i’m very excited about what that means for the world in a decade. 🧠
The smartest player always loses to the one who owns the rules. a Stanford professor proved it. Wall Street built a $20 billion machine on it.
it is called algorithmic game theory, free on YouTube for years. the professor is Tim Roughgarden, and his whole point is one move. stop trying to out-play the game. sit in the seat it was built to reward, and let everyone else supply your edge.
the post above is that seat, in cash. Jane Street does not predict the market. it takes a toll on a third of every retail order in America and books $20.5 billion whether you win or lose.
the mechanism does not care how smart you are. it margin-called Bill Hwang and his $36 billion into 18 years, in two days.
that same lesson runs Google's ad auction, the traffic on your commute, and every marketplace you have ever paid a fee to. the money is never in playing well. it is in owning the rules of play.
no prediction. no genius. one seat, and the rules.
the smartest player is in prison. the house that wrote the rules is up $20 billion. the difference is one free Stanford lecture.