An announcement: Under the leadership of Mario Draghi and @patrickc we have set up the Rhine Group: policymakers, economists, entrepreneurs and business people pushing European reforms and the Draghi agenda.
https://t.co/ZtoW7Rb173
In 2028, the median person on Earth will live on more than $10 a day for the first time in history (figures adjusted for inflation and for differences in purchasing power across countries).
In the last decade alone, the share of people above this threshold has risen from 41.3% in 2016 (3.11 billion) to 48.7% in 2026 (4.03 billion). Think about that for a second: we have pushed nearly 900 million people over this threshold in ten years, around 90 million people a year (slightly above the population of Turkey).
At the very bottom, we have also seen progress, though slower. In 2016, 12.6% of the world lived below $3 a day (947 million people). In 2026, the figure fell to 10.0% (826 million). This fall is harder to achieve because the poorest countries also have fast population growth. As fertility falls there, and I think it is already falling, we will cut poverty much faster.
You are probably thinking that $10 a day is not a demanding threshold. True. But in 1990, yesterday in historical terms, only 1.42 billion people lived above it. And this is not just China: 2.6 billion people have crossed the $10 line. On the other hand, in 1990, 2.20 billion people lived below $3 a day.
I checked these figures today because I start teaching Global Economic History at Penn this Wednesday, and I wanted to update the numbers I use. As Joel Mokyr instructs us:
“The responsibility of economic historians is to remind the world what things were like before 1800. Growth was imperceptibly slow, and the vast bulk of the population was so poor that a harvest failure would kill millions. Almost half the babies born died before reaching age 5, and those who made it to adulthood were often stunted, ill and illiterate.”
(“What Today's Economic Gloomsayers Are Missing,” 2014.)
This will be my first lesson to the students on Wednesday: we live in times of historically unprecedented prosperity, and, by and large, things are getting much better every year.
One of the claims in “Terra Incognita” that readers have found most interesting is that income per capita and fertility are now positively correlated across OECD countries: the richer a country is, the higher its fertility.
To document this claim more carefully, I have completed the following exercise.
I take total fertility rates from the U.N. World Population Prospects 2024 and real GDP per capita from the new Penn World Table 11.0 (expenditure side, chained PPPs, released in October 2025 and now running to 2023). For each year from 1954 to 2022, I compute the rank correlation across countries between fertility and real GDP per capita and plot the results. I use 30 of the 38 countries that are OECD members today (regardless of when they joined). I drop the other eight because they have data gaps, as former socialist economies did not compute GDP using the standard methodology (Czechia, Estonia, Hungary, Latvia, Lithuania, Poland, Slovakia, and Slovenia).
In the mid-1950s, the correlation among the 30 countries was about -0.32, and it deepened through the 1960s and most of the 1970s, until a minimum of -0.78 in 1977. This is the world most people have in mind: the opportunity cost of children rises with income and, the richer you are, the fewer children you have. Gary Becker and dozens of economists wrote papers trying to understand this pattern.
But then, in 1977, well before anyone had heard about smartphones, social media, or some of the other “usual suspects” behind the recent drop in fertility, something changed: the rank correlation started climbing in a steady way, becoming positive in the second half of the 2010s. Right now, being richer means having higher fertility rates. And, as far as I can tell, there is no indication this trend is slowing down.
So, if you have a favorite explanation for the evolution of fertility over the last few decades, ask yourself: how can my explanation account not only for the drop in fertility but also for the rank correlation switching directions in 1977?
A couple of warnings. First, I use the rank correlation because it is immune to outliers. Luxembourg and Ireland report GDP per capita figures that nobody should take at face value.
Second, I am using the U.N. World Population Prospects 2024, which I have criticized for overestimating the fertility rates of the poorest OECD members (Mexico, Colombia, Costa Rica, Türkiye). If you use the fertility rates reported by their own statistical agencies, the rank correlation is even more positive. But I don’t want anyone accusing me of fiddling with the data.
Finally, credit where it is due: I first learned about this reversal from Doepke, Hannusch, Kindermann, and Tertilt, “The Economics of Fertility: A New Era,” in Lundberg and Voena (eds.), Handbook of the Economics of the Family, vol. 1, North-Holland, 2023, pp. 151-254. Anyone who wants to go deeper should start there.
Comments always welcome!
Last week I posted a new paper with Patrick Norrick: “Terra Incognita: The Economics of a Shrinking World.”
We chose the title deliberately. No society in history has experienced the fertility levels now seen in South Korea, China, Thailand, Colombia, Chile, and many other countries. Our knowledge of the causes (and of the economic consequences) remains far more limited than most public discussion acknowledges. Much of what we write is, at best, educated conjecture.
The paper also struggles against a space limit. We wrote 20,000 words, far from the 250,000 or so we would need to address some issues in more detail (if I had the time and resources to hide away for a year, I could do that, but not now). That means some ideas are only sketched.
Nonetheless, we emphasize several important points.
First, fertility has fallen very fast everywhere: rich and poor countries, east and west, north and south, conservative and liberal societies, religious and non-religious societies (with the exception of the Jewish population of Israel; fertility has also collapsed among the Muslim population within the pre-1967 borders), you name it. Even in sub-Saharan Africa we see fast and unprecedented drops in fertility (alas, from a high initial level).
Second, and this is really interesting, the fertility collapse has been concentrated in poor and lower-middle-income countries much more than in rich countries. By now, income per capita and fertility are positively correlated within OECD countries. We conjecture this will hold globally in a few decades.
Third, and related to the second point, the fertility collapse has been concentrated among poor and lower-middle-income women within countries. In countries such as the U.S., the rich and highly educated now have more children than the poor and less educated.
Fourth, we document why we do not understand the data from the U.N. World Population Prospects. See, for example, Tables A.1 and A.2.
Fifth, we explain why some proposed mechanisms struggle when confronted with the data.
A more subtle point is at work here. Many commentators do not seem to understand the difference between proximate causes and ultimate causes. Yes, births might have gone down because fewer women are in long-run relationships. That is the proximate cause. But you need to explain why fewer women are in long-run relationships (the ultimate cause), and saying that they spend more years in school, to take one example, does not get us very far. Why do they spend more years in school? Once you start down the whole chain of reasoning, things become much harder than they seem.
The paper can be found here:
https://t.co/VrCHr0lBPa
Comments always welcome!
This fantastic figure by @jburnmurdoch is Exhibit 1 of what an aging society means for the political game: public investment, which is choosing future rewards over present consumption, gets squeezed out.
Still not convinced this is a first-order challenge?
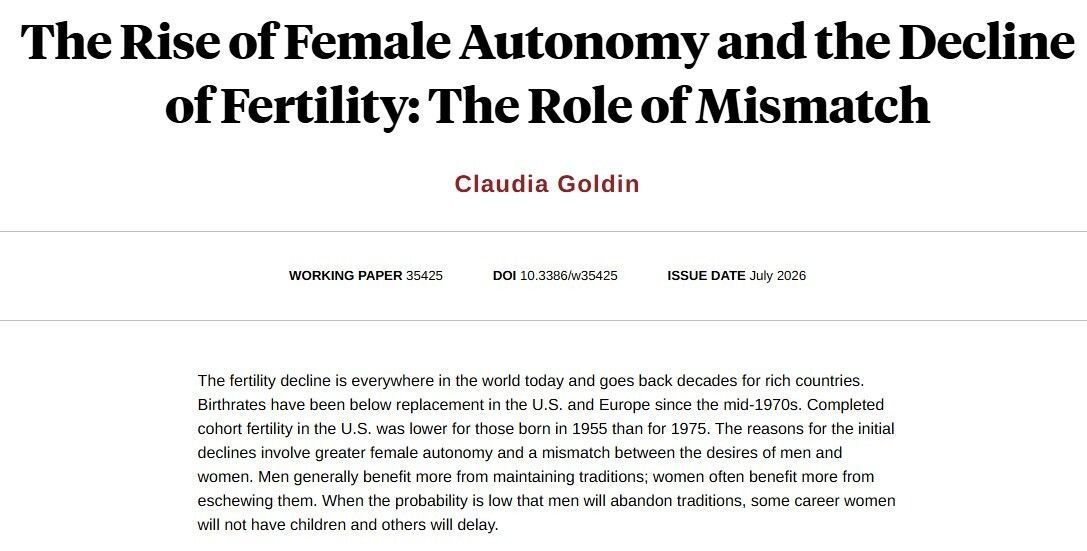
Reasons for decline in fertility involve greater female autonomy and a mismatch between the desires of men and women, from @PikaGoldin https://t.co/zCA6kZAsW7
Why did I sign this statement?
First, I had a hand in revising it, after the organizers reached out to me. I did not feel like I could sign the initial version, but I felt that finding a statement that would reflect the overlapping views of a number of AI researchers, economists, and social scientists was important.
Second, I agree with much of the revised text. Indeed, there is a possibility (or perhaps more than a possibility) that AI may become more powerful over the next 10 years. I’m still not convinced that we are going to see the very large productivity gains that industry insiders are predicting. But more powerful AI may (again no certainty, just may) lead to significant job displacement. This is a big economic and social risk.
It could also have myriad consequences on human cognition, starting with K-12 and all the way to advanced science. Some of these consequences are good, some of them are dangerous.
Third, while I do not like the comparison to the Industrial Revolution that much (feels like comparing apples to oranges to me), it is true that AI will have complex effects on the economy.
Finally and most importantly, I wholeheartedly agree with the ending: “to build the incentives, guardrails, and institutions needed to steer AI in a direction that complements humans and benefits society.”
This is what I have been arguing for over a decade now. Good AI needs to complement humans, and this requires a redirection, because the current focus on AGI is, in all but name, an agenda for displacing humans from meaningful work. That’s why steering AI must be a first priority.
I’m happy that many thought leaders have agreed.
Editorial del NYT:
«América necesita construir más casas»
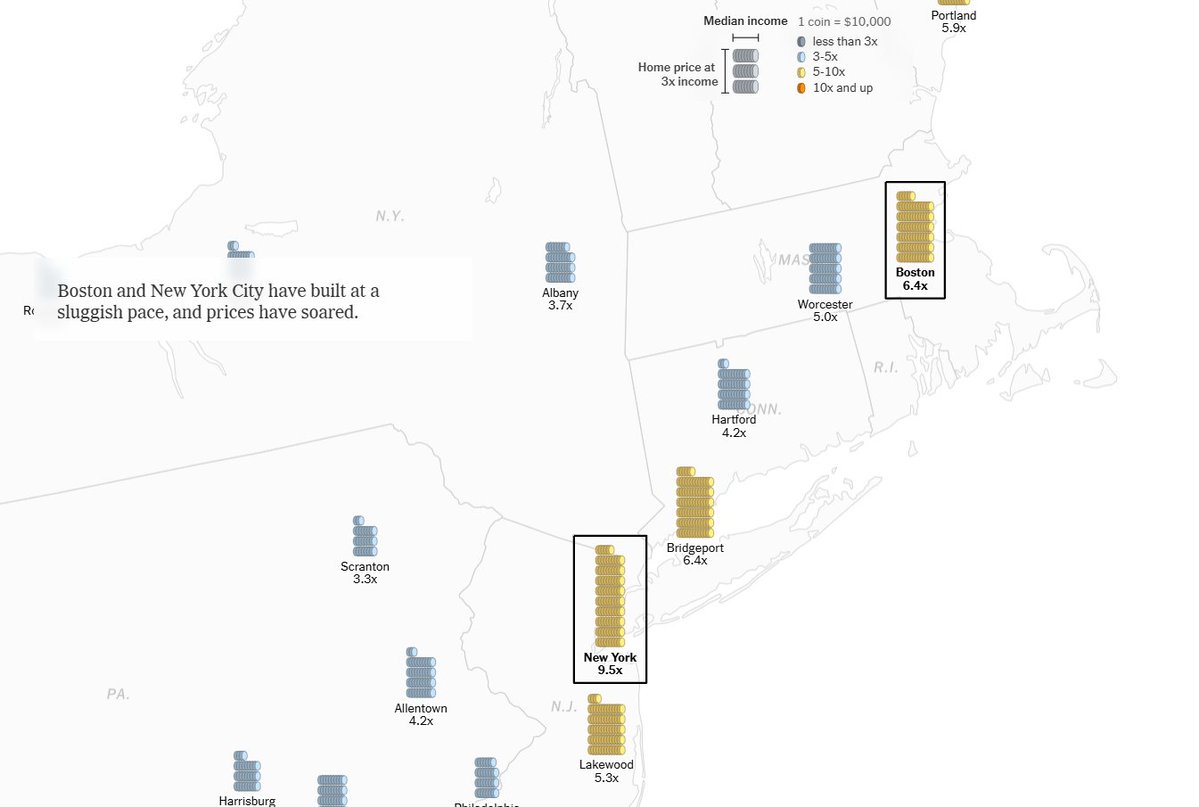
"The mismatch between supply and demand has caused home prices to soar in the 21st century, damaging both our economy and our social fabric. High prices prevent families from buying homes, feeling fully invested in their communities and building wealth. They increase generational inequality and breed cynicism among people in their 20s and 30s. They can prevent couples from having as many children as they want."
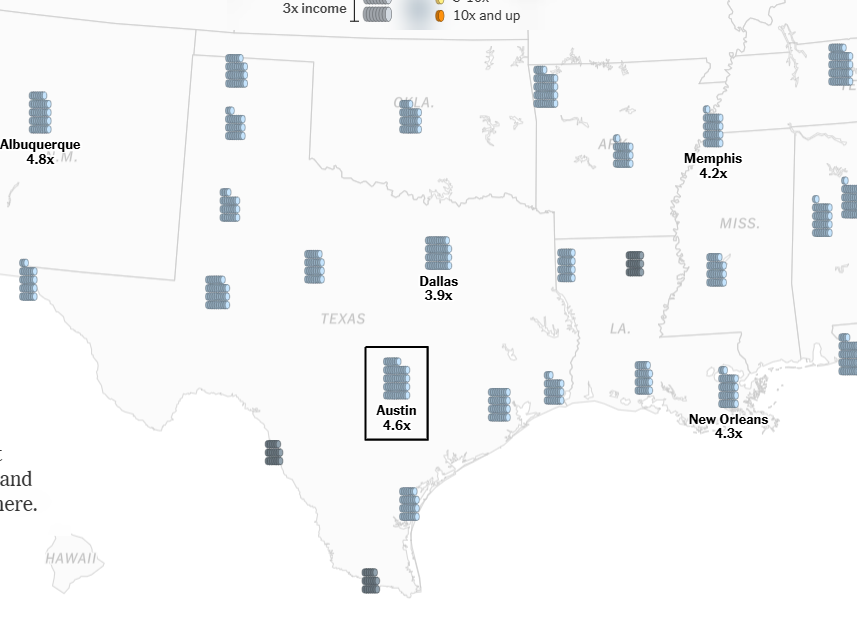
"Basic economic principles point to the solution: More supply of an item tends to lead to lower prices. Cities like Austin, Texas, have remained more affordable largely because they have built so many more homes."
"Nationwide, the relationship between home prices and home construction is even stronger than many Americans realize."
El editorial principal del NYT sobre la vivienda confirma con datos el principio económico más básico: donde se construye, los precios bajan; donde no, suben.
Dos ejemplos de los datos: San Francisco: solo 22 viviendas nuevas por cada 1.000 hogares en la última década, precio mediano 12 veces la renta mediana. Austin, que sí construyó (140 viviendas por 1.000 hogares): el precio mediano es 4,6 veces los ingresos.
El editorial señala que las zonas costeras caras, votantes demócratas y autodenominadas progresistas, han usado la normativa urbanística para maximizar el precio de la vivienda a costa de todos los demás. Muchos en Madrid (¡las cocheras de Atocha!) o en Pozuelo, o Barcelona deberían leerlo dos veces.
El NYT recomienda reducir las barreras burocráticas donde construir es legal pero imposible en la práctica.
Que en España todavía se discuta algo tan elemental dice más de nuestro debate público que de la economía de la vivienda. Sin construir más, no resolveremos el problema.
https://t.co/36PbNuYq25
Hoy publico en @elmundoes una tribuna en homenaje a Jon González.
Esta semana cerró su cuenta en X. La cerró después de que un activista publicara un hilo destapando que trabajaba en una gran empresa, etiquetara a la compañía y sugiriera que aquello requería investigación interna. La idea de fondo: lo que se dice solo vale por quién lo dice.
Jon descargaba datos del INE, Eurostat y el Banco de España, montaba gráficos limpios y los publicaba a coste cero. Sin tertulia, sin grito, sin teatro. A veces incomodaba a una mitad del país, a veces a la otra. Decenas de miles de seguidores se han quedado sin ese material.
El método importa más que el caso particular. Cuando los números aprietan, el ofendido recurre a la falacia genética con una desfachatez que sería cómica si no fuera tan eficaz. No se discute el dato porque no se puede. Se desplaza la pregunta hacia el empleador del autor. La asimetría es la materia prima: yo etiqueto a tu empresa, tú te juegas el trabajo.
Mientras tanto, España atraviesa la mayor subida real de impuestos de su democracia por la progresividad en frío, el déficit contributivo de la Seguridad Social ronda el 4% del PIB, la vivienda se ha despegado del salario de los jóvenes y la productividad lleva una generación estancada. El país necesita más gente que sepa leer una serie temporal, no menos.
Cada uno de estos episodios entrena al siguiente analista joven a hacerse pequeño. Esa es la factura que pagaremos todos.
https://t.co/JRaMferxVS
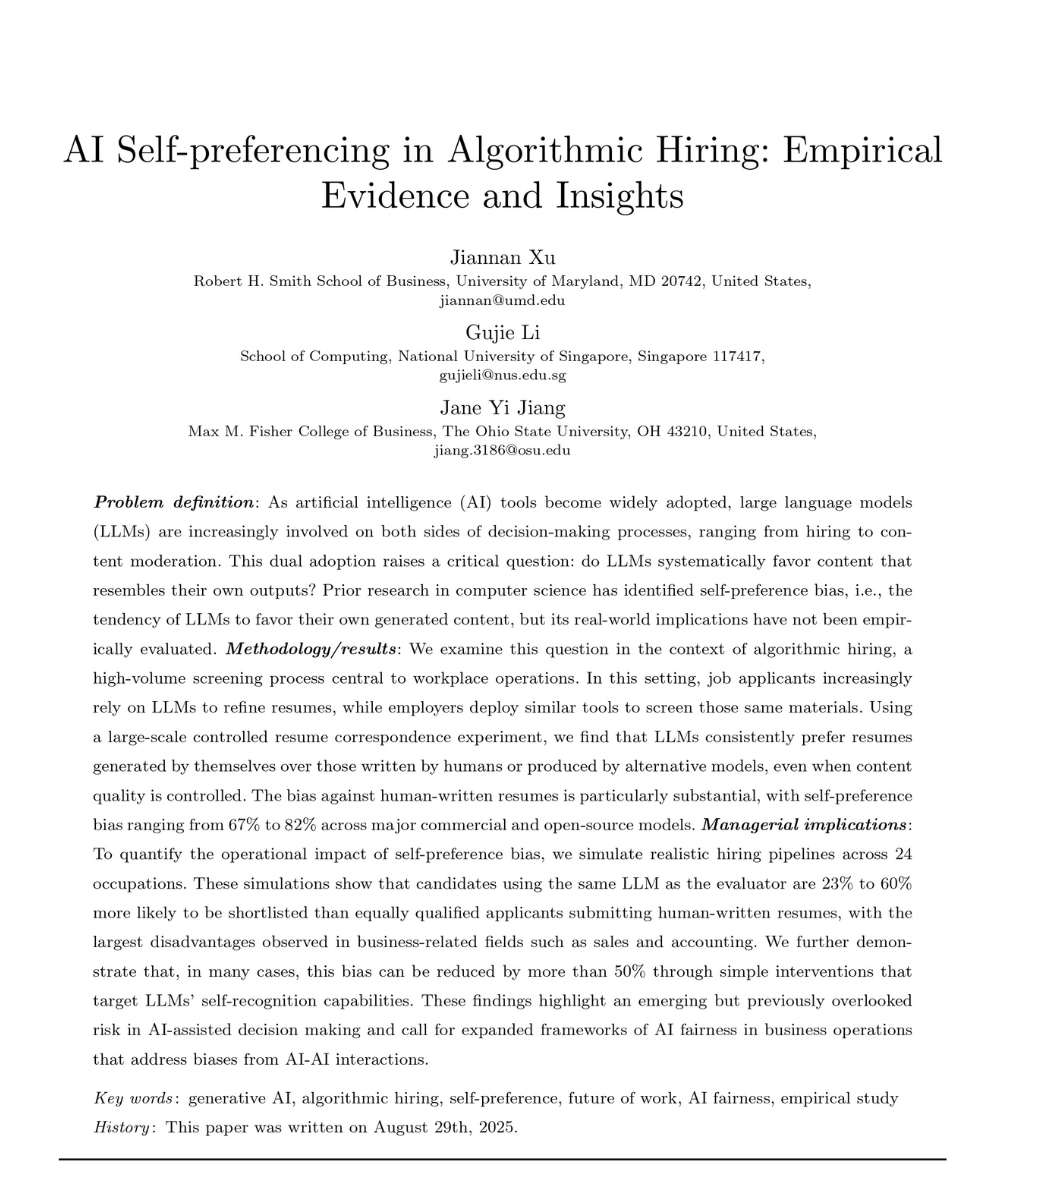
Researchers sent the same resume to an AI hiring tool twice. Same qualifications. Same experience. Same skills. One version was written by a real human. The other was rewritten by ChatGPT.
The AI picked the ChatGPT version 97.6% of the time.
A team from the University of Maryland, the National University of Singapore, and Ohio State just published the receipt. They took 2,245 real human-written resumes pulled from a professional resume site from before ChatGPT existed, so the human writing was actually human. Then they had seven of the most-used AI models in the world rewrite each one. GPT-4o. GPT-4o-mini. GPT-4-turbo. LLaMA 3.3-70B. Qwen 2.5-72B. DeepSeek-V3. Mistral-7B.
Then they asked each AI to pick the better resume. Every model picked itself.
GPT-4o hit 97.6%. LLaMA-3.3-70B hit 96.3%. Qwen-2.5-72B hit 95.9%. DeepSeek-V3 hit 95.5%. The real human almost never won.
Then the researchers tried the obvious objection. Maybe the AI is just better at writing. So they had real humans grade the resumes for actual quality and ran the experiment again, controlling for it. The result was worse. Each AI kept picking itself even when human judges rated the human-written version as clearer, more coherent, and more effective.
It gets worse. The AIs do not just prefer AI over humans. They prefer themselves over other AIs. DeepSeek-V3 picked its own resumes 69% more often than LLaMA's. GPT-4o picked its own 45% more often than LLaMA's. Each model can recognize and reward its own dialect.
Then the researchers ran the simulation that ends careers. Same job. 24 occupations. Same qualifications. The only variable was whether the candidate used the same AI as the screening tool. Candidates using that AI were 23% to 60% more likely to be shortlisted. Worst gap was in sales, accounting, and finance.
99% of large companies now run AI on incoming resumes. Most of them use GPT-4o. The paper just proved GPT-4o picks GPT-4o 97.6% of the time.
If you wrote your own cover letter this week, you did not lose to a better candidate. You lost to a worse candidate who paid OpenAI 20 dollars.
Your qualifications do not matter if the AI prefers its own handwriting over yours.
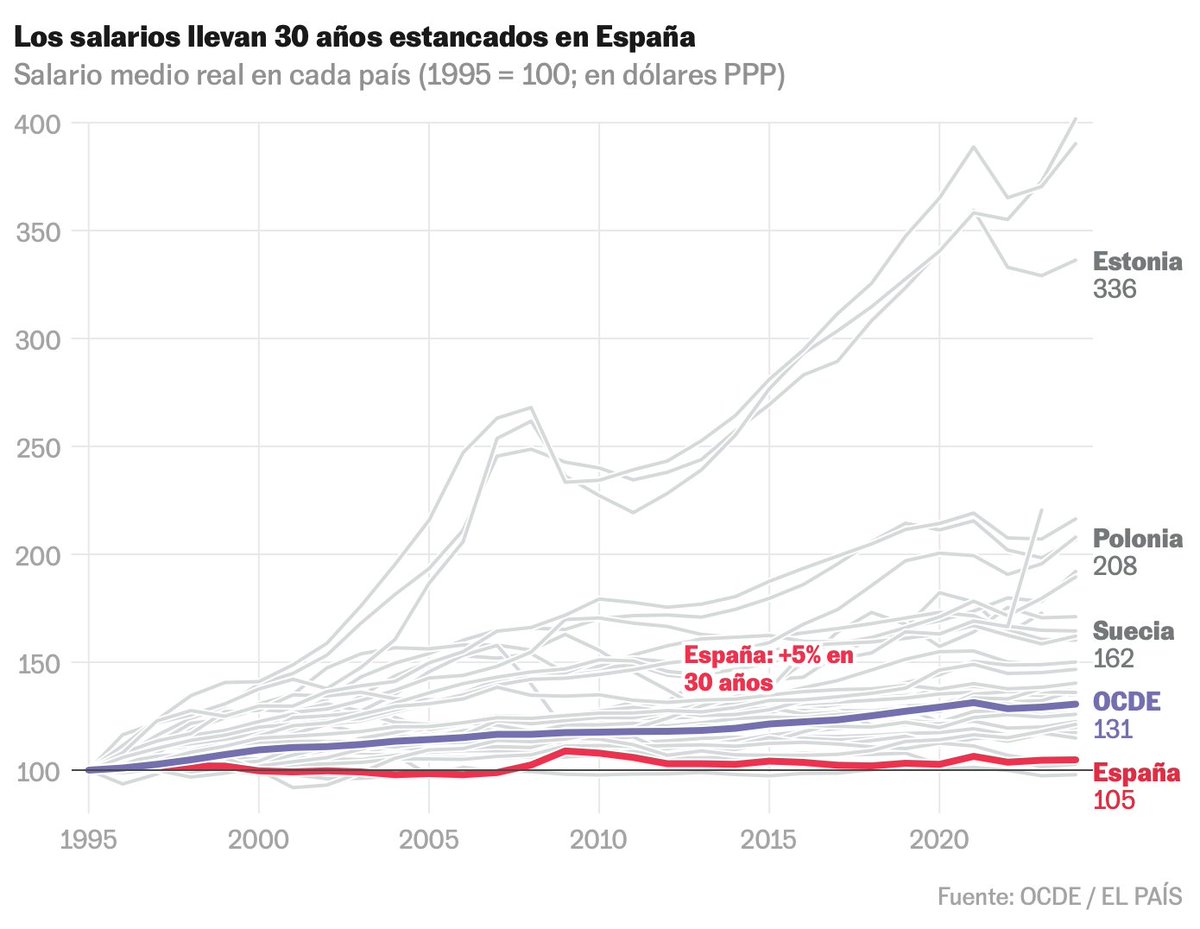
💰 ¿Suben los salarios en España?
En realidad llevan 30 años estancados. El sueldo medio real solo sube 5% desde 1995, frente al 31% de la OCDE.
Datos de sueldos, generaciones e impuestos:
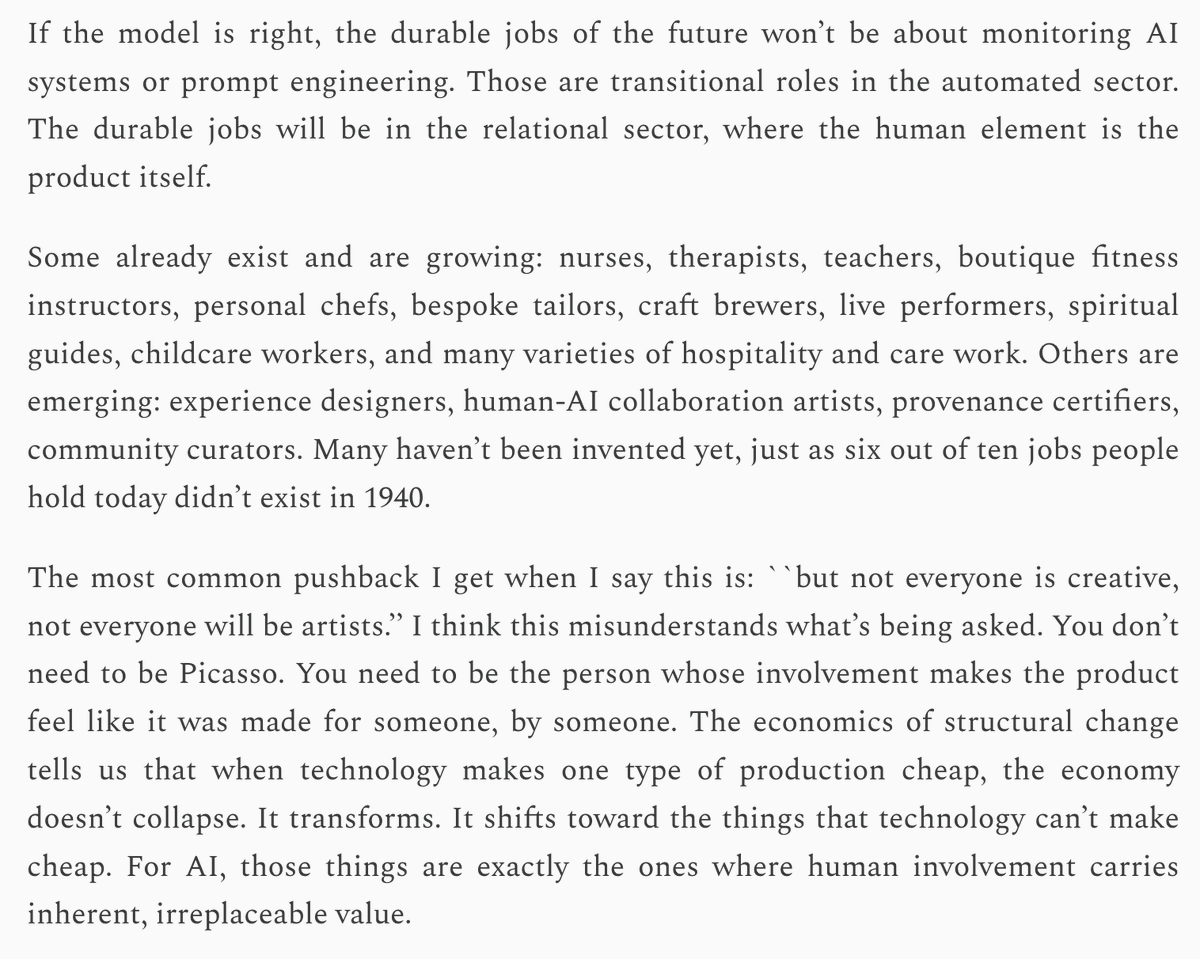
This essay by @alexolegimas is the best thing I've ever read on why AGI won't lead to mass unemployment. A compelling argument backed up by substantial empirical data.
An increasingly coherent picture of the impact of AI on jobs, by @jburnmurdoch@ft:
1. New Fed paper by Crane and Soto now confirms with official labor force survey data what private payroll analysis was showing: roughly 500,000 fewer coders are working than pre-LLM trends would predict.
2. Argues evidence consistent with my work (with Lin and Wu, link in my pinned post) on weak/strong bundles: junior developers and contractors hold "weak bundles" (their work is mostly standalone coding that AI can substitute directly), senior developers hold "tight bundles" where coding is combined with domain expertise, judgment, and cross-functional responsibilities, making substitution much harder.
3. Freund & Mann and Gans & Goldfarb add a second lens: what matters is the value of the tasks that survive automation. Remove coding from a senior role and you free up time for higher-value work; remove it from a junior role and almost nothing remains.
https://t.co/uqkcvtxfvg
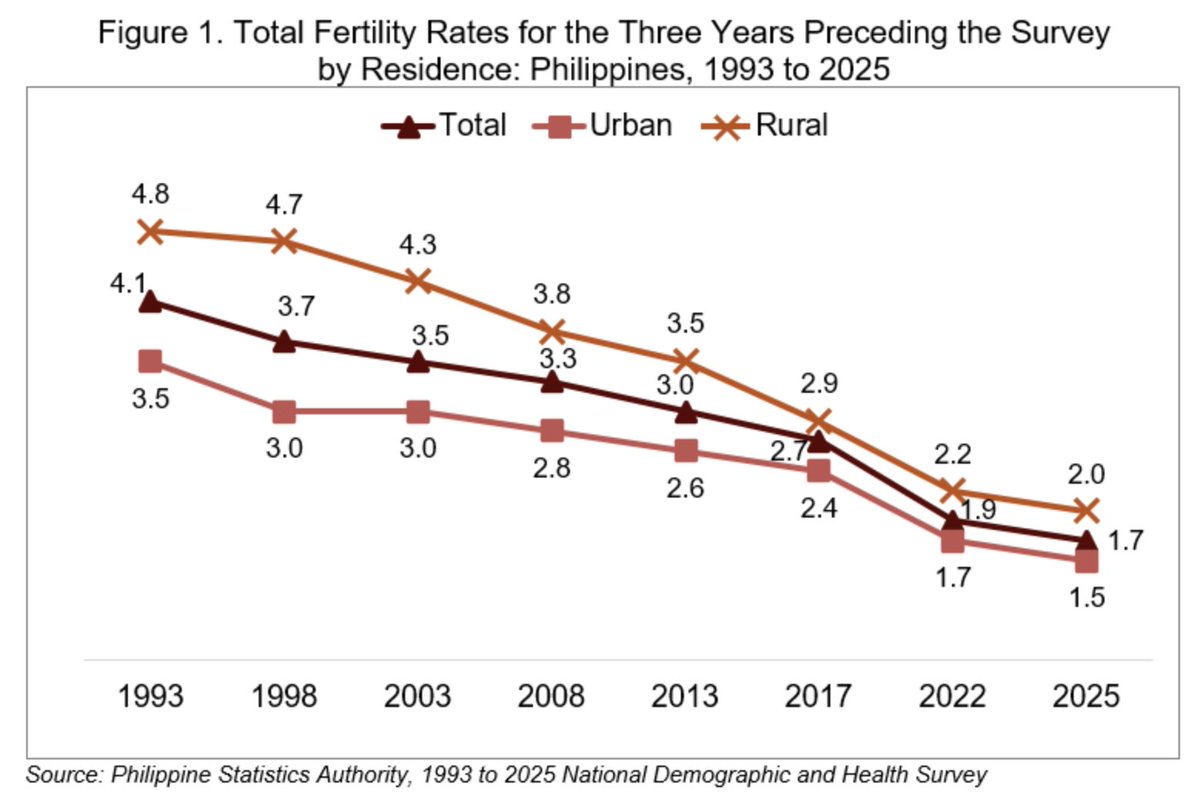
The Philippines is a fantastic example of how deep and fast the drop in fertility is nearly everywhere on the planet.
Just last week, on March 30, 2026, the Philippine Statistics Authority released the 2025 National Demographic and Health Survey (NDHS). The total fertility rate for the last three years has reached 1.7 children per woman, a dramatic fall from 4.1 in 1993, and well below the replacement rate (around 2.1 for a country like the Philippines).
Since the NDHS computes the total fertility rate over three years, and it is dropping quickly, the total fertility rate for 2025 alone should be around 1.6, the same level as in the U.S. Let me repeat this: the Philippines and the U.S. have roughly the same total fertility rate.
But U.S. income per capita is about 7.3 times the Philippine income per capita (when adjusted for purchasing power parity). Or to put it differently, Philippine income per capita today is the same as the U.S. had in 1910. In that year, the total fertility rate of the U.S. was around 3.5. At the same level of income per capita, the Philippines has a total fertility rate that is less than half.
In some more urban regions, such as Calabarzon, the total fertility rate is 1.3. Historically, the rest of the country has followed the patterns of regions like Calabarzon with some lag, so the most likely scenario is that in a few years, the Philippines will have a total fertility rate of around 1.3 as well.
Compared with the United Nations World Population Prospects (WPP), the Philippines is now at the fertility level the WPP had forecast for 2047, despite the aggressive reduction it made to the Philippines’ forecast fertility between 2022 and 2024.
The Philippines is interesting because, compared with other Asian countries, it is a relatively religious and rural country without the Confucian obsession with education found in China or South Korea.
It is also a country that many still associate with high fertility. Just yesterday, one reader left a comment on my previous post on fertility, using the Philippines as an example of high fertility, that “refuted” my claims. No, it does not.
Finally, three technical points.
First, I am reporting total fertility, not completed fertility (and yes, I am keenly aware of the difference between the two). Looking at age-specific fertility rates suggests that completed fertility for younger women will actually be below the current total fertility rate.
Second, no, emigration does not matter here. I am talking about fertility rates, not birth rates.
Third, the official release:
https://t.co/jlzpYOsYYk
Famously (there is a beautiful Works in Progress piece on this) in 2016, Geoffrey Hinton told an audience in Toronto that medical schools should stop training radiologists, since AI would soon outperform them at reading scans. Ten years later, there are more radiologists than ever, and they earn more than they did then.
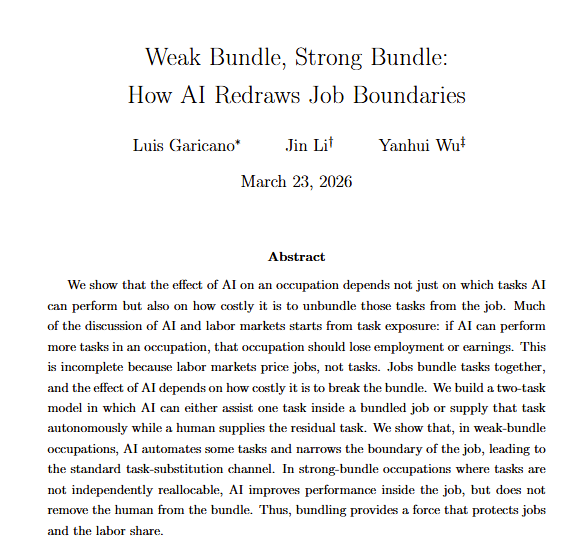
Hinton was right about the task, but he was wrong (so far!) on the future of the radiology profession. Times have never been better for them. The gap between those two claims, the difference between tasks and jobs, is the subject of a paper I have written with Jin Li and Yanhui Wu, and that we release today: "Weak Bundle, Strong Bundle: How AI Redraws Job Boundaries." (Very relatedly we are also finishing the first draft of our book "Messy Jobs" on AI and Jobs!! You will be the first to hear).
We start from the observation that the growing literature on AI and labor markets measures the AI shock by task exposure: people count how many tasks AI can perform in a given occupation AI can perform, and infer that more exposure means more displacement. Eloundou et al. published a paper in Science in 2024 that started this literature, and many follow the same logic. The inference they make is that the more exposed tasks, the worse the outcomes.
This is incomplete, because labor markets price jobs, not tasks. A radiologist does not just sell image classification, but does many other jobs: triages cases, communicates with other physicians, trains residents, makes the difficult decisions, and signs a diagnosis. The market buys a bundled service. The question AI poses is not whether it can do one task inside the bundle. The question is whether that task can be pulled out.
Thread (1/3)
https://t.co/wEYMfjGbeX
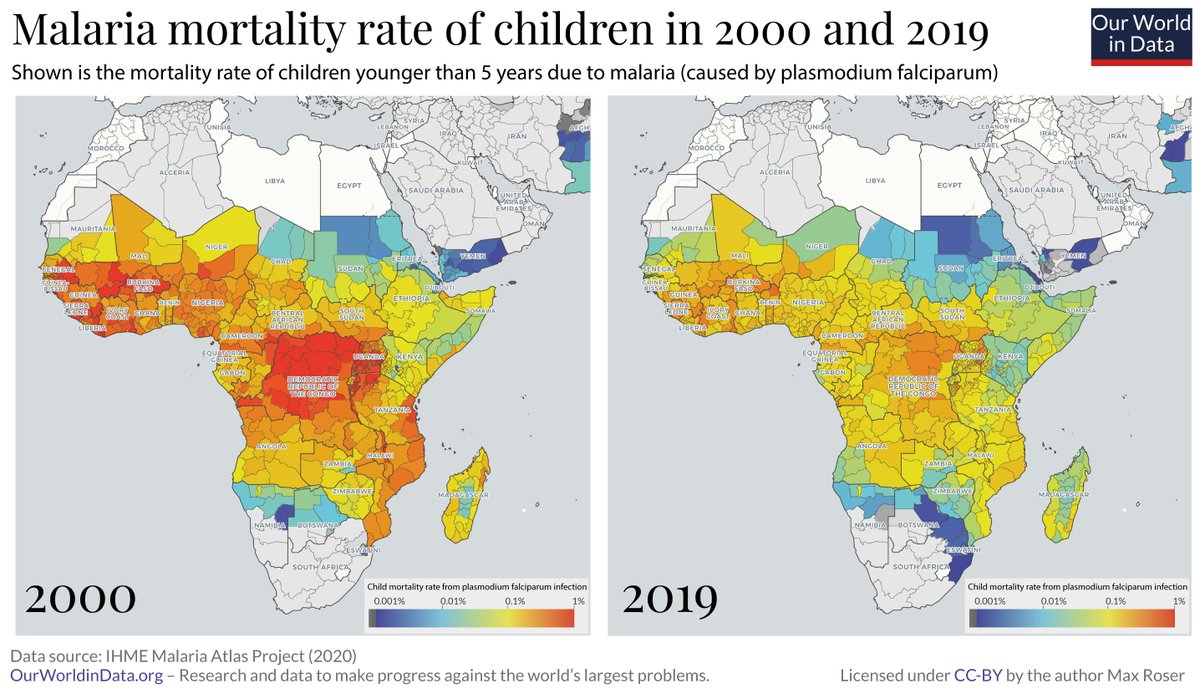
We do not have to live in a world where over 1,300 children die from a preventable disease every day.
Malaria is one of the leading causes of child deaths, but progress is possible — and you can contribute to it.
En esta entrevista, @Gil_JavierGil dice en El Mundo que la crisis de vivienda no es por escasez sino por "demanda especulativa", y que la narrativa de la falta de oferta solo busca favorecer a especuladores.
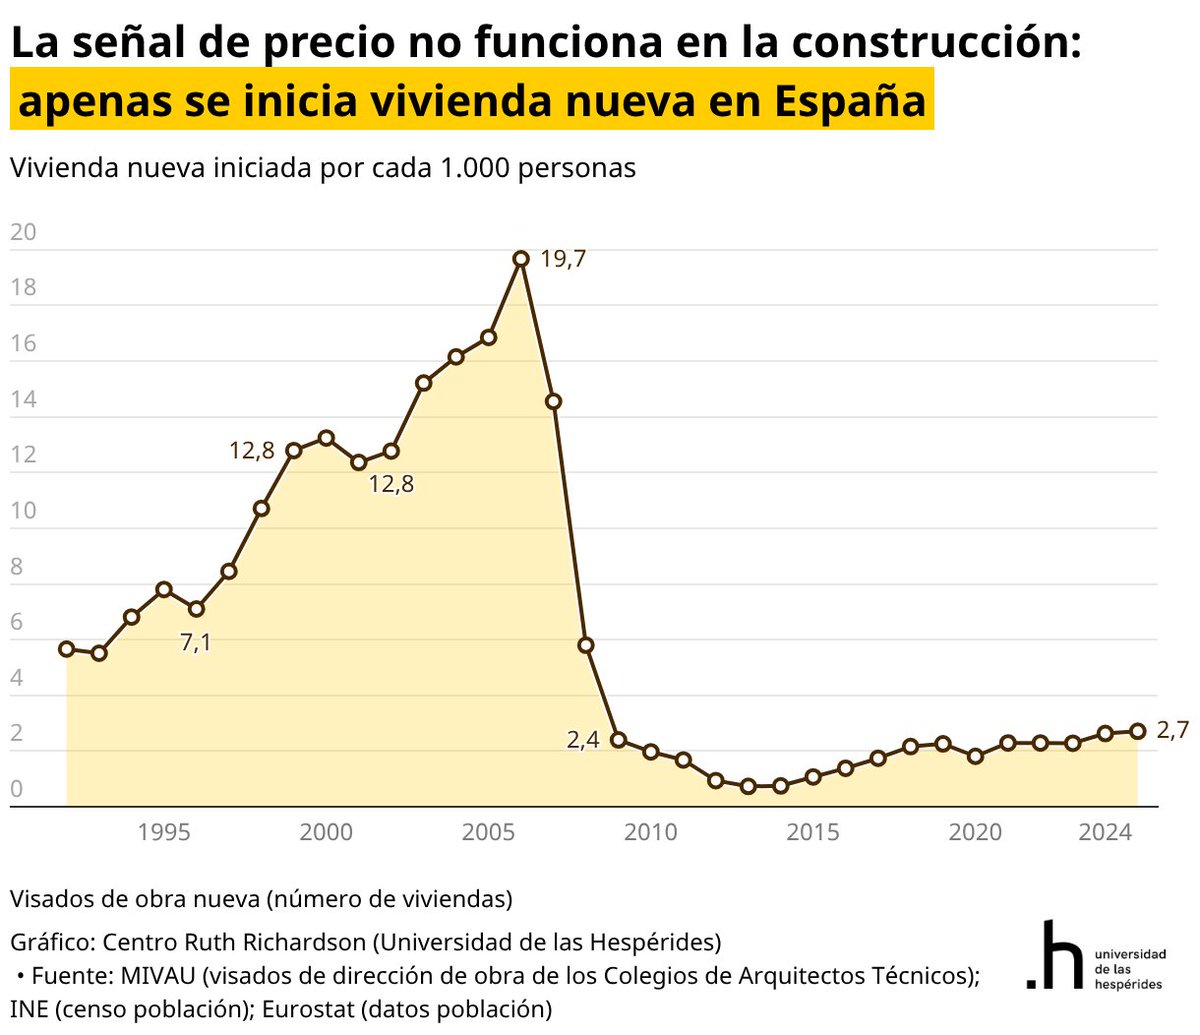
Los datos dicen lo contrario. Desde 2020 el precio de la vivienda ha subido más de un 40% (el doble que el IPC), pero apenas se inician 2,7 viviendas por cada 1.000 habitantes frente a las 12-13 de finales de los 90.
¿Por qué no se construye? Porque la rentabilidad neta de la construcción es negativa (-0,1%). Es de las actividades menos rentables de España: percentil 13 de 78 sectores. El 95,7% del suelo está excluido de la edificación, el coste real de construir ha subido casi un 50% por la carga regulatoria, y transformar suelo en vivienda tarda entre 10 y 15 años.
No es especulación: es un bloqueo político de la oferta. Pedir más intervención estatal sobre un problema causado por la propia intervención no es la solución.
https://t.co/wUCZAsZGsI
One of the more frustrating trends in public life over the past decade is how people who lead failing institutions blame social media for their failures.
A university president whose faculty have become political activists instead of educators and whose administrators multiply like rabbits will tell you that “misinformation on social networks” is eroding public trust in higher education. An editor whose publication lost its readership will claim that the real problem is X, rather than consider that the publication became boring, that the writing was uniformly uninspired, and that it stopped covering anything that mattered. A politician who loses an election will blame Meta algorithms rather than admit that voters simply did not like what was offered. A central banker whose institution missed the worst inflation in 40 years will worry publicly about TikTok videos spreading financial illiteracy.
The pattern is always the same. The institution fails at its core mission. The public notices. The people in charge, rather than examining what went wrong, identify an external force that is “polarizing.” The diagnosis is never “we did a poor job.” It is never “we lost our audience because we gave them nothing worth reading.” The diagnosis is always “bad actors are distorting the conversation.”
This is not new, of course. Before social media, talk radio was the scapegoat. Before talk radio, it was television. Before television, it was tabloid newspapers. Every generation of leaders has found a communication technology to blame for people’s loss of trust in them.
What is new is the intensity and the shamelessness. Over the last few years, “social media” has become a universal excuse that requires no evidence and tolerates no scrutiny. It is deployed reflexively.
The people who make this argument never seem to ask the obvious question: why are people on social networks so receptive to criticism of your institution in the first place? If your university were delivering excellent education at a reasonable price, no number of tweets would persuade parents otherwise. If your publication were covering important questions with clarity and substance, readers would not have migrated elsewhere. If the work you showcased were serious rather than trivial, people would still be paying attention.
Trust is not destroyed by social media. Trust is destroyed by poor performance, and social media makes it harder to hide. That is a different thing entirely, and the people running these institutions know it, which is what makes the excuse so cynical.
The honest version of the argument would be: “We used to be able to fail quietly because there was no mechanism for people to compare notes. Now there is, and we do not like it.”
That, at least, would have the virtue of being true.