As families continue to work, learn, and stay entertained from their homes, spectrum sharing has proven critical for national #wireless operators. #RiseOfRest-backed @AuroraInsight is tracking the impacts of COVID-19 on the wireless industry. Check it out: https://t.co/5nNjh6IH9f
There is Data Science, and there is Boba Science. // "How can I drink a bubble tea to ensure that I don’t finish the tea before the bobas?"
https://t.co/Ng4p7RKVIe
This is an absolute gift for #dataviz practitioners. New must-read research for on speed & accuracy of color palettes in #dataviz by @jeffrey_heer & Yang Liu. Get to know viridis if you don't know it already https://t.co/R7pqwckC42
For extreme redistricting nerds, @FiveThirtyEight is releasing shapefiles, @CookPolitical PVI data & Census/race data for all 7 of our interactive scenarios: https://t.co/nwZK3i0YPl https://t.co/wXjtqxlFYi
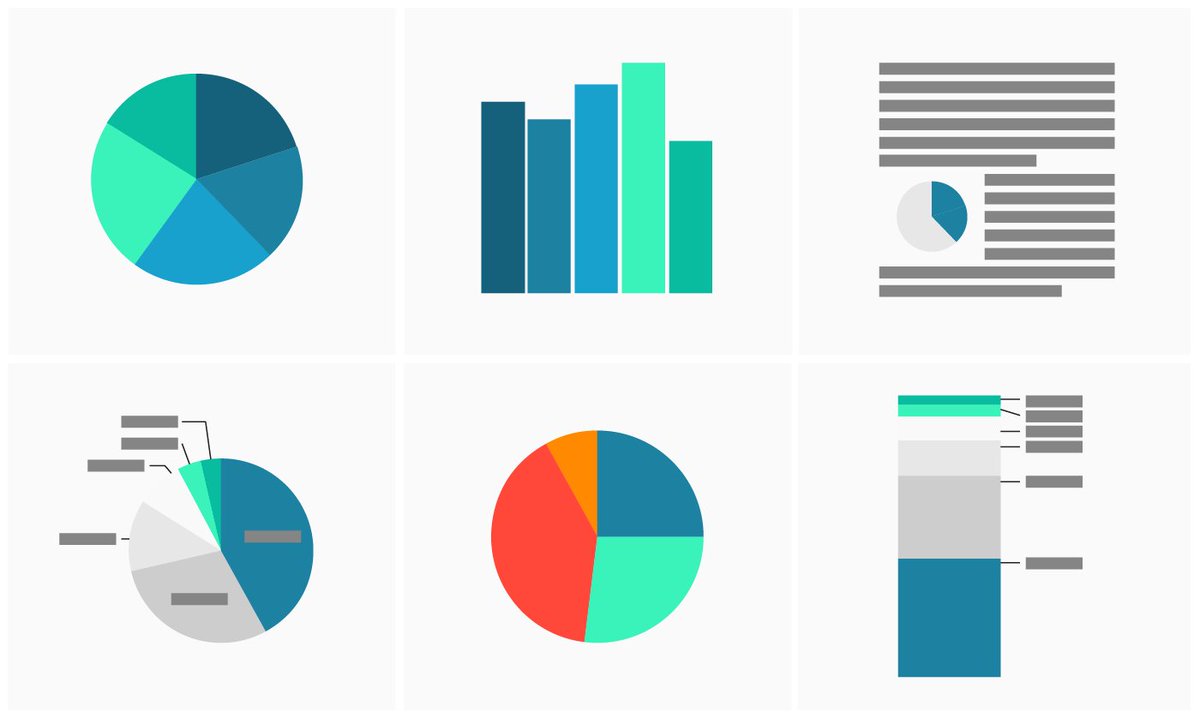
I'm so excited to write and illustrate "best practice" guides for all common chart types. Here's the first one about pie charts: https://t.co/sl2Qosey05 Let me know if you want me to add/delete tips or links! /cc @eagereyes
The science is in.
Of the 30 most-viewed @latimes story pages this year, 9 were apps or designs by a newsroom developer.
That includes, for the 2nd straight year. the #1 spot.
Evergreen multipage apps were not included. If they were tallied as a whole, 2 would break the top 5.