tradingview kullanan arkadaşlarım al sat indikatörünü kendileri de test edebilirler ;
30 eylül tarihine kadar indikatör herkesin kullanımına açık olacaktır.
ekleyeceğim linki açın favorilere ekleyin ve sayfanın altında grafikte kullan ibaresi var tıkla kullan .
Nor; x tradigview gibi sayfaların linlerine ceza veriyor yani erişimlerimizi kısıtlıyor kullanan arkadaşlar zathmet olmaz ise bir paylaşıma bir yorum yazarak ve de paylaşabilirse güzel olur .
Buyrun herkese açtım kullanabilirsiniz deneyin test edin
#bist100 #bist30 #astor #asels #thyao #tuprs
https://t.co/aTZ5lnOsmr
HaP: https://t.co/7eRrBaS6wO
HaP Elliot Ult : https://t.co/prh2Cyjb9h
HaP SMC: https://t.co/JGubWWbq2x
HaP Tarama : https://t.co/PoXWigI0cW
Değerli arkadaşlar Hap sistemlerinin ana indikatörleri belli bir süre ile herkese açık olarak paylaşılmıştır. Verilen kısayoldan favorilerinize ekleyerek kullanabilirsiniz. Güle Güle Kullanın
Going to start a series called case studies where I go over key concepts that play a huge part in my trading process.
Case Study #1: Less is more
Trading is meant to be mechanical: you set a SL + TP and you let price do its thing.
Had a fantastic entry on $IBKR Friday off the daily EMA crossover + daily hammer
I ended up stopping out this morning when price rejected $94 and the cons ended up going b/e
The problem here is that my usual process is breakeven stops go on after the first trim, never before.
I tried getting smart with it and ended up getting swept. In the grand scheme of things, price didn't even break under the daily 9.
By complicating the trade, I ended up doing more and gaining less.
You have to stick to your trade plan regardless of the PA in between.
The most important thing I look for in my setups?
**TIGHT PRICE ACTION**
Before I even think about an entry, I want to see price getting really tight.
What I like:
1. Smaller candles - The price is moving less and volatility is drying up.
2. Range getting tighter - Buyers and Sellers are getting closer to equilibrium.
3. Volume drying up - Less aggressive selling is coming into the price/stock.
4. Selling pressure cooling off - Sellers are losing their ability to push price lower.
5. Higher lows forming - Buyers are stepping in at better and better prices.
6. No volatile swings - The structure stays clean instead of getting choppy.
When I see all of this coming together, I start paying much more attention.
The tighter the price action gets, the more I want to watch it.
Because while the stock may look quiet on the chart, something important is happening underneath, the balance between buyers and sellers is changing.
And when that balance finally breaks, the move can come fast.
That’s why you have to be prepared while the setup is still quiet, not after the move has already started.
Few examples below ⏬
1. BOSCHLTD
My favorite time of the quarter is earnings season...
The market pretty much puts a handful of new leaders and emerging stocks right in front of your face
A great setup = a reason to be watching a stock
A great setup + strong fundamentals = a reason to be trading a stock
The best stocks, have a reason to go up...
-Catalyst
-Strong earnings
-Surprises
-Rerating
This all happens during the earnings season and sets up my favorite setup:
The PEG Setup
One of my favorite continuation setups is the Power Earnings Gap.
The idea is simple:
Earnings create the catalyst.
Volume confirms institutional interest.
Consolidation creates the setup.
Here’s what I’m looking for:
1. The Earnings Gap
The stock reports earnings and gaps significantly higher.
The gap is important because it represents a sudden repricing of the stock.
Instead of slowly breaking through resistance, price can jump through supply and create a completely new range.
This is often accompanied by a major increase in volume.
That first earnings move is the ignition.
2. The Stock Holds the Gap
A gap by itself isn't enough...
What happens after the gap is just as important
I want to see price ACCEPT the higher range rather than immediately give the entire move back.
Strong stocks tend to hold above important prior levels and remain above their short-term moving averages.
This tells me the market isn't immediately rejecting the new valuation.
3. Volume Contracts During Consolidation
This is one of the most important pieces.
After the initial high-volume earnings move, I want to see:
High volume on the move ↑
Lower volume on pullbacks ↓
Higher volume when buyers return ↑
Why?
Because if the stock pulls back on significantly less volume, there isn't evidence of the same aggressive selling pressure that we saw from buyers on the initial move.
The earnings gap showed demand, the low-volume consolidation suggests that demand hasn't necessarily disappeared.
4. Price Begins to Tighten
Instead of chasing the earnings candle, I want to see the stock build a tight pattern
That could be:
-Flag
-Pennant
-Wedge
-Tight sideways consolidation
This consolidation can last several days or even a week or two.
Meanwhile, the 8/21 moving averages begin catching up to price.
The goal is compression.
Large move → consolidation → compression → potential expansion.
5. The PEG Trigger
Once the stock sets up I'm looking for a breakout out of the base
If price can break out of the consolidation while volume begins expanding again, we potentially have the next leg of the earnings move beginning.
The important distinction:
I'm not buying simply because a company had good earnings.
I'm waiting for price + volume + structure to confirm that the earnings reaction is actually being accepted.
Think about the psychology:
Earnings surprise the market.
-Price gaps higher
-Institutions create abnormal volume
-The stock refuses to give back the move
-Sellers can't push it significantly lower
-Volume dries up
-Moving averages catch up
-Price compresses
-Demand returns
And eventually... Expansion.
Catalyst → Gap → Hold → Consolidation → Volume Contraction → Breakout
The earnings gap gets my attention.
The way the stock behaves after the gap determines whether I actually care about the setup.
You don't need to chase the catalyst...
You need to trade the continuation out of it
This is how new leaders are born.
low resistance liquidity is KEY
here is the A+ trade from this morning that made me $3,800
- low resistance liquidity above us
- dropped lower on open (good)
- created a 1min iFVG
- broke above it with momentum
- buy and target the LRL
YAY!
Right now its more important than ever to know the price action cycles...
As stocks bottom their characters change
This is called the cycle of price action
I originally learned this concept from @OliverKell_ and it has helped me tremendously coming out of a market correction...
Instead of focusing on dead money off the lows you wait for new emerging names to start showing momentum
The cycle is quite clear and has 4 stages:
1. Overextension reversal
Think about this as the capitulation and or bottom
The stock gets:
-Overextended from the moving averages
-Sellers start chasing
-Buyers can no longer take the pain
Leading to a strong reversal
2. Wedge pop
This is when a stock start going from dead money to tradeable and momentum is likely going to return
The stock:
-Reclaims the 50 EMA for the first time since the overextension reversal
This is the first point of interest in the stock and can help us establish relative strength
3. EMA cross back
This to me is the money maker... the stock has already reclaimed all the moving averages and now it pulls in to form a tight pattern off the EMA's
Many times this gives you incredibly tight risk with great reward as the stock is in a new established trend
The stock:
-Pulls into the key moving averages
-Forms a tight pattern
-Breaks out into new highs
4. Base and break
The stock sets up its first big base after the initial trend off the lows
This sets up for a big strong move higher later in the trend
Study this so you are prepared to take advantage of the next emerging stocks
𝗣𝗿𝗶𝗰𝗲 𝗱𝗼𝗲𝘀𝗻’𝘁 𝗺𝗼𝘃𝗲 𝗿𝗮𝗻𝗱𝗼𝗺𝗹𝘆.
𝗜𝘁 𝗿𝗲𝗯𝗮𝗹𝗮𝗻𝗰𝗲𝘀 𝗳𝗶𝗿𝘀𝘁, 𝘁𝗵𝗲𝗻 𝗱𝗲𝗹𝗶𝘃𝗲𝗿𝘀 𝗱𝗶𝗿𝗲𝗰𝘁𝗶𝗼𝗻.
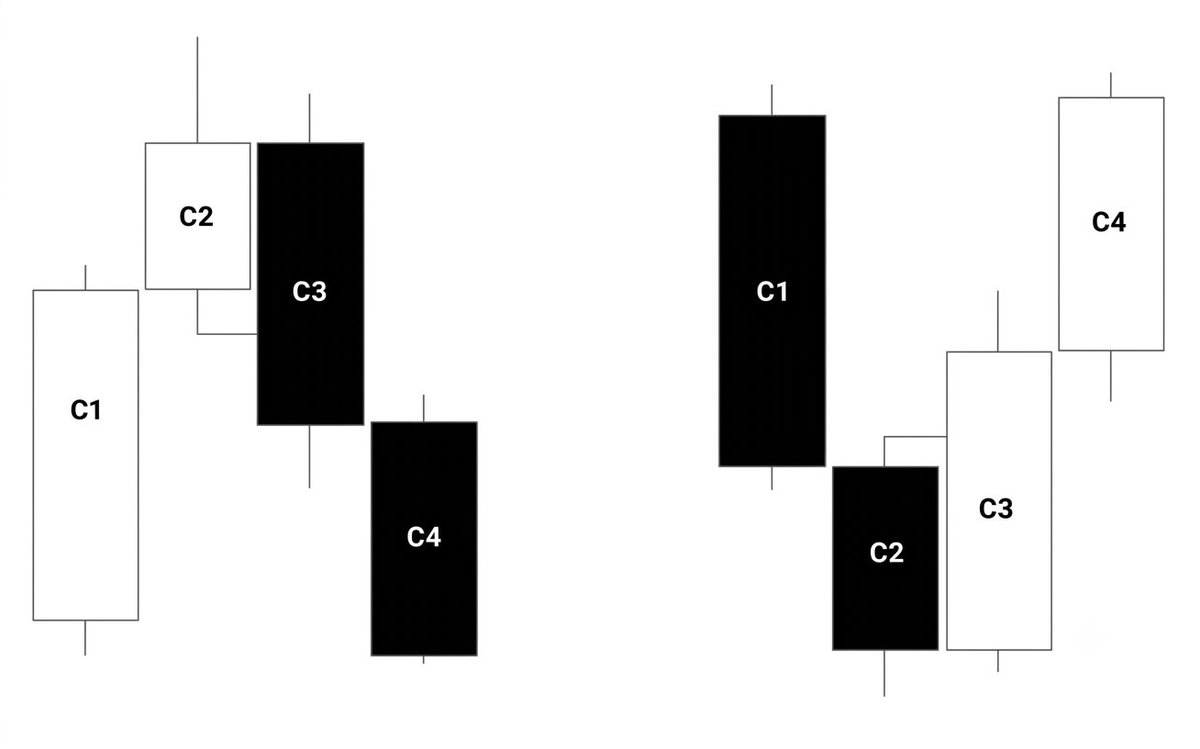
In the TTrades model 👇
• Candle 2 creates decision & imbalance
• Price pulls back to equilibrium (50%)
• Candle 3 confirms acceptance
• Candle 4 delivers the real move
If price respects equilibrium,
direction is already decided.
Candles Closures -
C2 reversal, C3 reversal, C2 reversal in expansion -Full notes 📝
🔹 Basics
The lecture explains how to identify and trade market reversals using candle patterns.
➡️Key filters:
Wick size -
Time left in the candle -
Cracks in correlation (2-step confirmation) -
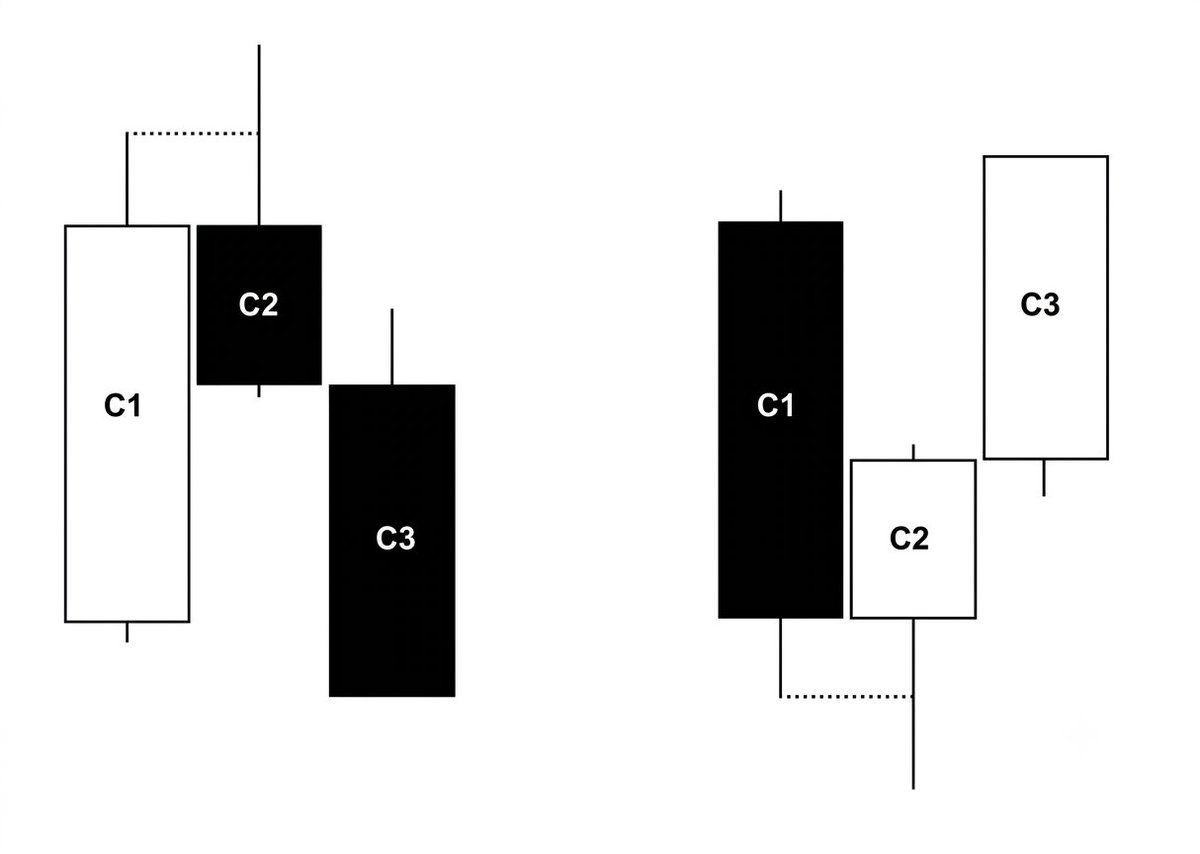
1. C2 Reversal Candle
Definition:
Price breaks the previous candle’s high/low (C1) but closes back inside its range.
What to look for:
➡️Large wick → shows strong manipulation 📌
➡️Little time left in the candle
How to trade:
Don’t trade this candle directly
Wait and trade the next candle (C3 expansion)
2. C2 Reversal Expansion Candle
Definition:
➡️Similar to C2, but has a small wick and enough time left.
Key idea:
➡️Small wick = real movement (expansion), not just manipulation
How to trade:
This is a better setup
You can enter inside the candle
Wait for a V-shape shift (CISD) on lower timeframe 🔄
Use candle high/low as stop (invalidation)
3. C3 Reversal
Definition:
Happens when C2 fails to close inside C1 range.
➡️Confirmation:
Valid only when C3 closes above/below C2 open ✔
➡️Why it happens:
High volatility
C2 didn’t have enough time to complete reversal
➡️How to trade:
-Wait for C3 confirmation
-Enter during C3 expansion
Or trade next candle (C4 continuation)
📌 Summary Rules
-You need a 2-step confirmation (Crack in Correlation) before trusting a reversal 🔍
If this is missing:
❌ Avoid trading C2/C3 setups
✅ Wait for a clearer continuation setup
Credits - @XYJtrades