When stocks and crypto were ripping, everyone asked how much higher it could go.
But that's the wrong question. The better question is what happens when the world’s biggest markets plug into new tech?
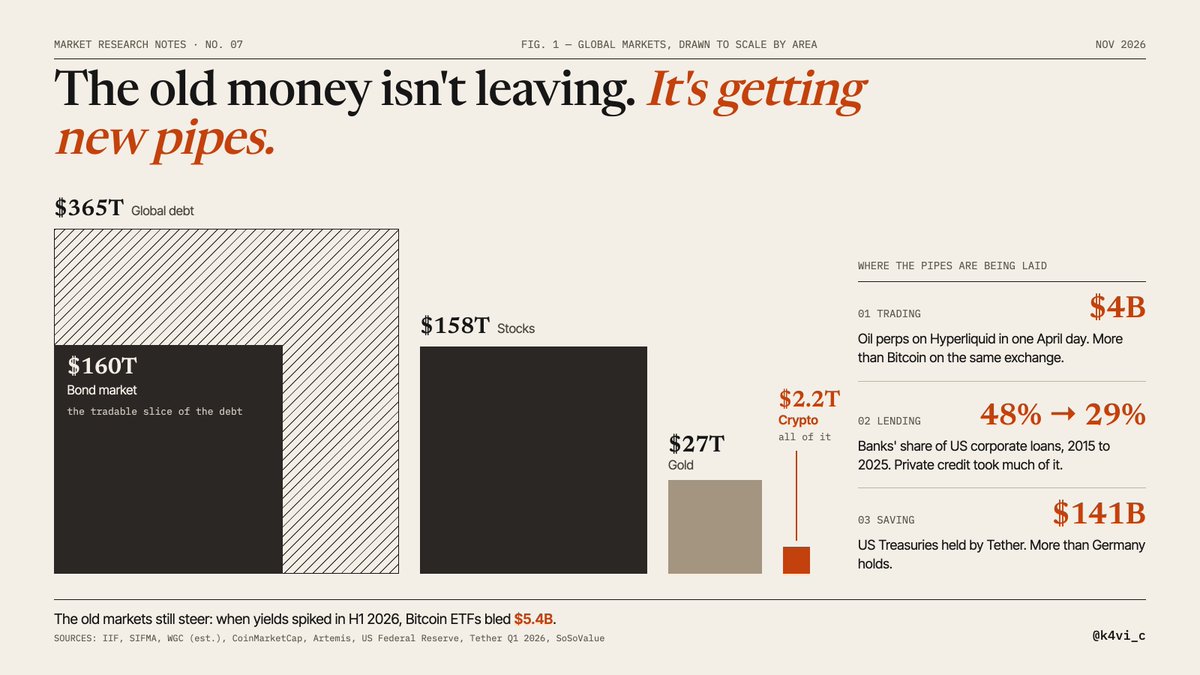
Global debt: $365T
Bond market: $160T
Stocks: $158T
Gold: $27T
Crypto: $2.2T
The truth is old money isn't leaving those markets. New tech is moving into them. Here are the cases:
1) Oil perps on @HyperliquidX did $4B in one day in April, more than Bitcoin on the same exchange. Old asset but with a 24/7 exchange
2) Banks made 48% of US corporate loans in 2015. By 2025, they made 29%. Private credit is taking more of it. Same loans but a new lender.
3) Tether now holds ~$141B in US Treasuries, more than Germany. Crypto's biggest product is a digital wrapper for US government debt.
The pattern is the assets stay the same. What changes is who's building the system they run on.
The big markets still drive everything. In H1 of 2026 bond yields spiked, and Bitcoin ETFs saw $5.4B in outflows.
So I’m not bullish on every asset. I’m bullish on whoever builds the new pipes for $300T+ of old money.
Haven't seen such a balanced argument in a long time.
Fund managers agree with you, and the gap is widening.
BofA's November survey: a record 38% say companies are overinvesting in AI, and 52% expect at least one hyperscaler to cut capex.
Your prisoner's dilemma is basically the Cold War arms race. Neither side could afford to stop building, because stopping first looked like losing.
It didn’t end with someone winning the race. It ended when the side with the weaker economy couldn’t keep paying for it. The US funded its buildup from a much bigger economy. The Soviets spent a far bigger share of a smaller one, and it helped break them.
Same test here. When the correction comes, it won’t matter who built the most. It’ll matter who paid for it out of cash flow and who paid with debt.
@NathanOyewole@userampart Pretty interesting idea. What does the program do when there is a legit but unusual trade though?
Would there be a human co-signer, or does the agent just stall?
@vladsvitanko Imo this is the thing all startups already do. Capital can only go so far for burn in product distribution or development.
Alongside capital there has to be something else. Arguably, capital is defo up there for leverage.
Are metals worth buying into now?
In January, gold hit $5,594 and silver $121.
Ten months later, gold is about 31% lower and silver is about 60% lower.
The question everyone is asking: is this the discount of the decade, or trying to catch a falling knife.
Why it fell:
1) Rates did most of the damage. Since January, 10-year real yields have climbed from below 2% to nearly 3%, Treasuries are paying over 5%, and markets put about 87% odds on a December Fed hike.
2) Gold and silver pay no yield. When cash pays 5%, holding them costs more.
3) The Iran war should have helped, but higher oil meant more inflation, which meant more hike bets. On top of that, forced selling from margin calls turned normal drops into 3% days.
//
Gold: fairly priced for today’s rates, cheap against forecasts
Gold ran from about $3,800 in late 2025 to $5,594 in January, a 40%+ gain in a few months. Today it’s back near $3,890, so the January froth is gone.
Central banks bought 321 tonnes in Q3, the most since late 2024. That gives the market a soft floor, though not a guaranteed one.
The January rally was the speculation. Most of the drop is gold repricing to higher rates.
//
Silver: the deepest discount, and the most risk
Silver is down about 60%, twice as much as gold, and the gold-silver ratio is near 80.
It’s on track for a sixth straight year of supply deficit, and most silver is mined as a by-product of other metals, so supply barely responds to price.
But solar makers are using less silver per panel, and investors are the ones setting the price right now, and they’re selling.
The old $50 ceiling, which held for 45 years, is now acting as support. If silver closes below it, that idea breaks.
Silver usually moves 1.5 to 2 times as much as gold in either direction. If gold turns, silver turns harder. If it doesn’t, silver falls harder too.
//
Precious metals are not broken. They are being priced against 5% Treasury yields, and the speculative froth from January has been fully washed out.
Central banks are still buying gold at the fastest pace in two years, and platinum and silver are still in supply deficits.
What is missing is a catalyst, and the most likely one is the Fed signaling it is done hiking.
So: start building gold and platinum now, in small pieces. Hold silver for the turn. Buy copper only on weakness.
@SternDrewCrypto Security is in blockchain and crypto technology.
These outages will inspire a new generation of businesses and investment opportunities.
@VadimStrizheus Everyone will say marketing because technical is that much easier to have.
The problem that starts to arise is when the company does distribute big enough, the technical cofounder will be the reason behind the moat of the company.
I ran the math on "Bitcoin never drops below electrical cost."
It's false. BTC has broken below it 4 times.
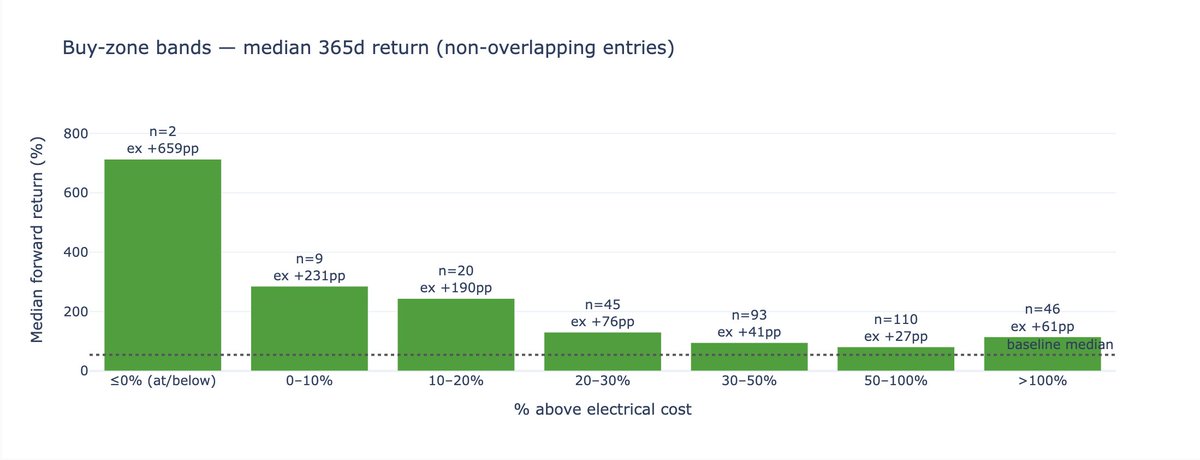
But the data showed something more useful: the best place to buy isn't below cost. It's 0–20% above it.
Here's the data if your interested:
How I tested it:
The network's daily electricity bill ÷ BTC mined that day.
I used Cambridge's energy data (CBECI) × $0.05/kWh, the same assumption Capriole uses, and daily candles from Bitstamp, Coinbase & Kraken.
Every time BTC broke below electrical cost:
1) Nov 2018: 3 days, ~4% below → +83% a year later
2) Mar 2020 (COVID): 8 days, ~32% below → +1,080%
3) May 2020: 2 days, ~1% below → +312%
4) May 2020: 1 day, ~2% below → +346%
14 days in total. Rare, but isn't 'never'.
The $55K figure doesn't hold either.
At $0.05/kWh, today's electrical cost is ~$49K.
To get to $55K you have to assume ~$0.056/kWh, and at $0.06 cost, Bitcoin has already spent 122 days "below cost."
So I asked a better question: how far above electrical cost has been the best place to buy?
Median 1-year return, by how far price was above cost (one entry per stay in each band):
0–10% above → ~285% (9 episodes)
10–20% → ~244% (20)
20–30% → ~131% (45)
30–50% → ~96% (93)
50%+ → close to baseline
The edge is strongest within 20% of cost and mostly gone past 40–50%.
Where we are now: ~$65K price vs ~$49K cost, so ~30% above. That's the outer edge of the buy zone, not deep value.
Where this breaks: the deepest bands have small samples (barely happens), the cost line drifts down with price as miners shut off rigs, and Cambridge revised its history in 2023.
Code + full report, help refine it: https://t.co/1oEbTmI9vg