HOW TO STOP CREATING SHIT SYSTEMS
1️⃣ Start with a reason, not a chart.
If you can’t explain WHY it should make money (a behaviour, a flow, a structural edge), you’ve found a pattern in noise. No hypothesis, no system.
2️⃣ Write the rules before you test.
Entry, exit, stop, size. Written down. If you change them after seeing the results, you��re not testing, you’re fitting.
3️⃣ Fewer parameters.
Every extra parameter is another way to overfit. The best systems I run have almost nothing to tune.
4️⃣ Test on data it has never seen.
A backtest on the data you built it on proves nothing. Hold data back. If it only works on the data you tuned it on, it doesn’t work.
5️⃣ Test it on other markets.
A real edge shows up somewhere else too. If it only works on one chart, it’s a coincidence.
6️⃣ Put real costs in.
Spread. Slippage. Commission. Half the “profitable” systems on Twitter die the moment you do.
7️⃣ Nudge the settings.
Change every parameter a little. If the results collapse, the system was never robust, it was lucky. A real edge survives small changes.
8️⃣ Judge it by drawdown, not profit.
Prop firms don’t care how much you made. They care how much you lost. Know the worst case before you go live.
9️⃣ Don’t marry one system.
Build several that win and lose at different times. One strategy is a bet. A portfolio is a business.
🔟 Automate it and take your hands off.
A system you override isn’t a system. Rules in, emotions out.
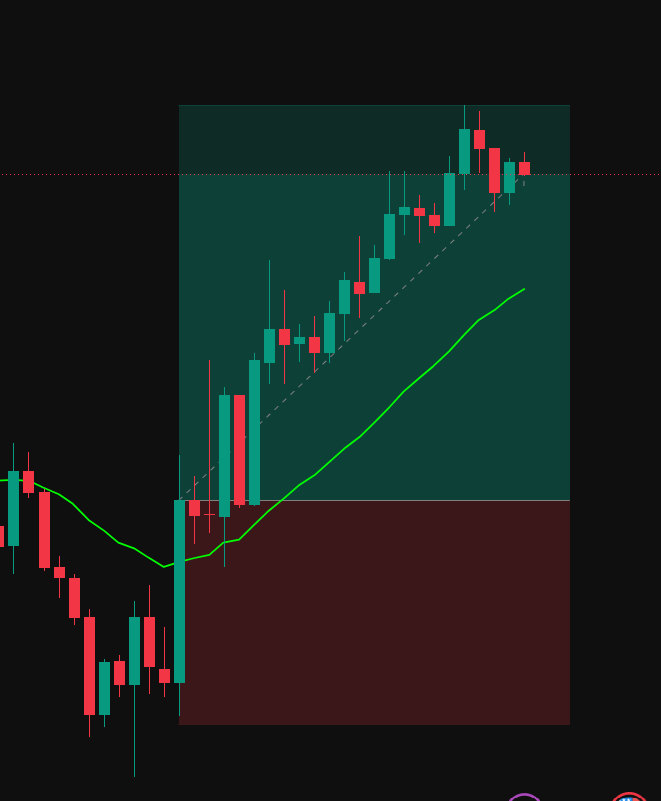
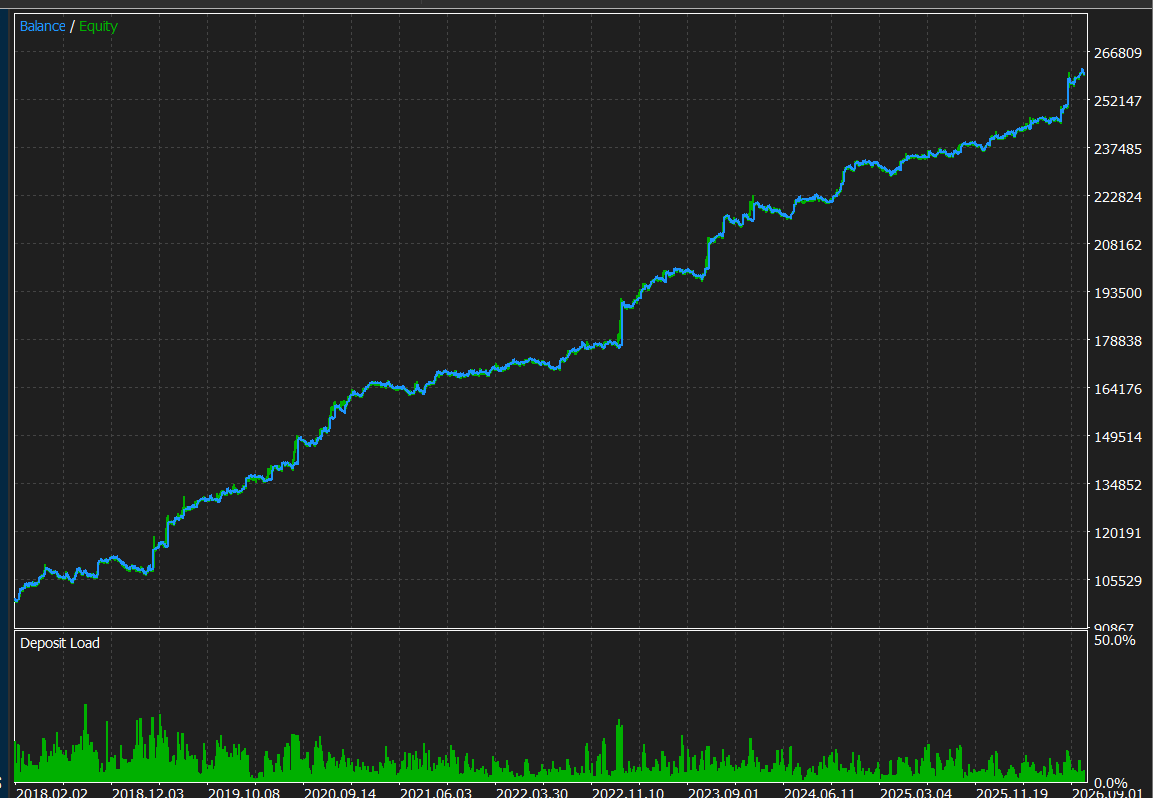
This simple 4H USDJPY breakout strategy has been part of my prop firm portfolios for the past year.
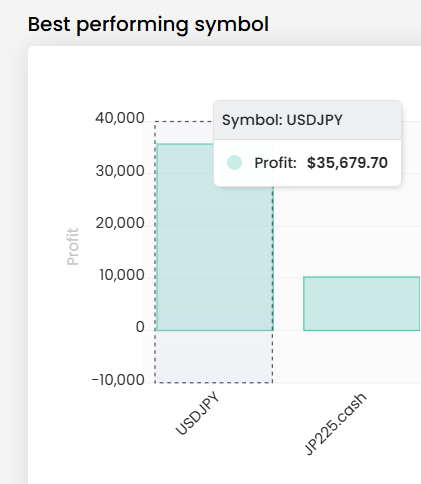
It helped generate $35,679 in profit on USDJPY alone.
Today I’m giving away the whole thing. For free.
The core idea:
USDJPY is one of the cleanest trending pairs in FX. When the yen is used as a funding currency, it tends to trend for a long time.
I don’t predict the move. I wait for price to prove strength, then I follow it.
Why it works:
• Macro carry
• Long-term upward drift
• Trend continuation
• Volatility expansion
• Asymmetric payoff (small losses, big winners)
No magic entry. A structural edge + simple rules.
Exact rules (4H timeframe):
1️⃣ Market: USDJPY
2️⃣ Direction: Long only
3️⃣Entry: Price closes above the 200 EMA
4️⃣Stop loss: Volatility-based (ATR) or Low of last 5-10 candles
5️⃣Exit: Trail winners / exit when price closes back below the 200 EMA
You can use this on any prop firm that allows swing trading @FTMO_com@BrightFunded@fintokei@the5erstrading@E8Markets@MyForexFunds
or even adapt it for futures firms including @TradingLucid@MyFundedFutures@ApexTradeFund
One strategy is never enough, though.
In my portfolio it runs next to other systems on different markets so no single one can sink an account.
The complete strategy and code are in our free Discord today. Link in the first reply 👇
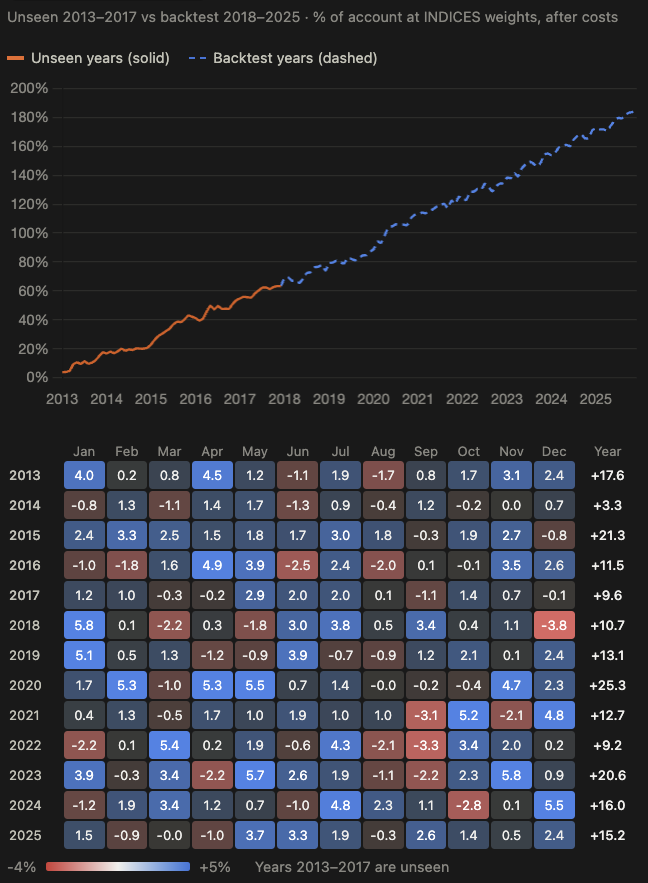
All my indices strategies were developed (both IS and OOS) using data from 2018 onwards. I got access to intraday data from 2013 on Dax, Nasdaq and Nikkei and retested my strategies on those years. All strategies were profitable on these unseen years and two even performed better on them. This confirmed two things:
- My strategies were not overfitted
- The notion that the market has changed so much that what works in recent years, won't work on much older data... clearly false.
To my fellow CFD traders, get some futures data and test your strategies on these years if you never had. Good reassurance.
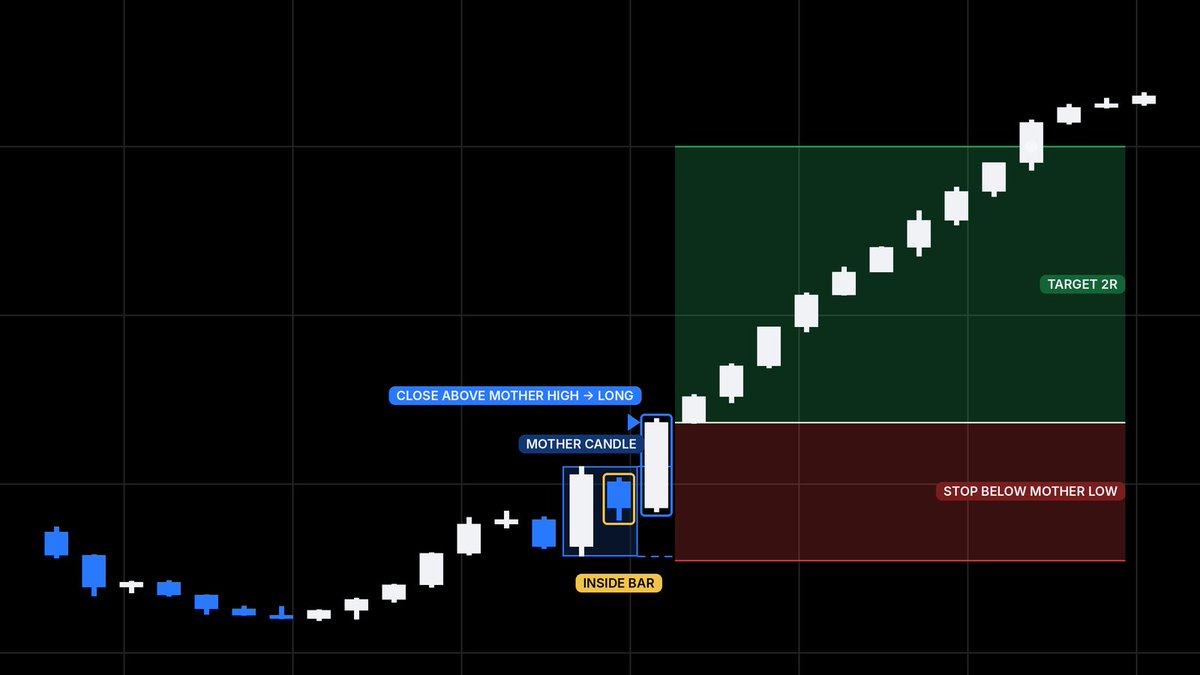
The simplest breakout setup I've ever automated, with the help of RoboQuant
1) Find a big candle, the mother candle
2) Wait for the next candle to stay completely inside it
3) A candle closes above the mother high, you go long. Below the low, you go short
4) Stop on the other side of the mother candle, target 2R
The inside bar is the market pausing. Energy builds up, and the close outside the mother candle tells you which side won
See first comment to access all my free strategies
René Balke’s range breakout was my first profitable algo strategy.
He shared his settings openly on YouTube, I started building on them, and it ended up being my go-to trading system.
He’s been trading live on YouTube since 2024 with 3 algos:
• Range breakout
• Go long on indices
• Turnaround Tuesday
His live account is up over $100k in the last 2 years.
In a recent stream, someone asked if he does IS/OOS, robustness checks, Monte Carlo, walk-forward…
His answer: “Honestly, I don’t do any of that.”
So how are his strategies still profitable without all the tests most Kwant traders swear by?
I think it’s because every strategy has real logic behind it:
• Indices tend to go up over time, so he just goes long every day. (Sort of - I wake up and buy - but for real😀)
• Turnaround Tuesday is a simple, well-known market pattern
• Range breakouts trade the volatility at the session open
And he doesn’t over-optimise. He runs the settings that make sense to him.
That’s the lesson here. If the strategy has a real market concept behind it and you don’t overfit it, it can work.
It's a shame he is not on Twitter. Would love to engage with him.
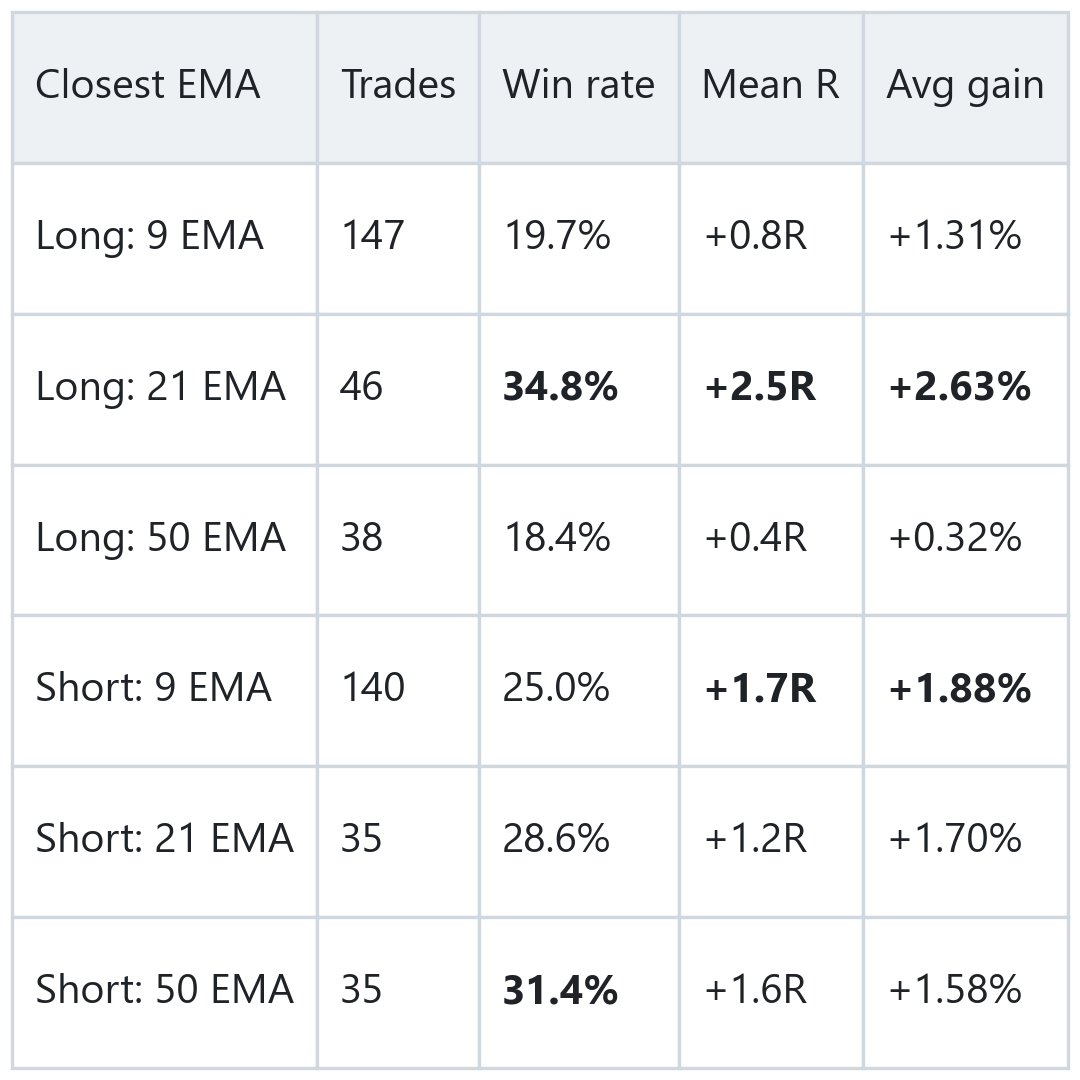
This table should probably be it's own 3 hours masterclass video, but sharing it first here..
For anyone studying Martin's pullback strategy key question is "What moving averages shall we use"?
This table answers that.
And it shows what to expect of each.
For longs, 21 EMA is the clear sweet spot. 50 EMA is borderline no-go (but small sample)
For shorts, win-rate improves steadily as EMA increases, but 9 EMA still produces the highest mean R and avg gain
Here's some additional valueable key insights:
Martin's pullback setup was first developed for the short side
MARTIN LUK: Actually I learned the pullbacks mostly from the short side first... For shorts, the best risk-reward play should be shorting at the resistance, right at the bounce or the pullback into the declining EMAs or into the resistance levels. So this is how I really dig deep in the pullback side, and also I just flip the short side around and then it will be the long side, and they are really similar.
Why does he take 2/3 of his pullback longs at the 9 EMA when 80% fail, whereas 21 EMA longs has almost double win-rate and triple expectancy?
MARTIN LUK: Then I bought it at the pullback on the daily 9 EMA... I think this one would be a fair entry. Definitely not the best one because it's like a slight pullback, and generally a pullback to the daily 9 has the lowest win rate amongst—or like a slower EMA will have the highest win rate—from my study. But sometimes stocks, you have to take risk. Sometimes if the stock pulls back to the 21, then you have a better entry, more high-win-rate entry, you have more conviction, or the risk-reward will be much better. But sometimes the stock, if it's strong like Tesla here, it doesn't pull back to the 21. So this time I'm just trying to take a risk and trying to test whether it works or not
If we go back and look at the uptrend, especially a strong uptrend that the semi sector has made or the Qs has made: a lot of the times we get an uptrend, then we pull back into the 21 EMA and re-bounce at the 21, and then we start another uptrend—we start another leg up.
WHY NOT JUST SKIP 9 THE 9 EMA FOR LONGS?
Runaway Stage 2 leaders (MRVL, AAOI, NBIS, etc)
surf the 9 EMA without touching the 21 EMA for weeks. To not miss the strongest momentum stocks in the market, Martin probes the 9 EMA aggressively with ultra-tight ~1.2%–1.5% stops
WHY DOES 50 EMA LONGS FAIL, BUT 50 EMA SHORTS WIN?
Don't have a good answer for that, yet.
MARTIN LUK: I don't have a really good statistic on that, but... I tried this recently with the cybersecurity longs like NET. Before them, I think I rarely tried this type of pullback buys just purely off the 50 EMA. To me, it's a little bit more difficult and I'm still not good at doing that. I would prefer a pullback buy into the EMA convergence—when the EMAs are converging really close to each other—instead of purely buying the pullback into the 50 EMA.
Compare that to how he describes his bread-and-butter 50 EMA Short:
MARTIN LUK: Stocks tend to decline immediately, without further basing, right after being rejected at the declining moving averages, particularly the 21 and 50 EMAs. The tighter the EMAs, the higher the rejection rate.
I think the ideal picture-perfect [short] would be the first breakdown of the 50 EMA and then the first pullback into the 50 EMA—and generally when [you get] the first breakdown and then a pullback into the 50 EMA, the 21 or the 9 would also be really near the 50 EMA too, and they start curling back and crossing down the 50 EMA
---
A ton of other insights related to this particular chart.
The X ideas bucket is done.
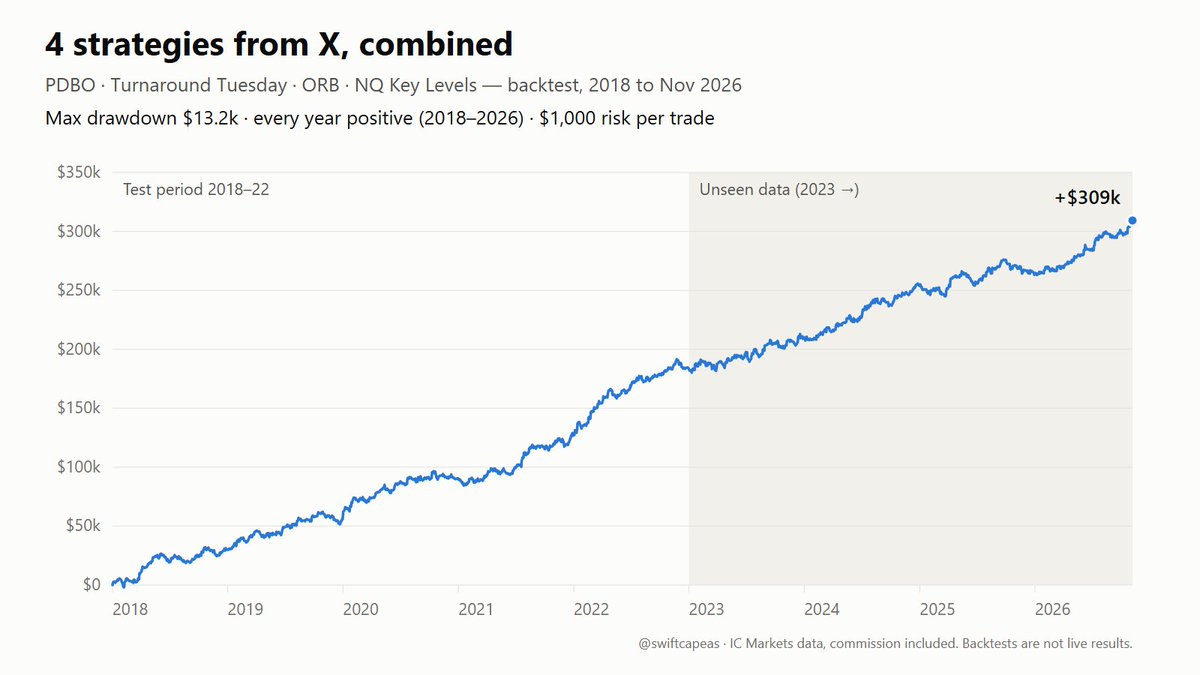
15 strategies tested, all collected from here.
4 made it. 11 didn’t.
Survivors:
• PDBO (USDJPY + NQ)
• Turnaround Tuesday (indices)
• ORB on NQ
• NQ Key Levels
Every idea went through the same steps: a scan on 40+ markets, robustness checks, a test against random entries, then years of data it had never seen.
What killed most of them wasn’t the backtest. It was the unseen data. Plenty looked great 2018–22 and just stopped working after.
Daily correlation between the 4 survivors is close to zero. Combined, the drawdown is less than a third of what they’d have run separately.
Next: they all go into one Twitter Portfolio EA, running on a prop account. Will keep adding to this as I find more strategies here.
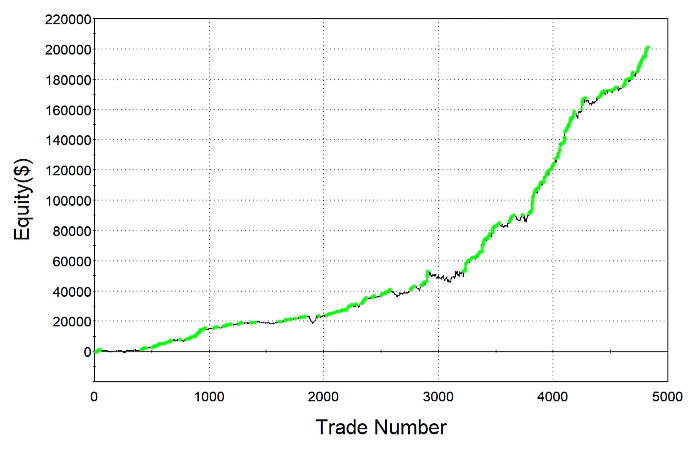
Triple RSI Trading Strategy – Boost Your Win Rate to 90%
In this post, we explore a fresh perspective on RSI with the Triple RSI Trading Strategy. This modified approach uses the RSI indicator in a different way and boasts an impressive 90% win rate.
With just 83 trades since 1993, the strategy may seem conservative, but each trade delivers an average gain of 1.4%.
We backtest the following trading rules:
➤ The 5-day RSI is below 30.
➤ The 5-day RSI has declined for three consecutive days.
➤ The 5-day RSI reading was below 60 three trading days ago.
➤ The close is above the 200-day moving average.
➤ If all four conditions are met, buy at the close.
➤ Sell at the close when the 5-day RSI crosses above 50.
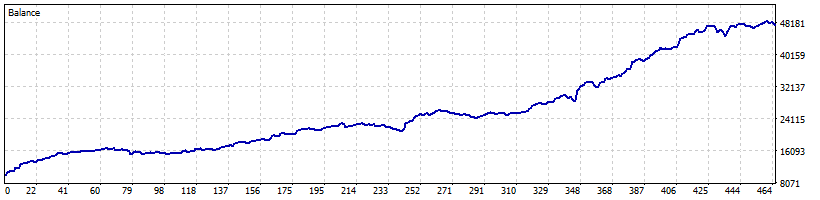
We backtest the strategy on SPY, the ETF that tracks the S&P 500. When we enter these rules into AmiBroker, we get the equity curve shown below.
Can the strategy be improved or tested with different rules? If you have any suggestions, please comment 👇
#TradingStrategies
Only 7% of people who buy a prop firm challenge ever get paid.
93% pay the fee and walk away with nothing.
I’ve passed challenges at multiple firms, and I don’t do it by gambling.
So I made a video showing EXACTLY how I’d pass my first prop firm challenge if I was starting again in 2026.
Step by step:
→ How to choose a strategy that can actually pass
→ How much to risk per trade (most people get this wrong)
→ Why one strategy isn’t enough
→ How to use statistics instead of luck
→ What to do after you get funded
No hype. No “pass in 2 days” nonsense.
Just the maths and the process.
Full video below 👇
FREE STRATEGY ALERT💎💎
The simplest trend strategy I’ve ever tested.
ONE moving average.
ONE stop loss.
That’s the whole system.
The rules:
If the 50 MA is sloping up → buy.
If it starts sloping down → get out.
Trail an ATR stop the whole way so the winners can run.
No take profit.
No 10 indicators.
No “this setup looks good.”
I turned it into a free TradingView indicator.
It draws every trade with RR boxes and shows the full stats board, so you can test it on any market yourself.
Grab it free in my Discord, link in the first reply👇
I built a “one bar” strategy on NASDAQ.
Then ran it on S&P 500, MidCap 400, and Dow Jones with zero changes.
It was profitable on all four.
Exact rules:
- Market: E-mini NASDAQ (NQ), 30-minute bars, 24-hour session
- Direction: Long and short
- Long entry: Buy stop at the highest high of the last 50 bars
- Short entry: Sell stop at the lowest low of the last 50 bars
- Exit: Close on the next bar at market open
- Stop loss: $1,000 per trade
- Max entries per day: 2
That’s the entire system. One condition. One bar in the market. Out.
When price breaks a 50-bar extreme on 30-minute data, there’s real momentum. Holding for only one bar captures the initial burst without overstaying.
The fact it worked across four related markets with no re-optimization tells you the behavior is real.
Another portfolio built ✅
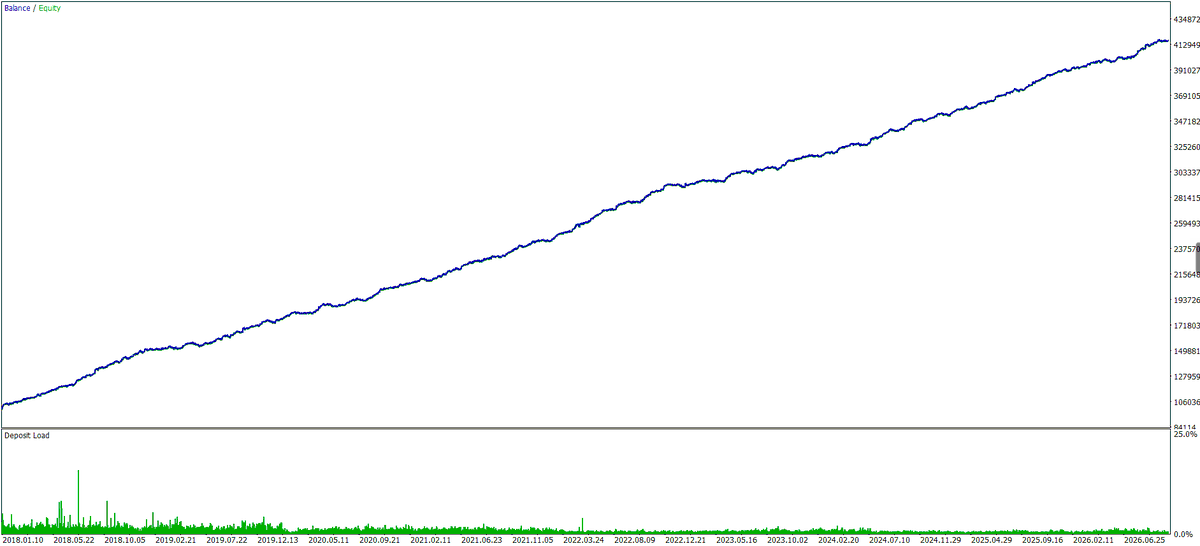
Same time-range breakout concept I’ve shared here before: mark the early market range, trade the breakout. That’s it.
What surprised me is how well it works across asset classes. FX, JPY crosses, Gold, indices, BTC. 14 systems in one EA.
The real edge is the mix. Average weekly correlation between the systems is 0.03, so when one chops, another one carries it. That’s where the smooth curve comes from.
Having AI do the heavy lifting on coding and testing has honestly been a game changer.
Quick notes on the test:
• 1m OHLC data, commission + slippage included
• 2018–2021 in-sample, 2022–2026 out-of-sample
• Real tick results come in 10–15% worse
Would you rather have:
Strategy A:
• 70% win rate
• 0.5:1 reward-to-risk
Strategy B:
• 40% win rate
• 3:1 reward-to-risk
Assuming full wins and losses:
A = +0.05R per trade
B = +0.60R per trade
Strategy B has 12x the expectancy.
Stop obsessing over win rate and start understanding expectancy.
Running 10 trading strategies doesn't mean you're diversified.
You could have:
• 3 breakout systems on NASDAQ
• 2 trend-following systems on S&P 500
• 3 momentum systems on DAX
• 2 breakout systems on Bitcoin
Congratulations.
You might have built 10 different ways to express essentially the SAME market exposure.
When market conditions change, all 10 strategies could start losing money simultaneously.
This is why strategy count means absolutely nothing without understanding correlation.
A portfolio with 4 genuinely complementary strategies can potentially be more robust than one with 20 highly correlated systems.
And here's something most traders overlook:
The best strategy isn't necessarily the best strategy to ADD to your portfolio.
A system with mediocre standalone performance might significantly improve your overall portfolio if its returns behave differently from your existing systems.
Stop optimizing individual equity curves.
Start optimizing how your strategies work TOGETHER.
That's where portfolio construction begins.
You can have a PROFITABLE trading strategy and still lose money trading prop firms.
Read that again.
Imagine you've developed a strategy with:
• Positive expectancy
• Profit Factor: 1.50
• 10 years of profitable backtests
• Maximum historical drawdown: 12%
Sounds great, right?
Now put that same strategy inside a prop firm with a 10% maximum drawdown limit.
Suddenly, your profitable system can breach the account before its statistical edge has time to materialize.
And it gets worse.
You have evaluation targets, daily loss limits, consistency rules, fees, and payout restrictions.
Your strategy's expectancy and your prop firm business's expectancy are TWO DIFFERENT THINGS.
The question isn't simply:
"Is my strategy profitable?"
The real questions are:
"What's my probability of passing?"
"What's my probability of surviving until my first payout?"
"How much capital should I allocate to evaluations?"
"How many attempts can I expect before receiving a payout?"
If you cannot answer these questions mathematically, you're not exploiting the prop firm model. You're gambling on an outcome you haven't quantified.
The edge is only half the equation.
The other half is understanding the game you're playing.