$CRV
Gambling in the trenches and praying for a 100x is not how you build real wealth in crypto. Stop feeding the casino—become the casino.
100R spot trade in case the equal lows at ~$0.18 get swept and the spring of the Wyckoff Accumulation Schematic forms.
#CurveFinance
$CRV has cleared its macro lows at .18.
I’ve taken a hit on my levered longs and while I didn’t think we would revisit these lows it’s nothing I haven’t seen before.
In 2019 I picked up $10,000 of $XRP at .18, a time when nearly everyone was proclaiming it dead. In August of ‘25 it hit new all time highs at $3.60+.
This .18 level was the last major level of historical relevance on the CRV chart and since it has now been taken it’s very possible our low will be put in soon, but until we get a new technical trade setup the best approach here is to simply buy spot and chill.
Because my conviction on $CRV is as strong as my conviction on $XRP was when it was at .18, I felt it was only right to replicate that legendary buy with a $10,000 purchase of $CRV at the same price of .18 today as well.
I do think the outcome (new highs) will be the same (except ideally it won’t take nearly as long) but then again if I didn’t believe it would be I wouldn’t be buying at these levels (and if you lack the conviction, or can’t afford to invest more, neither should you).
Every major $BTC cycle low has formed between the 200WMA and 300WMA:
•2015 → landed on the 300WMA
•2018 → landed on the 200WMA
•2020 COVID crash → on the 300WMA
•2022 → landed just under the 300WMA
Right now they sit at: 200WMA → $61,000 300WMA → $54,000
If history repeats, then the bottom is between these two numbers.
Accumulate, have patience & stay strong.
We are close.
Honestly, guys.
Bitcoin is up 700% in the last three years, and you're doubting whether we can call the current period what it is: a bear market?
Why are you so obsessed with the business cycle, 4-year cycle, power law or whatever.
"No it's not a bear market because my model says otherwise"
Look at the chart.
It's simple.
Look at the structure.
Higher lows, higher highs, above the bull ema, full of bull flags = bull market.
Lower lows, lower highs, below the ema, full of bear flags = bear market.
I even painted the colors accordingly.
Why should an asset not be able to enter a distribution and bear phase after such an impressive and long bull market?
The good news is: The bottom is near. And there is a bit of chop ahead. And then we will see the same green bars again for the next couple of years.
When our major alt season happened in 2017 it was after BTC peaked, dropped 50% from the highs, found a floor, and then BOUNCED for it's first major relief rally that we finally saw alts go ballistic (total altcoin marketcap tripled off the lows and made new ATH from this point).
As $BTC approaches 60k, some 50% below prior ATH, many are noticing the relative strength in alts at these levels as BTC melts but many alts hold relatively "steady", sending BTC dominance down in the first significant pullback on BTC dom that we have had in nearly 8 months.
I think once $BTC finds a floor here we may finally see a significant correction on BTC dominance as alts outperform to the upside- just as we saw after the last cycle top in 2017.
The only major difference between the current situation and the one in 2017 was in the former all this took place post blow off top and in the latter we are still missing one (leaving the door open for a "temporary" resurgence in BTC dominance if this were to materialize down the road).
In any case, the predominant narrative from a few months ago of an "endlessly rising Bitcoin dominance as alts go to zero" is slowly starting to show some cracks...
$CRV tags $.185, $Link tags $7.50, $BTC to tag weekly 200MA area $58K-$62K and then the market rallies as the Clarity Act gets a vote, passes, and stock market begins it's brutal correction and historic transition of wealth onto the new blockchain rails. June is the switch flip month IMO.
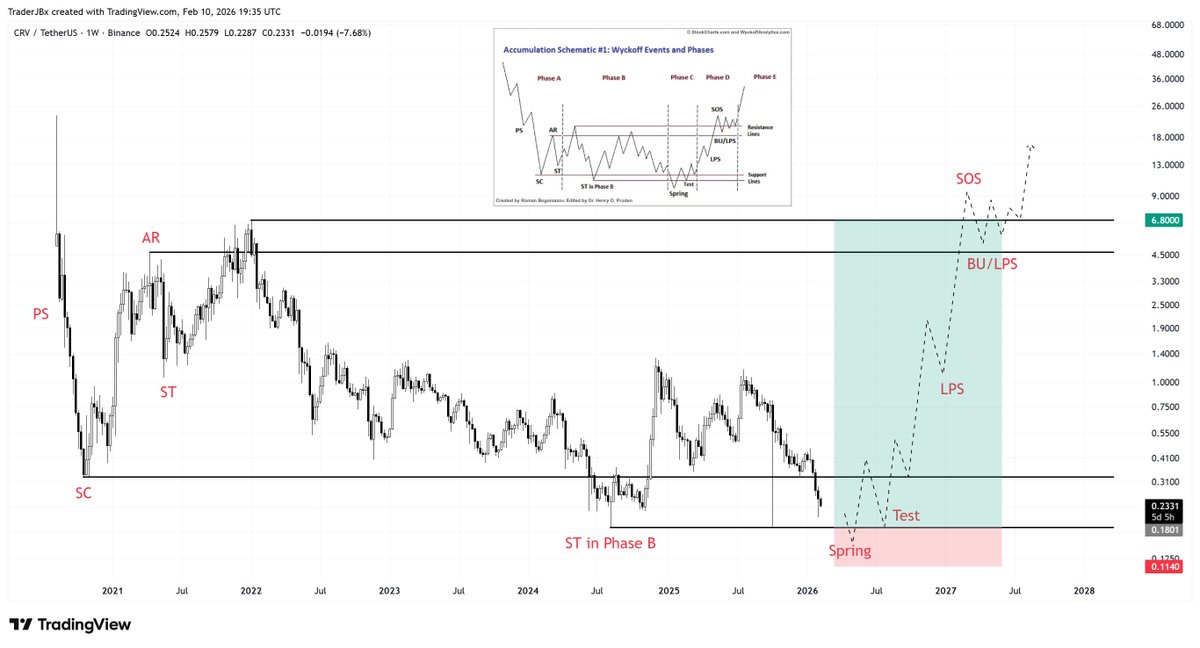
$CRV / $BTC
When you zoom out and look at the bigger picture, you can see that coins like CRV - still down around 98% from their 2021 highs - have already broken their major downtrend and are now in the retest phase 👀
Once this retest is complete, #CRV could be positioned for a massive move higher.
A 10–15x rally from these levels is not out of the question if the #altcoin market enters a strong expansion phase 👽
#Altcoins
Altseason has already begun. It’s starting slowly you can already see it in a few coins, such as $NEAR, $INJ or $HYPE.
$BTC Dominance shows you the way.
2026 will be a big year for crypto.
$BTC.D
Like clockwork, we are still expecting one more major leg to the downside on the #Bitcoin Dominance. Based on this chart alone, we should be expecting a major altseason.
Keep it simple, no need to overcomplicate the markets.
Wave Trend Oscillator (WTO) will confirm a new HTF bull-trend with tomorrow's monthly close on $altcoins
Bullish cross will occur only for the 3rd time this low in history
Monumental
#Altcoins
TOTAL2 will follow stocks imo.
Crypto is often the last asset to experience a parabolic rise. Rotation is the key.
The secret is to be in before it starts.
I hope you're all as excited as I am?🫡
#CRV Market Cap
As you know one of the chosen old school projects we invested in is $CRV
I wanted to give you a perspective with its chart.
Look at where it is now and what potential you are buying. Going to it's ATH's of Market cap is 10x from here.
What I saw over the last years is that many old alts didn't do ATH's in their USD value but they did new Highs in Market Cap.
Why is that?
Projects that are from 2018-2019 were unlocking tokens over the years and their market cap didn't go as low as their USD value in % losses.
The USD value of CRV is 0.24 but its ATH is around 6.8$ that's like 30x from current levels, but 10x in Market Cap to ATH's
Why is that important?
Looking only in USD value is a mistake, because you don't know what's actually happening, but looking at the ath MC of the coin gives you a different perspective. Going above its ATH is a signal when you can start DCA Selling and take profits, this matches around 2.4-2.5$ per coin 👽
$CRV The tripple tap (aka Wyckoff Accumulation Model 2) is very likely playing out here. My bias are still kinda the same as this last tweet here. I'm looking for price to rotate back and reject the GP/ HTF OB from 0.27$ for some distribution PA to push price down once again.
The pivot time / very dangerous period is from the second half of June to July, which i expect a flash dump back down to range low (if the risk is high (black swant event), price can go for a bigger flush to the big Macro trendline of $CRV ( at $0.1$ (-50% down from here)) => Not my base case right now.
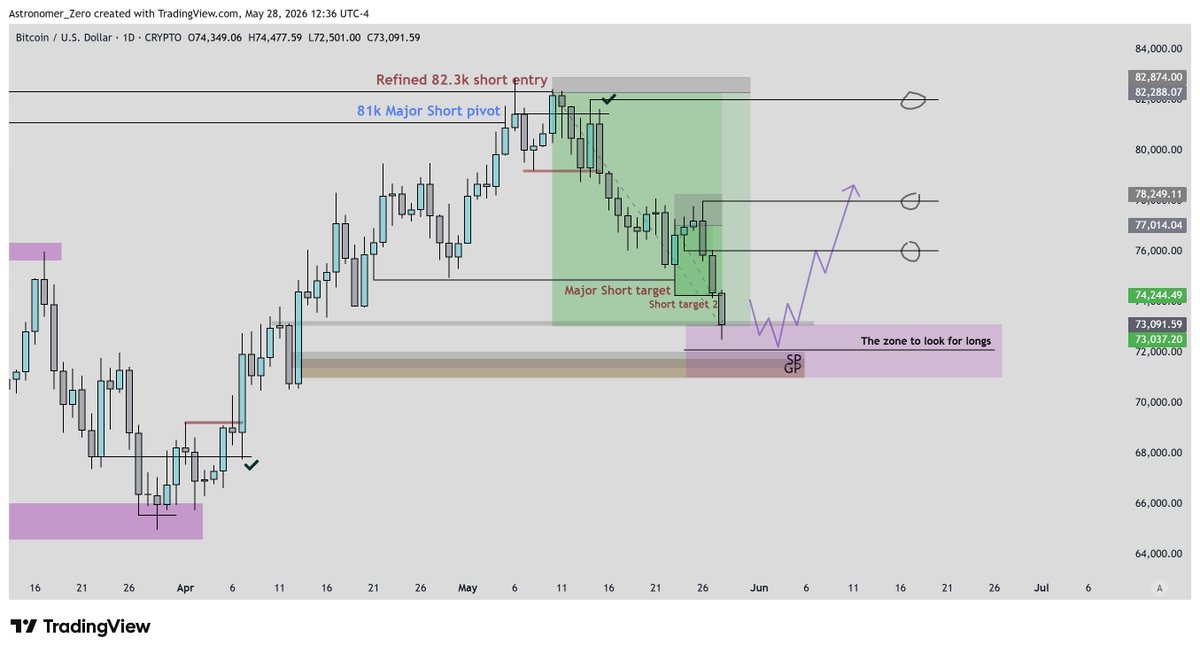
$btc
The next long, and the plan for our fifth win in a row
Now that I have reminded you of the high timeframe outlines, more specifically, my high timeframe outlines and ideas, and now that you have been reminded that a bearish stance has been right from 83k and down. But that a bearish stance is no longer correct imo i.e. is wrong here,
It's time to specify more and shift down one timeframe, the daily.
Usually some plan creation steps I skip, I just call the trade entry/exit, give my reasoning, and leave.
But with the last 4 trades being a perfect 4, for number 5 (at least start) make you think about how you will approach this very highly anticipated long we have been posting about very loudly and clearly.
Indeed, this time, I am not immediately giving you the spoon-fed exact moment I am long, at least, as of yet. I might in the future.
But I just want you to forget one trade in dozens I call out every month, and try to learn the lifechanging skill, of execution, with the plan already given just for this one.
Because I have drawn the plan out right in front of you, on a silver platter with max clarity.
➡️My bias is bullish
➡️I am looking to long right here, right now
➡️I am giving you the exact zone to long
➡️I am giving you the exact targets I am looking at (keep in mind, estimates for now, I want liquidity pools to appear but this is where I expect them to form, but regardless, good baseline steps)
So I am giving you everything needed to make money. The only thing I have not given you, is the moment of when to press the button.
This plan, is fully functional, fully operational and can be created with simply my framework, my core edge and what I shared over the years. Invaluable to make money.
And, in reality, this plan is clearly detailed enough to simply long here already in theory: enter here, stoploss below the zone, targets shown.
And with a humble word of own NFA, if you just found out about me, therefore potentially have no long runners from below, have 0 long exposure, it wouldn't even be that bad. So let's use it as a baseline framework and take the trade that way.
But, for the trader looking for setups every week, we all know that pressing buttons is harder, draining, if not the hardest thing, let alone holding through it. That is why no one dares to show it (it exposes everyone immediately of how many of them probably can't trade profitably consistently).
Now a good plan and bias is mandatory because it's one you can be confident in, which already helps execution a lot.
But when executing like this, it still feels slightly in the direction of relying on good faith partly speaking, especially when you are a little nervous that day, fragile or with things on your mind for whatever reason.
And especially true with hundreds of thousands on the line. But frankly any capital significant to the beholder (higher risk, higher gain trades) has this effect.
That is why my own live executions I have been sharing on X, aren't just simply: "enter here SL there, target here".
They are refined institutional positioning strategies, dynamical SL selection and liquidity pool targeting with monitoring there after. To give the view behind the scenes. A little bit of extra effort, getting you a long way of more refined, comfortable trading, no matter the size. Exactly what institutions do.
It helps you position, take multiple entries properly. It helps you find accurate entries, and it even helps you find swing trade targets and follow through.
Today's order flow technology is strong. It is so strong that it can even help you trade and do it very well using nothing else. And many who can't use a classic systems rely on it on their own.
But the problem is that there is a lot of information overload. That's partly why refined execution is not mastered very widely nor is material available online.
Yet that is exactly the missing piece, of, after plan creation, executing this trade with less stress than just entering here, going to target, and with a defined SL and holding your breath for days on end.
Although, it still can be done. Why would you though. Some like it. I prefer refinement and surgical approach.
Don't let "just having this plan" in front of you stop you though. You know my record and accuracy, so you can use this plan as a strong baseline for the next trade idea I have in mind to (hopefully) secure the fifth W in a row.
But I would be bluffing if I said I won't try to refine execution while looking at this, so that L's still turn into BE's, and BE's still turn into W's, boosting your overall win rate and consistency in tricky bear phases, even more so in straightforward bull phases.
So let's see, no matter which way you choose to approach it, whether you turn this into a W or not, and how much stumbling happened along the way.
This test will be invaluable feedback for your own skill. Maybe you are closer than you think.


![GertvanLagen's tweet photo. $BTC [1M] ::::: Elliottwave of Blowoff ⑤ started in 2022
(1) ::::: First Impulse
(2) ::::: First Correction
(3) ::::: Extended Third Wave ::: 1-2-3-4-5
(4) ::::: Expanded Flat ::: A-B-C
(5) ::::: Blow-off Impulse ::: at subwave 2 'Shake-out'
Inv ::: Drop below (4).](https://pbs.twimg.com/media/HJ_qRJRWMAAJDgA.jpg)
![GertvanLagen's tweet photo. $BTC [1W] ::::: Clearly supports the Expande Flat setup, with (4) being the spring (high volume bottom).
Now Retest. https://t.co/m6KSdkQJFW](https://pbs.twimg.com/media/HJ_tzT2X0AAlmtC.jpg)