Like every other bull market I’ve participated in over my 43 years of trading, this one is no different. Its persistence has conditioned the majority to believe that every decline is temporary and every setback should simply be bought.
And, as always, the clowns of the circus cycle have been lulled into believing that certain areas are somehow impervious to serious decline—that certain stocks have been awarded such a high level of quality that they are exempt from the basic rules of risk management.
Eventually, undisciplined and amateur investors learn these lessons the hard way. And when they refuse to respect risk, there’s nothing anyone can do to save them from themselves.
But what do I know?😎
Por si estás un poco perdido, esto es lo que ha pasado en el mundo y los mercados en los últimos 10 días:
1- Un pasajero del United 2174 dice que lleva una bomba e intenta entrar en la cabina. No había bomba
2- Microsoft 365 se cae más de un día en medio mundo. Outlook, Teams, Copilot…
3- Dimite Jensen Huang como CEO de Nvidia. La acción llega a caer un 13% en la apertura, ya sabes porqué
4- Oleada de avisos de bomba falsos en Madrid
5- Explota una mochila en Oviedo y muere un policía. La policía lo investiga como un crimen entre vecinos, no como terrorismo...
6- La FAA para casi todos los despegues en Estados Unidos durante casi cinco horas. La parada más larga desde el 11-S. Dicen que fue un fallo técnico, no un ataque
7- Actividad sospechosa de drones sobre RAF Lakenheath, una base gringa en Inglaterra
8- Irán lanza drones, tres veces en cinco días, contra bases en Baréin con presencia de EE.UU. Los interceptan
9- Atacan al menos dos petroleros cerca del estrecho de Ormuz
10- Chase sufre un fallo técnico: Retrasos en transferencias y en pagos por Zelle
11- Fallo interno en United: los pilotos se quedan sin el peso final del avión y se retrasan despegues
12- La red interna clasificada de la NSA sufre una caída. La agencia dice que fue por un mantenimiento y que no hay indicios de ciberataque
13- El IPC de octubre en EE.UU. sale en 0,4% cuando esperaban 0,3%
14- El mercado da casi por hecha una subida de tipos de la Fed en diciembre
15- El bono a 10 años supera el 5,1%
16- El dólar, en máximos desde abril de 2025
17- EE.UU. cierra el hueco que dejaba a empresas chinas usar chips de IA en remoto, vía centros de datos en el sudeste asiático y Brasil
18- Bitcoin encadena su sexta semana de caídas, con cerca de 2.000 millones liquidados en cripto en un solo fin de semana
19- El oro -4,5% en una semana, su peor semana desde junio
20- El VIX de 19,3 a 22,9 y el Nasdaq -2,7% en un solo día
Si no tienes sistemas para navegar los mercados, no sé cómo estás sobreviviendo a esto...
Siempre será un buen momento para construirlos.
Vendrán tiempos… Interesantes.
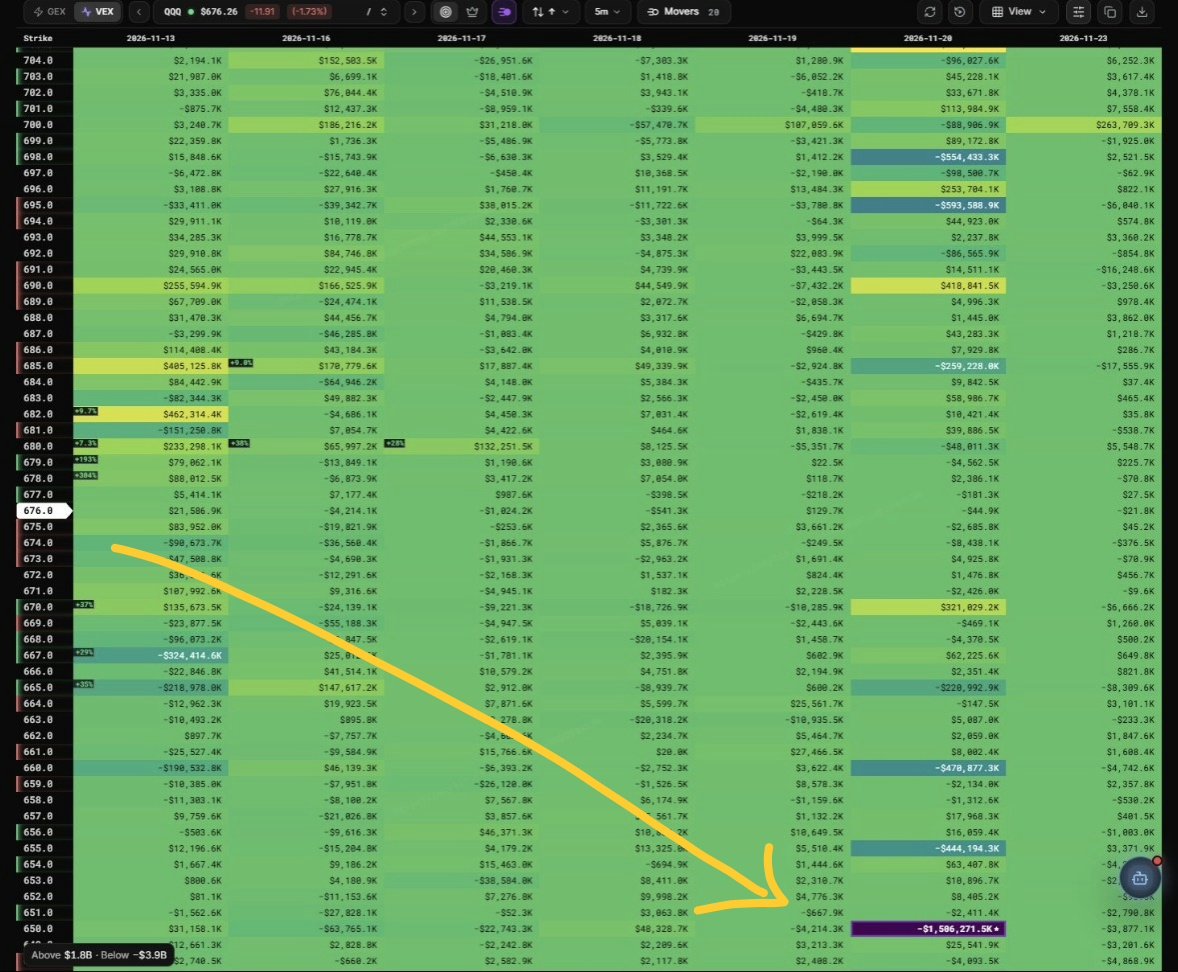
$QQQ gamma map is set up for downside and it's not even close
Quick explainer for anyone who hasn't seen one of these. This is a GEX heatmap. It basically shows where dealers are stuck hedging at each strike.
Green/yellow = positive gamma. Dealers buy dips, sell rips there. Price gets pinned, moves slow down.
Dark/purple = negative gamma. Dealers have to sell as price falls. No cushion. Moves get fast and ugly.
Now look at the actual numbers on this map
Below price: -$3.9B
Above price: +$1.8B
That's the whole story. More than 2x the pressure below us than above us.
Above, 685-690 is stacked green. That's why every single bounce this week got sold right there. It's a wall.
Below is where it gets interesting. The nodes just keep getting darker the lower you go. 682, 667, 659, 655... and then there's the 650 strike for Nov 20 expiry sitting at like -$1.6B. That one node is massive.
If 660 goes and 647 (November low) breaks, dealers hedging that book aren't catching the knife, they're selling into it. 650 becomes a magnet. And 650 is basically the doorway to the 620-630 January shelf I've been talking about all week.
Honest part though, because I don't want anyone treating this like gospel
This map redraws every day. Nodes change as positions open and close. This is Friday's map. Monday's could look different. It backs up the levels, it doesn't replace them. Close above 685 and I'm redrawing everything.
And there's two headlines this week that can blow this whole setup up
1. The "Stand with Jensen" petition. 43K+ signatures, thousands of actual Nvidia employees, Musk signed it, big shareholders are literally writing the board telling them to keep his return on the table. Jensen comes back = NVDA squeeze = QQQ drop scenario probably gets delayed.
2. NVDA earnings Tuesday. Clean beat, good guidance, this gets delayed again. Simple as that.
So yeah. Trap confirmed Friday, path is 660 → 647 → 650 node → 620s. But I'm not marrying it. Two binary headlines this week can flip it in a day.
Day by day. Levels first.