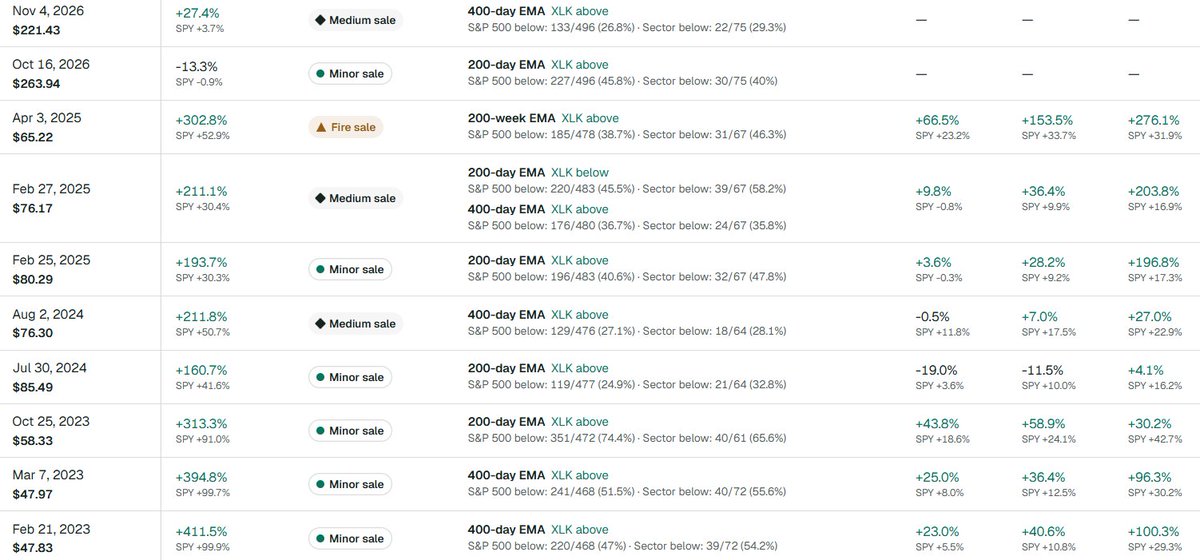
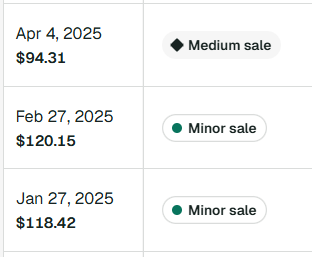
I track pullbacks in leading stocks. Follow to see how shares and call options fared after similar drops and how the S&P 500 did over the same stretch.
A stock I’ve wanted for months finally hits my price. Then I see the red chart and hesitate.
I built Anchor & Almanac for that moment. It flags sell-offs in leading stocks and shows how shares and calls performed after similar drops.
Join the waitlist: https://t.co/30srsMM5Vf
$META closed back below its 400-day EMA on Nov 12. I looked up three similar pullbacks this year. Meta beat $SPY over the next three months only once. After the March dip, Meta fell 4.3% while SPY gained 12.5%.
If Meta’s on your watchlist, what would you want to see before buying?
@hungrybeefs@EchoAnalysis The results from similar setups in the past speak for themselves. Now imagine the returns on call options...
The tool I'm about to release will alert you to these setups.
@EddieBrazi29474@Mr_Derivatives Only if you bought the very top in Q4 of 2024. The tool I'm building wouldn't have bought the top. I personally bought more in April 2025.
Remember, when a high-quality company trades below its 200- or 400-day EMA because the whole market or sector is, the discount is more likely temporary and sentiment-driven. I built Anchor & Almanac to alert you to these setups.
Join the waitlist: https://t.co/30srsMLy5H
@MarkWayneLucas@TheLongInvest@grok I'm building something that surfaces these setups so people don’t have to monitor constantly. It'll come with alerts and show what returns looked like if you bought shares or a long-dated call option during similar setups.
It's extremely hard to find the exact bottom. Oftentimes, it's better to have a long-term outlook and avoid the short-term noise or being glued to the markets. I'm building something that surfaces these setups so people don’t have to monitor constantly. It'll come with alerts and show what returns looked like if you bought shares or a long-dated call option.
It's extremely hard to find the exact bottom. Oftentimes, it's better to have a long-term outlook and avoid the short-term noise or being glued to the markets. I'm building something that surfaces these setups so people don’t have to monitor constantly. It'll come with alerts and show what returns looked like if you bought shares or a long-dated call option.
It's extremely hard to find the exact bottom. Oftentimes, it's better to have a long-term outlook and avoid the short-term noise or being glued to the markets. I'm building something that surfaces these setups so people don’t have to monitor constantly. It'll come with alerts and show what returns looked like if you bought shares or a long-dated call option.
@ThiccTeddy Most people still freeze when they see this much red. I'm building something that sends alerts for these setups on high-quality stocks. It also shows historical share/call returns after similar setups.
Exactly!! The last 5 times $NVDA sold off and fell below the 400d EMA, it was higher a year later every time. The largest gain was 190%, and the smallest gain was 32%. And that's just a year late. I'm building something that surfaces these setups so people don’t have to monitor constantly.
If you're holding long-term, it doesn't really matter. The last 5 times $NVDA sold off and fell below the 400d EMA, it was higher a year later every time. The largest gain was 190%, and the smallest gain was 32%. And that's just a year late. I'm building something that surfaces these setups so people don’t have to monitor constantly.
Could be here or around the 200-week EMA. Nobody knows but I'd ignore the noise and avoid the stress. The last 5 times $NVDA sold off and fell below the 400d EMA, it was higher a year later every time. The largest gain was 190%, and the smallest gain was 32%. And that's just a year late. I'm building something that surfaces these setups so people don’t have to monitor constantly.
Exactly, the thesis didn't change. It's just noise. The last 5 times $NVDA sold off and fell below the 400d EMA, it was higher a year later every time. The largest gain was 190%, and the smallest gain was 32%. And that's just a year late. I'm building something that surfaces these setups so people don’t have to monitor constantly.
@PulleyGreg80@TheLongInvest I'm building something that surfaces these setups so people don’t have to monitor constantly. It'll come with alerts and show what returns looked like if you bought shares or a long-dated call option.
@ScottMountford6@TheLongInvest You can't but I'm building something that surfaces these setups so people don’t have to monitor constantly. It'll come with alerts and show what returns looked like if you bought shares or a long-dated call option.
@_masterinvestor I’m watching whether more tech stocks join the rally. At the Nov 11 close, $XLK was above its 200-day EMA, but 35 of 76 S&P 500 tech stocks were below theirs, including $NVDA. I’m building Anchor & Almanac to see how shares and call options did after similar pullbacks.
@DMBBTC@APompliano The last 5 times $NVDA sold off and fell below the 400d EMA, it was higher a year later every time. The largest gain was 190%, and the smallest gain was 32%. And that's just a year late. I'm building something that surfaces these setups so people don’t have to monitor constantly.
@jad14219655@APompliano The last 5 times $NVDA sold off and fell below the 400d EMA, it was higher a year later every time. The largest gain was 190%, and the smallest gain was 32%. And that's just a year late. I'm building something that surfaces these setups so people don’t have to monitor constantly.