Check out our latest publication: https://t.co/DsWbkUPQhD
We developed a novel open-top light-sheet microscope. This project was a great collaboration between the lab of @priscaliberali and @ViventisMicro . I am really thankful I could be part of this beautiful work!
Search-in-the-Chain ⛓️🔎
This paper by Shicheng Xu et al. is a cool new way to interleave retrieval and planning for advanced question-answering, beyond naive RAG. Retrieval is used to verify whether or not a given step is correct, and can trigger replans if not. And now it’s available in @llama_index 🦙🔥
The steps are the following:
1️⃣ LLM plans a global reasoning chain of question-answer pairs
2️⃣ Use retrieval to verify and/or complete knowledge in each reasoning step
3️⃣ Dynamically replan new chains given incorrect verifications.
It’s a cool paper that demonstrates nice results on its own, but the idea can also be applied to any agent reasoning loop with tool use - use retrieval as a signal to verify and replan the agent execution.
Thanks to DJC-GO-SOLO (GitHub), this is now implemented in @llama_index as a LlamaPack template: https://t.co/KSinWkclhe
Notebook example: https://t.co/VbXo5i0cAT
Source paper: https://t.co/430FokwjgO
Excited to share our new preprint "Boundary geometry controls topological defect transitions that determine lumen nucleation in embryonic development"! https://t.co/CBQcGdxQac
Product of amazing interdisciplinary work with @takafumi_ichi, Takashi Hiiragi and @ErzbergerGroup ✨
@doomxbt@binance Brave has Lighthouse integrated to it, you can run Lighthouse which is supposed to measure the page performance but it can also reveal elements that take unusually high resource and much longer time than usual. It also identities elements may interfere with normal scripts.
Yes extension is likely one of the causes but it seems to be hidden (not sure though if that possible). Changing network password also seems to restore regular behaviour of the browser but I suspects if one have, for example, other devises which has the same Apple ID logging in, connect to the same network, the irregular behaviour comes back. Assuming, say, Apple ID might be compromised the password the network might be compromised as well.
Now that Binance officially says that they are they are not, in fact, involved in this, I can say that I have been experiencing these suspicious/irregular/unexpected interactions with both the web page and mobile app for this past month and still going. And IMHO only someone internally will have the capability to do it. Cookies being exploited, CSS styles being altered, Scripts being injected, Anonymity being de-anonymised, Fingerprinting information being aggressively collected and diverted, all cannot be prevented without completely unable to use the basic function of the web page. The page design is so (sorry for the lack of a better word) bad that even basic best practice in web security being ignored, making everyone vulnerable in so many ways. Oh and the app is no more secure. Please make this right… urgently. BTW, all the information/articles you have on the page about security blah blah completely miss the reality.
A systematic review of 130 observational studies underscores the danger of loneliness in older adults for adverse health outcomes
https://t.co/3ukCOAYj39 @LancetLongevity @EmielHoogendijk @ElsaDent@DLVetrano
One of my favourite letters, insightful & humane, from Richard Feynman to a former student who was having a rough time
I was reflecting on it as an argument in favour of scope insensitivity, or even in favour of smaller problems:
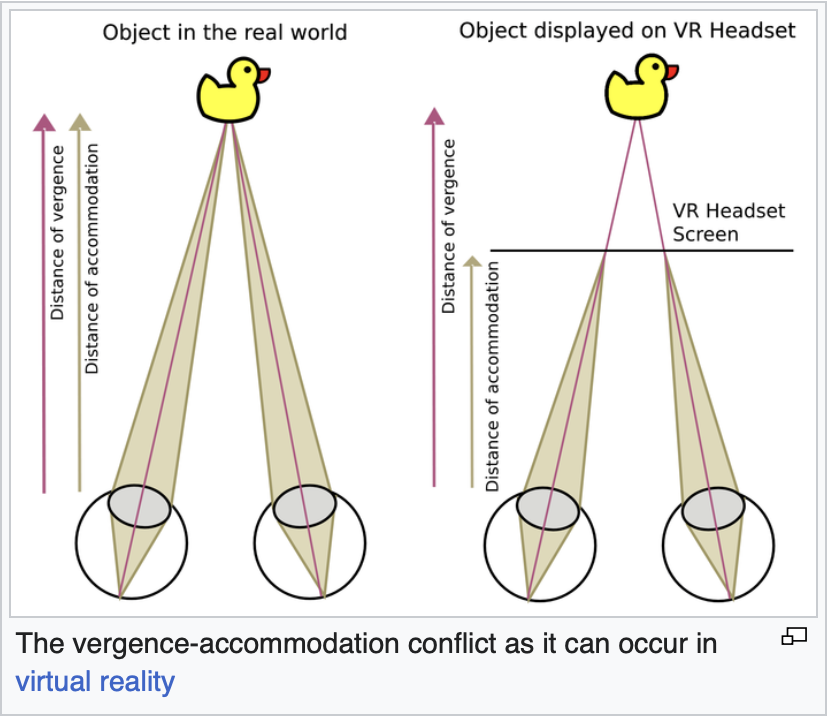
all current VR headsets have fixed focal points
until this changes, no headset will replace screens. too straining
magic leap was supposed to solve it with silicon photonics that redirect light rays to control focal points, but it never materialized
https://t.co/bQJkOmXJVE
The second paper from the Crosby Lab @SouthwesternU has been published! We sought to build a low-cost bioprinter from an Ender-3 Pro @Creality3dP. Outstanding work by the all-undergraduate team from SU. The paper can be accessed here for free: https://t.co/bRGPoCGFAp
I've noticed that a lot of people have a hard time understanding the effects of rescaling on group differences and the interpretations of groups' scores.
Lots of people also use rescaling to mislead people.
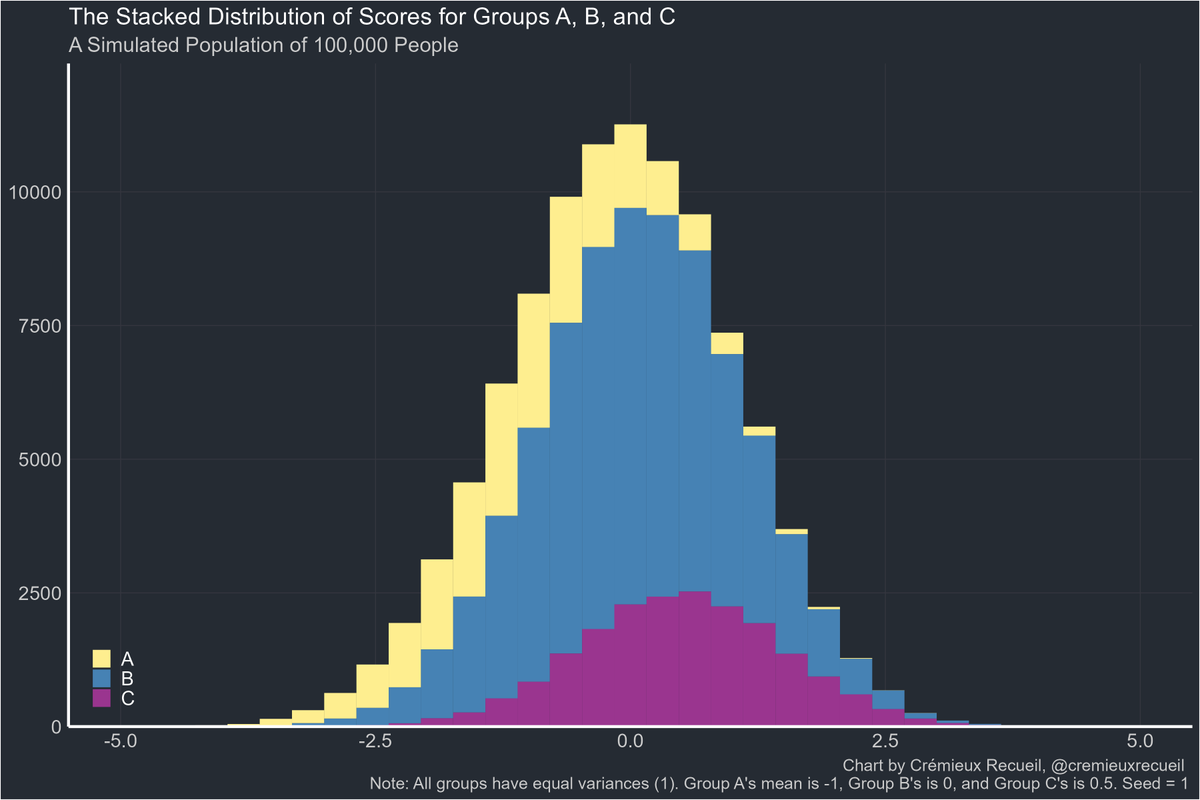
So imagine we have three groups in a population of 100,000 people: 20% of them belong to A (mean = -1), 60% to B (mean = 0), and 20% to C (mean = 0.5). Each group has a standard deviation of 1.
Their scores look like this:
The groups each had their various means, and their differences end up coming out to 1.01 d for A-B and 1.51 d for A-C. The simulated values were almost exactly what we wanted.
The overall group's combined mean/standard deviation is not 0/1, it's -0.099/1.114. The reason the mean is negative is that Group A is further below 0 than Group C is above it, dragging the whole group mean down. The reason the standard deviation is larger than each group's 1 is because they're separated along the mean continuum, so the range of values is greater than if B alone constituted the whole population.
Now let's imagine we set the whole group's mean to 0 and its standard deviation to 1.
As a result, the mean for A becomes -0.814, the mean for B becomes 0.092, and the mean for C becomes 0.537. Everyone moved up! In fact, the gap in absolute terms between A and B declined from 1 point to 0.906 points. In other words, almost 10% of the gap had disappeared.
But not really, because we're dealing with rescaled units, and the standard deviations for each group decreased because the total group is more variable than each individual group within it, so each group's variability in the new terms must be scaled down to accommodate the reduction in the total group variance. The new standard deviations for each group are 0.897, 0.899, and 0.891. The A-B and A-C gaps are 1.01 d and 1.51 d.
Nothing actually changed, the scale was just arbitrarily shifted.
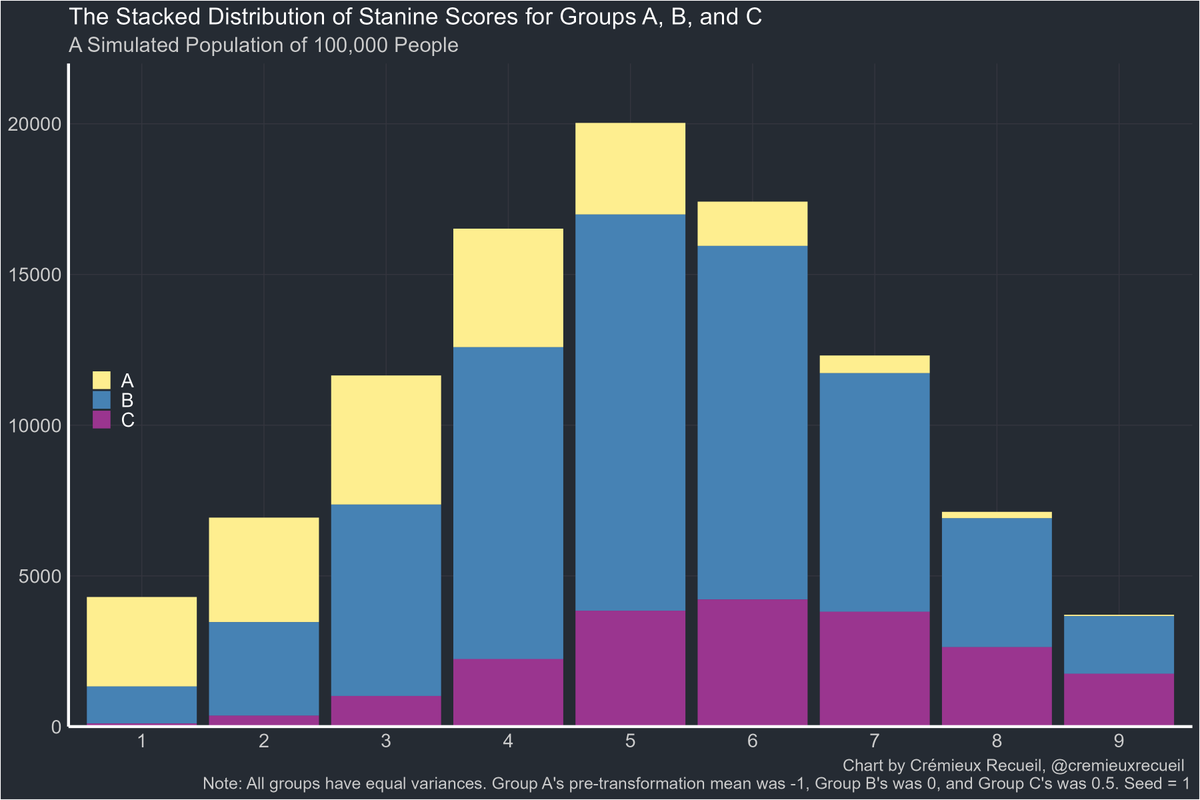
One popular distribution preferred by many psychometricians is the Stanine, or STAndard NINE distribution, where the whole-population has a mean of 5 with a standard deviation of 2 and people can only earn a discretely-numbered score from 1-9. This distribution helps to stop people from overinterpreting small mean differences that can't realistically be distinguished, like comparing an IQ of 85 to an IQ of 88.
When we transform our initial data to a stanine scale, here's what we get:
The resulting means/standard deviations are 3.434/1.690 for A, 5.180/1.797 for B, and 6.049/1.740 for C. The A-B gap is 1 d and the A-C gap is 1.52 d. Nothing really changed despite the massive change in scale.
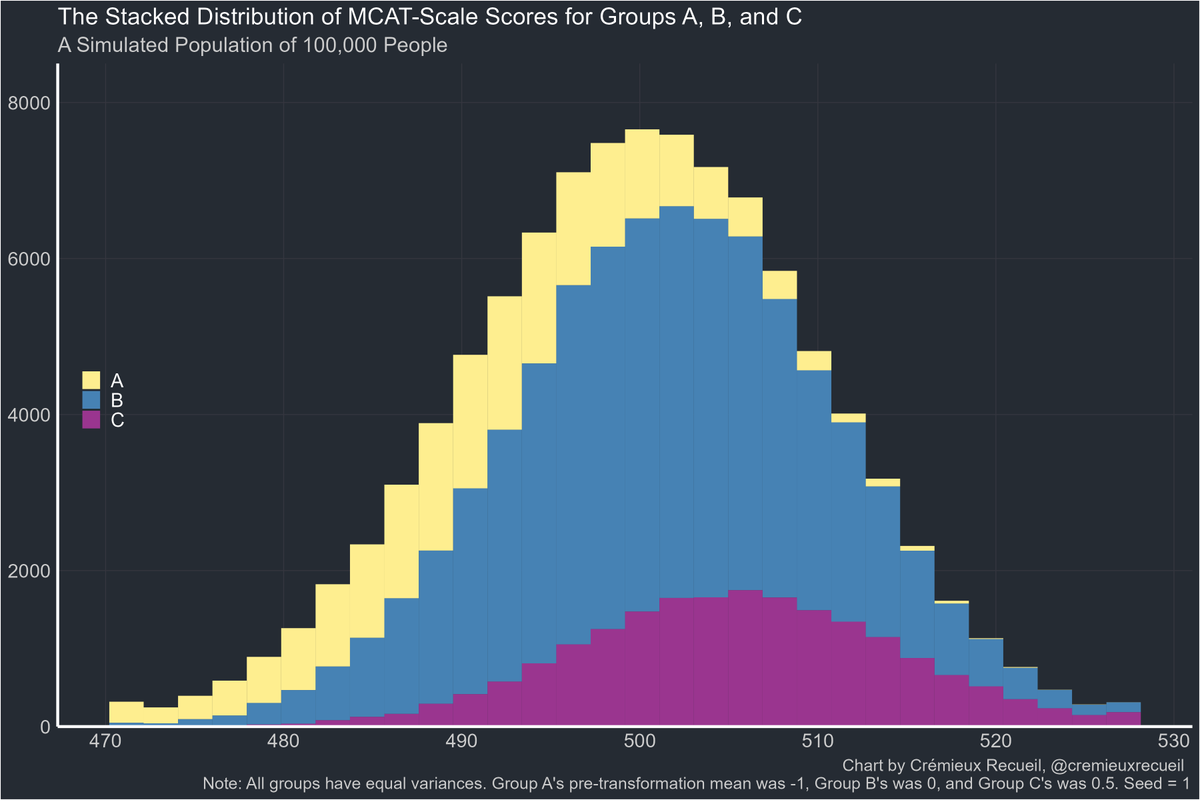
A while back, the Association of American Medical Colleges (AAMC) changed the scaling on the Medical College Admissions Test (MCAT) from its traditional 3-45-point scale to a 472-528-point scale. The idea was to hide group differences by making the numbers so large that gaps appeared small. So let's rescale our initial numbers onto the MCAT's new scale and see how well that works.
With an overall mean/standard deviation of 500/10 and a range of 472-528, we get this:
The mean/standard deviation for A becomes 491.903/8.875, 500.919/8.975 for B, and 505.357/8.867 for C. The A-B and A-C gaps are 1.01 d and 1.52 d. Again, nothing really changed.
Now for a trickier example.
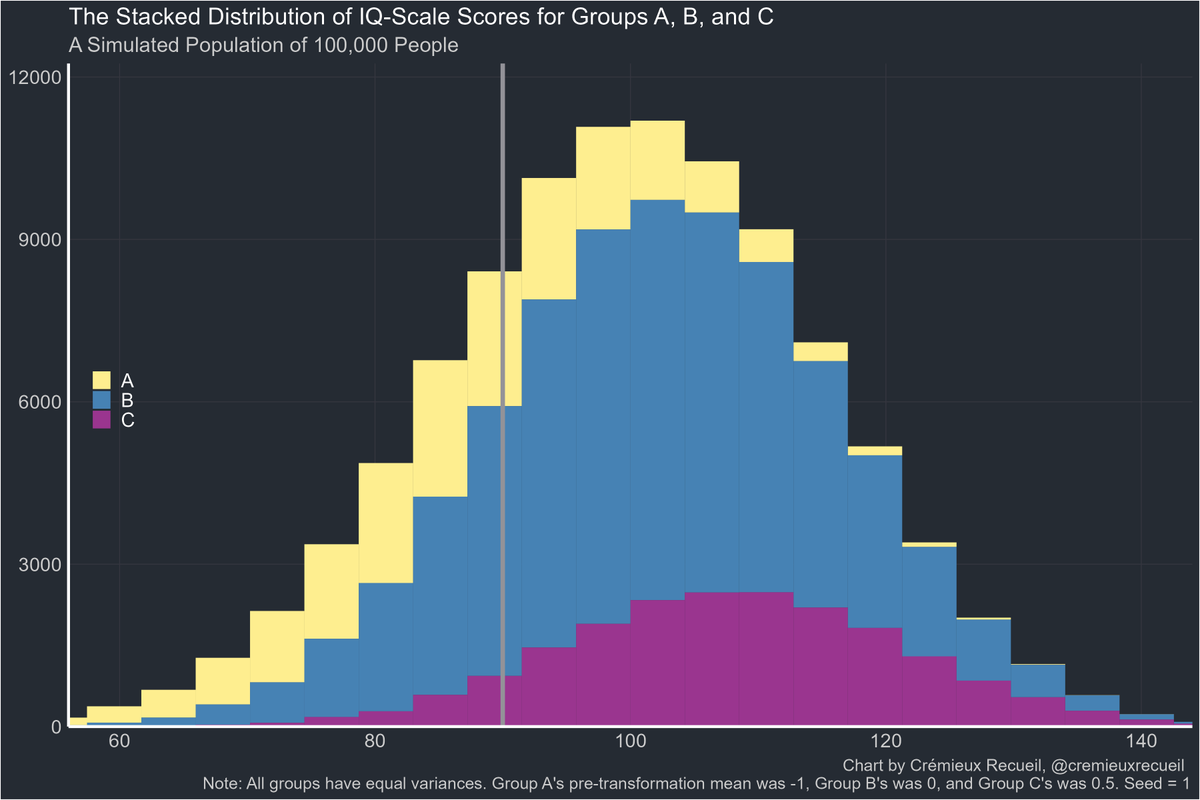
In this case, we're going to try really hard to disguise the group differences, so we're going to only report "pass rates". This will be the percentage scoring above 90 on an IQ test, where the whole population has a mean of 100 and a standard deviation of 15.
Our distribution looks like this, with a threshold at the solid gray line:
But pretend we don't know how the distribution looks. We only know that 43.35% of A passed the threshold, 80.11% of B did, and 91.38% of C did.
Because we know there's normality in the scores, the groups have the same variances, and we have a large sample, we can be confident, then, in comparing the Z-scores of the groups to obtain A-B and A-C gaps of 1.01 and 1.53 standard deviations in size.
If we try to get everyone in A to pass by setting the threshold to 75, we see that 82.85% of A, 97.45% of B, and 99.29% of C end up passing. That's huge gap closure, you may think. The resulting A-B and A-C gaps are 1 d and 1.50 d. Once again, nothing really changed. Pass rates just vary nonlinearly with the underlying performance gaps, so the picture can be arbitrarily misleading.*
At no point in all of this did we ever lose sight of the reality that the gaps in standardized terms were unchanged. The problem occurs when these gaps are understood in new terms that we imagine are distinct from our old ones but which, in reality, are not.
Here's a brief overview:
Rescaling from our initial sample's values led to a "reduction" in the A-B, B-C, and A-C gaps. However, that was all a matter of scale and the gaps were as large as ever, they were just portrayed in new terms.
If we know what a stanine is and we forget that each group's variance is less than the stanine's total variance, we might get the impression that the gap was reduced when a stanine was used. However, that too was all a matter of scale.
If we try to follow the wisdom of the AAMC and we adopt a nonsense scale, that too doesn't change anything despite the numbers appearing very large and thus the gaps appearing very small.
Finally, the switch to using pass rates showed we could appear to close gaps while they remained unchanged when we looked at them in common terms.
People strategically exploit misunderstandings about scaling to minimize the extent of achievement gaps or to argue progress has been made when it actually hasn't. If someone offers you "gap closure," respond by asking about "scale."
* More on pass rates and group differences here: https://t.co/eYpras9NsE
Recent research found that river sediment accretion will be insufficient to match sea level rise in most U.S. tidal wetlands.
Learn more on #WorldWetlandsDay ⬇️
📄: https://t.co/02ibmLaKKA
#SciencePerspective: https://t.co/sgoWE1ecik