If you are a Bitcoin bull (I’m not) you want to see Bitcoin pump above last top (blue line) then red line (confirmation) and the dip to stay above blue line top, then next one above red line top. Thus forming higher highs, lows. Until then, there is no proof of bullish momentum💚
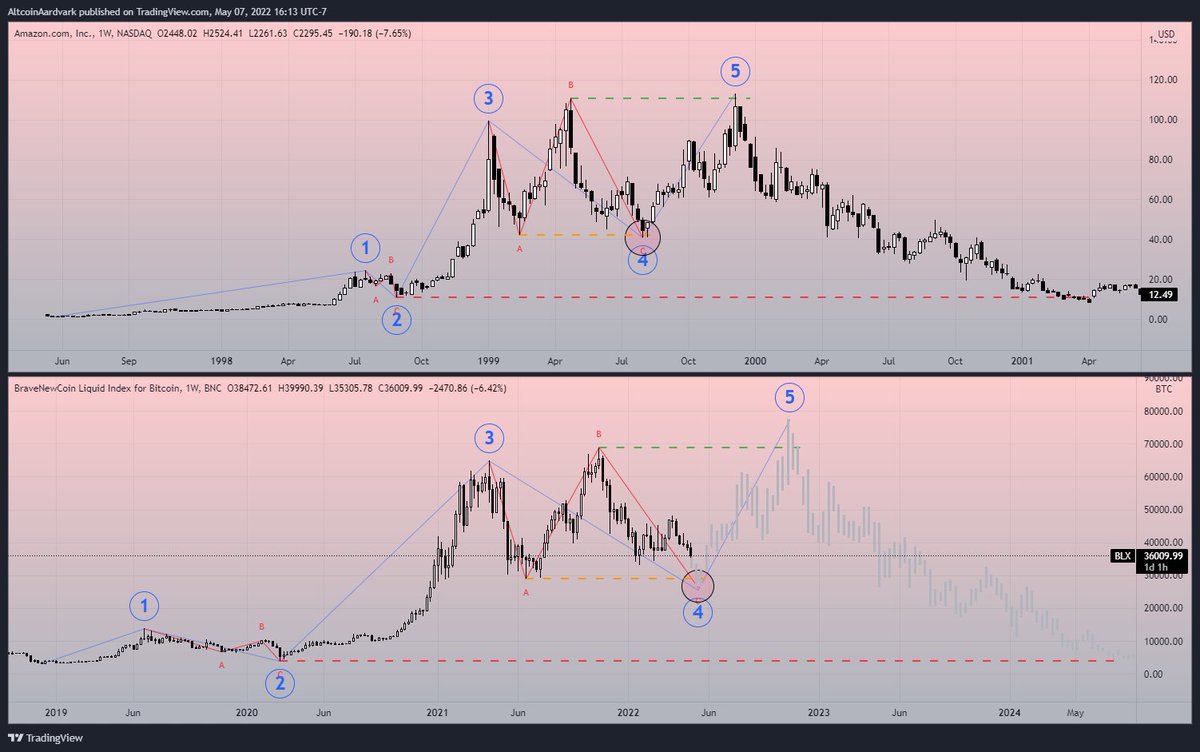
$BTC | The infamous $BTC vs $AMZN fractal
I keep seeing this chart used to argue for more downside from here. The problem is, they are discounting the fact that we are missing the fifth wave in $BTC.
(1/5)
The most accurate floor model I have seen. No guarantees, but it has marked our bottom every time we have tapped it. Like the name, I see this as "confluence" and do not base my entire bullish thesis on it, but it certainly supports the idea that we have found our bottom. $BTC
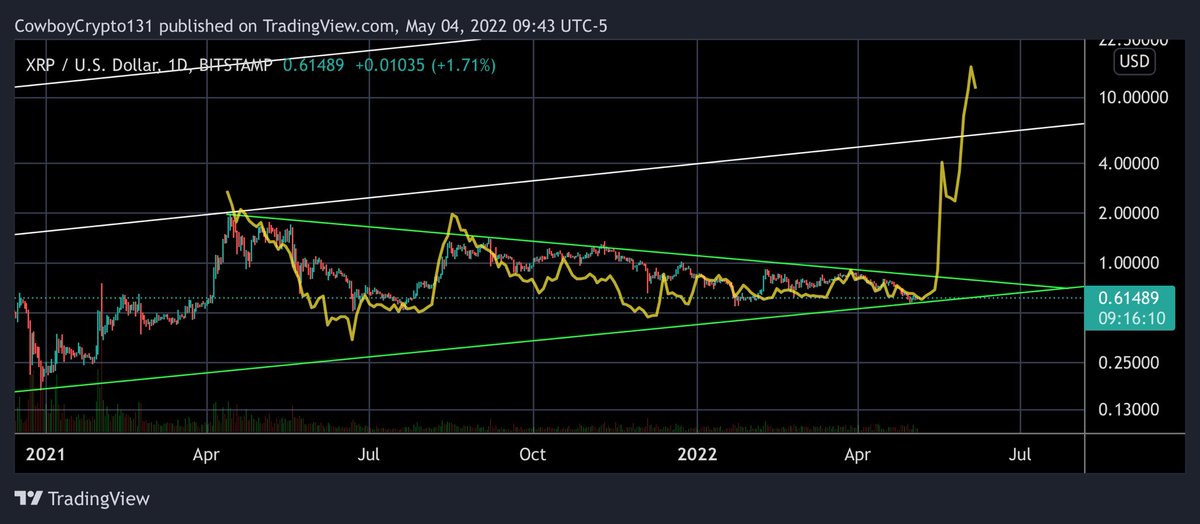
#XRP
The struggle has been real !!!
We are so close to the reversal, Yet most people are selling. I don't see the $0.20- $0.10 that everyone is calling for.
That's what I call fud baby! Which means !!!
WE ARE GOING TO THE MOON!!!🌛🌝🚀🚀🚀🚀
Up +20% since buying the #altcoins lows of this latest rally. GL + HF missing out on another "fake pump rally" like your completely useless analysts would say. Next rally this ship will leave with or without you, but dw your permabears will "flip bias" at 50K #bitcoin
#BTC cointraderpro chart does not have the same low as Coinbase & we already hit the 25.4K i mentioned in my prev tweet. I am already about 60% long & I am about to up that to 75%, keeping 25% for a mini dip lower. The LUNA crash dip fits the expanding triangle target for a low.
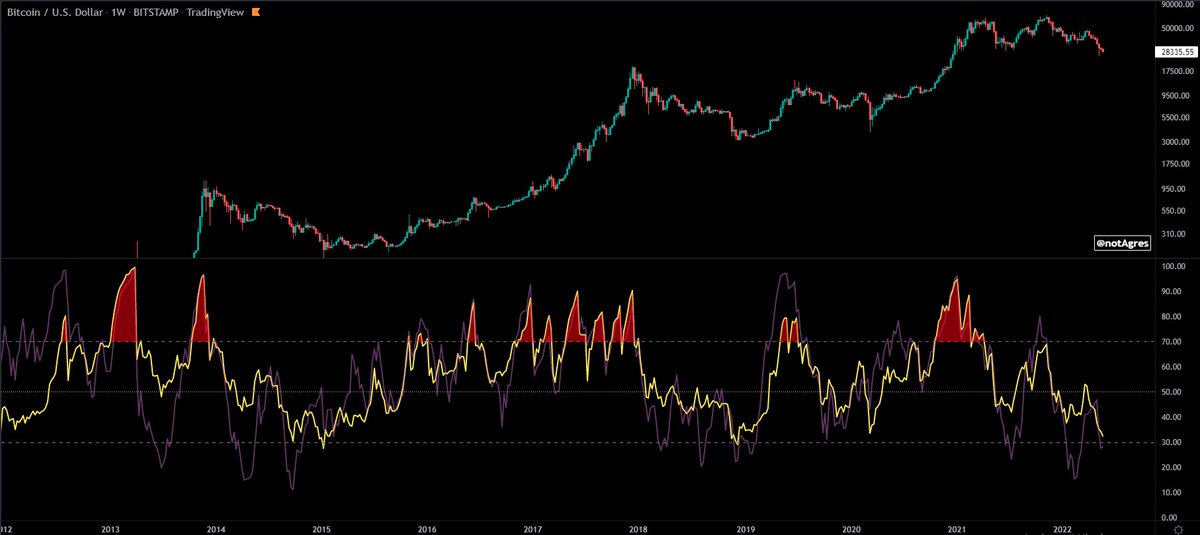
#Bitcoin is 2 points away on the RSI from reaching the rock bottom readings of 2015 + 2018 bear markts. Its now below the C19 dump which means hidden bullish divergence is playing out. Your blowhard bears will have you think we're going straight to zero. Watch them backtrack soon
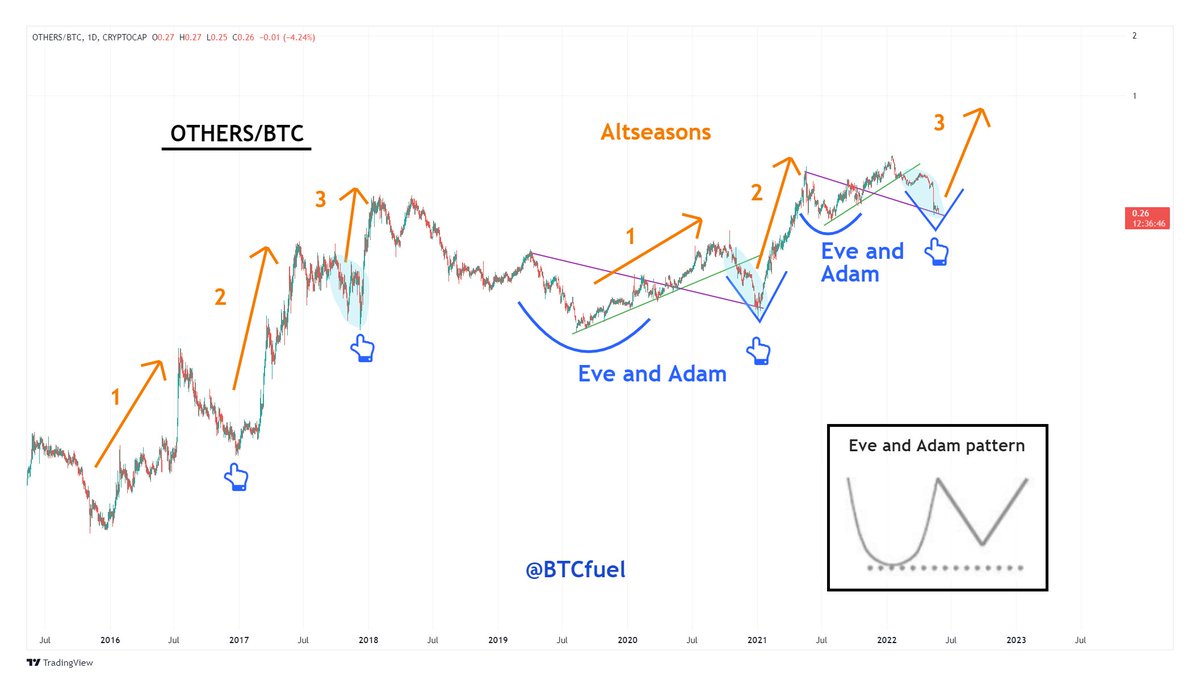
The OTHERS/BTC is the most important chart that nobody is watching. It's the representation of the average #Altcoin / #Bitcoin pair. Every #Altseason gets preceded by a big drop in ALTBTC value
By the looks of it an another Eve and Adam pattern is setting up 🧐
Do you remember the sentiment in '08 when the housing bubble popped? Do you remember the stock market crash of '08 and the subsequent recovery? Range highs taken, range lows taken, deviations, expanded flat, whatever you want to call it- we have seen it before. $BTC
#BTC RSI reaching March 2020 levels represents a best case scenario for a $BTC bottom being very close
However, RSI levels dipped much lower in 2015 & 2018 to reach a Bear Market bottom
Should RSI levels go lower, black Higher Low could be a point of reversal
#Crypto#Bitcoin
🧵 This may be the most important threat that I ever make. Big picture stuff.
I’ll try to help you understand why the future is not what we’re hoping for. A major global collapse is coming. It may be worse than we can imagine.
Our leaders know.
But what are they planning?
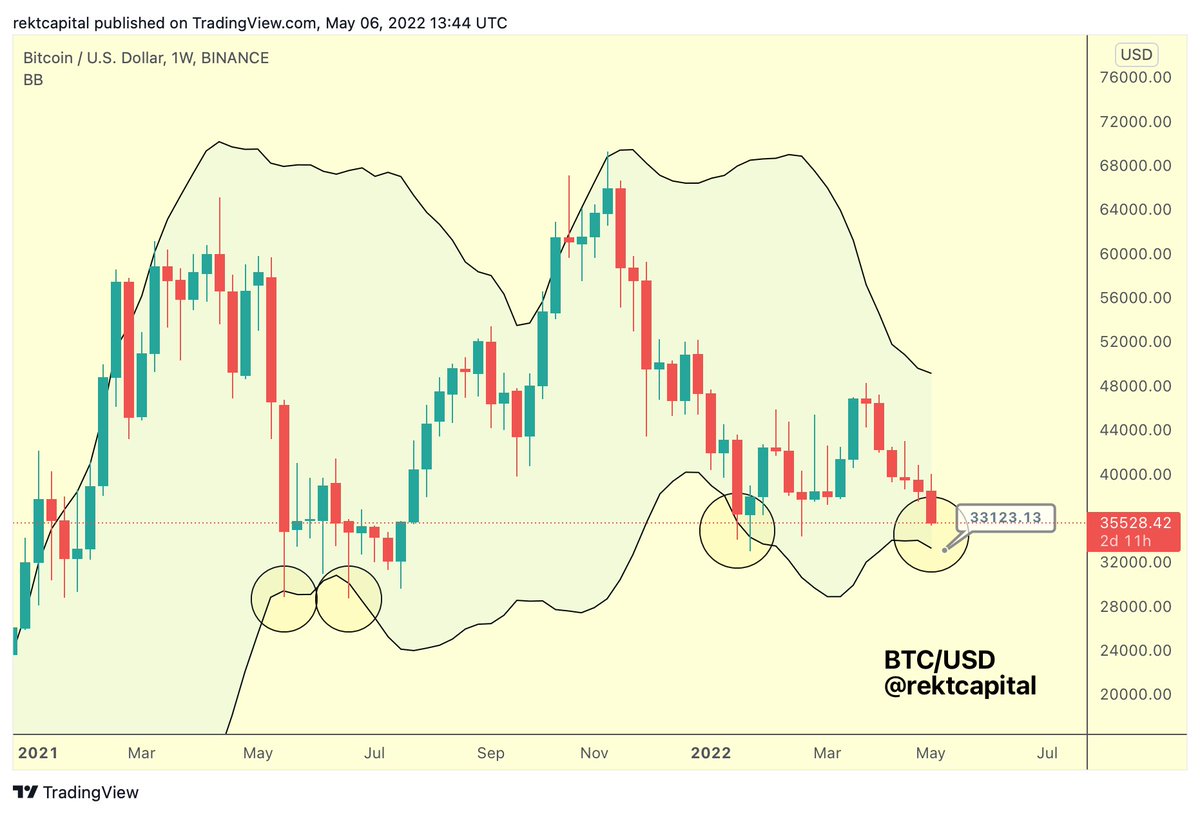
The last time #BTC rebounded from the lower Weekly Bollinger Bands, price rallied over +36%
$BTC is now close to revisiting the lower Bollinger Band once again
#Crypto#Bitcoin
⚠️⚠️ #Altcoin top structure ⚠️⚠️
Before the Altcoin market top in 2018, this is how the market looked like in 2017 before the top. The similarities with 2022 are remarkable. 70% of the bottoming is already done 👌
#Altseason takeoff is so close 🔥🔥
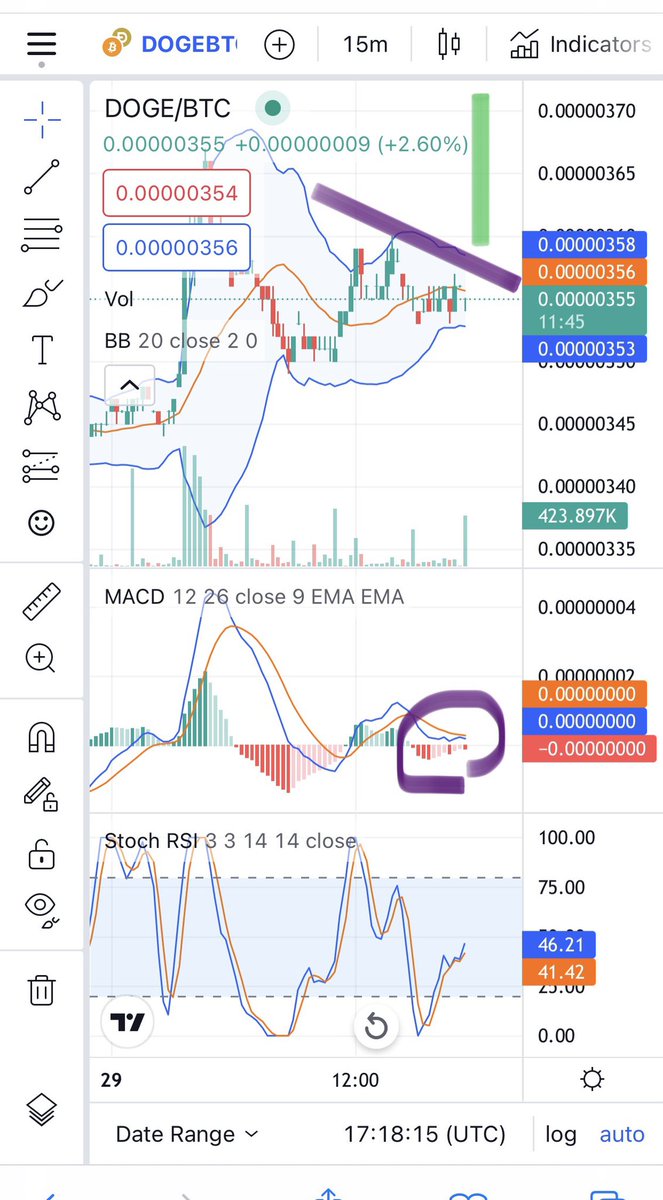
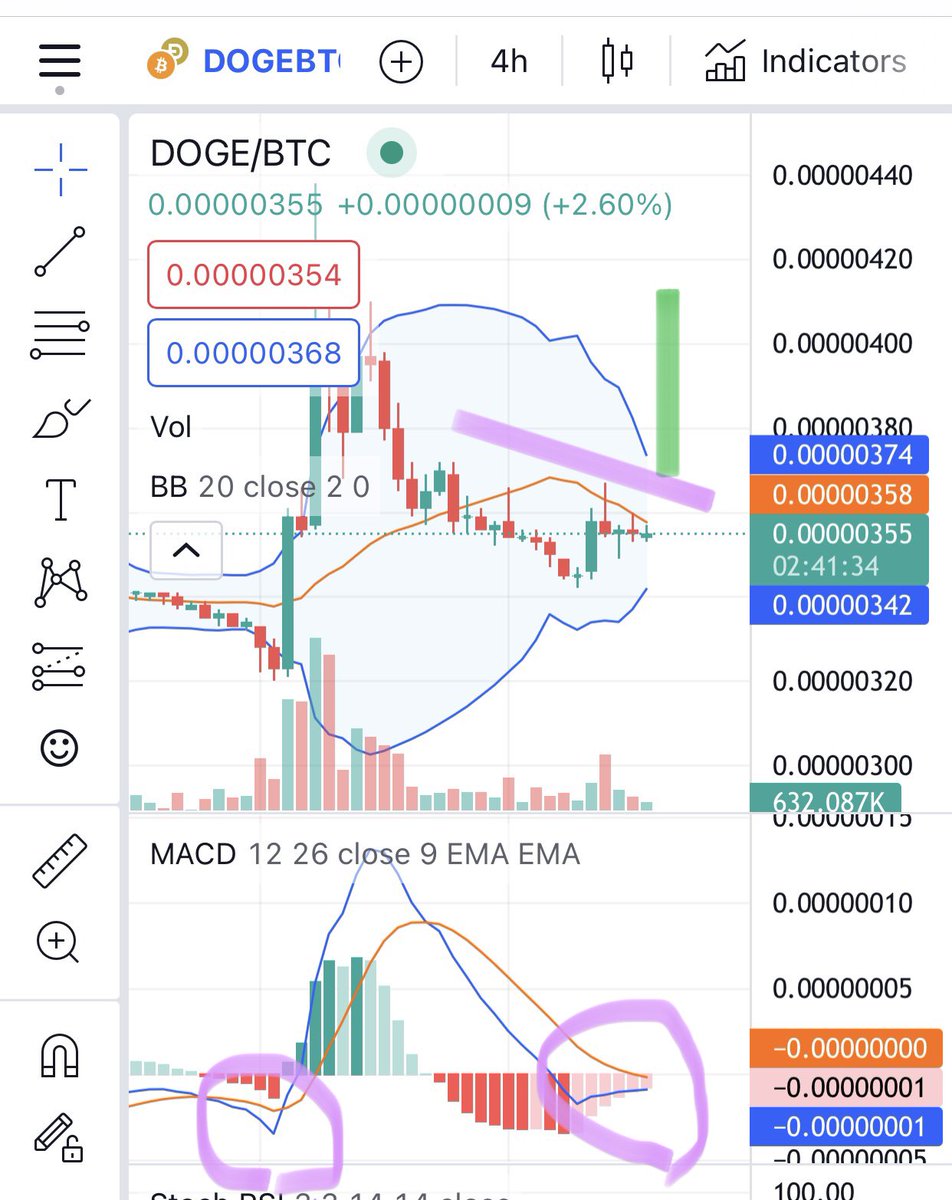
$doge /#btc looks beautiful.
15 minute is close to a pump .
4 hr MACD is close to cross bullish.
Soon big green candle coming .
🚨time to convert #btc to $doge because it will pump hard against #btc.
See below 15 minute and 4 hr charts.