@KolayAnaliz Bunları tek başımıza öğrenebileceğimiz bir kaynak verir misiniz? Marketler arası analiz olarak geçiyor sanırım.. Sizden beklemeden kendimizin öğrenebileceği kaynaklar var mı?
$USO / $UNG – Oil vs. Natural Gas ratio
Head & shoulders top on the daily chart. Neckline broken and ratio keeps moving lower >natural gas outperforming oil.
@KolayAnaliz Bu analizinize bakarak, söz konusu dönemde sizin tamamen BIST dışı borsalara yatırım yapmış olduğunuzu veya olmuş olmanız gerektiğini söyleyebilir miyiz? Değilse, neden?😊 Teşekkürler
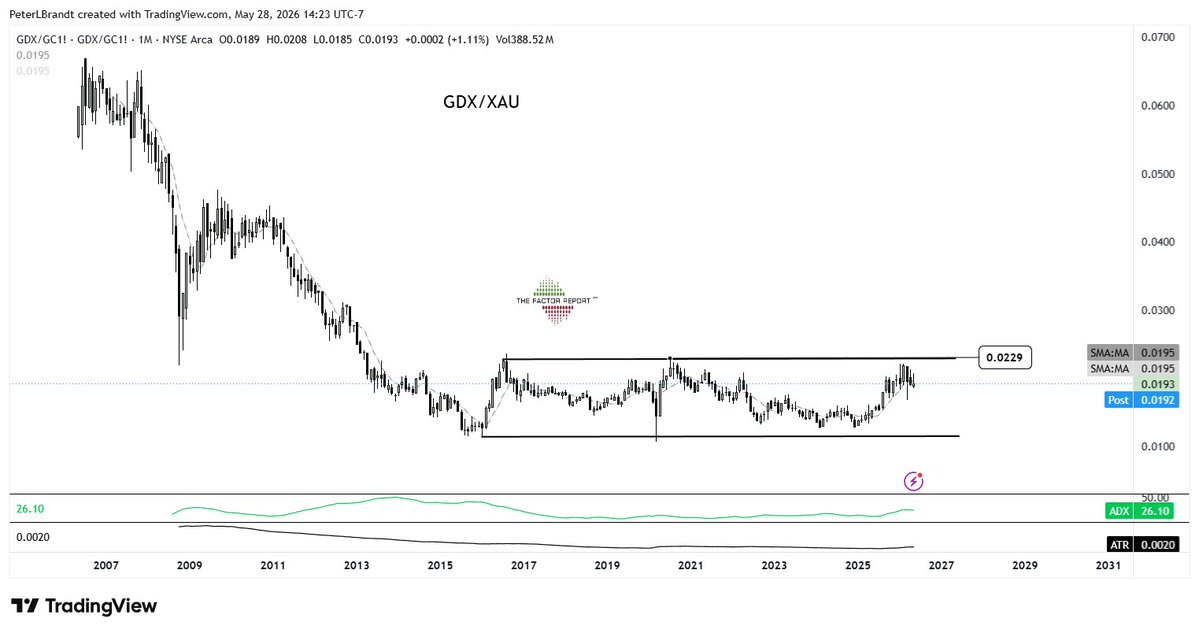
Is your interest Gold miners?
Well, this is the chart for you and will be discussed in this week's Factor Report™️Update
This is $GDX denominated by $GC_F
If this ratio ever closes above .025 the big play will be miners
Until then focus on bullion
@borsaninizinden 2- Yani göğsüm demire yaklaşacak şekilde kendimi yukarı çekmek değilde, ensem demire yaklaşacak şekilde kendimi yukarı çekmek.. Fizyoterapiste sordum, yapabilirsin dedi.. Yıllardır yapıyorum..
@borsaninizinden 1-Bende düzleşme var.. 2012 den beri.. Yolda yürürken boynum tutuluyordu.. hele birde hafif esinti varsa.. En çok faydayı barfiks de gördüm.. Ancak kafam önde, barfiks demiri arkada kalacak şekilde..
ÖNEMLİ İÇERİK.
Takip ettiğiniz hareketli ortalamayı sabitleyerek istediğiniz zaman diliminde gezinmeyi öğrenin.
Özellikle day traderlar/scalperlar mutlaka izlesin.
Basit ama etkili.
Belki bilmeyen vardır diye, buyrun:
@TechCharts Bu tarz "sadece haftalık grafikleri trade etme" yaklaşımı, az sayıda fırsat, başarısız kırılımlar, sermayenin sadece belli bir yüzdesini riske etme derken, uzun vadede getiri eğrisi açısından negatif olmuyor mu? Neyi gözden kaçırıyorum?!
@TechCharts Kırılımın geldiği ilk gününün kapanışından sonraki günlerde, haftalık kapanış gerçekleşene kadar her gün, fiyatın artı mı eksi mi kapattığına bakmadan alım mı yaptınız? Yoksa sadece artı kapatan günlerde mi aldınız? Bir gün de alınamayacak kadar fazladır diye düşünerek..
TRAILING STOPS & THE CURRENT GOLD 'BLOW-OFF'
4/
Formula for 'Roy's Ratchet Stop' (for long entries only)
This is code written in Metastock's programming language but its easy to follow & you could adapt it into an Excel spreadsheet if you wanted to.
(So would you bother with a Ratchet stop?
I have no idea why you would bother. I like it, I'm used to it & that's why i employ it
A simple fast MA works just as well & only has 2 parameters - K.I.S.S. guys
Anyway, here is the code f.w.i.w.
*********************************************-
{Ratchet Stop - for individual long entries selected by date}
{user parameters}
Y:= Input("Buy Date, MMDDYY
",010100,123150,091903);
D:= Input("ATR Periods",3,99,20);
M:= Input("ATR Multiplier",0.1,20,3);
Ri:=Input("Ratchet % Increment", 0,50,5)/100;
Re:=Input("Bars to Inhibit Ratchet",0,99,5);
Pr:=Input("Suspend Trail From, 1=Lo 2=Cl 3=Hi 4=Mean",1,4,1);
Mn:=Int(Y/10000);
Dy:=Int((.1+Y)/100-Mn*100);
Y:=Int(.1+Frac(Y/100)*100);
Y:=If(Y>33,1900,2000)+Y;
N:=Cum(Year()>Y OR (Year()=Y AND (Month()>Mn
OR
(Month()=Mn AND DayOfMonth()>=Dy))))=1;
Np:=CLOSE; {buy price}
A:=ATR(D);
Pr:=If(Pr=1,L,If(Pr=2,C,If(Pr=3,H,MP())));
Is:=Np-ValueWhen(2,1,5*ATR(D));{initial stop}
{latch variable}
Tr:=If(PREV<=0,N, {set trade latch}
{latch reset conditions follow}
If( {initial stop exit}
L<=ValueWhen(1,PREV=0,Is)
OR {trailing stop exit}
L<=HighestSince(1,PREV=0,Ref(Pr-M*A,-1))+
HighestSince(1,PREV=0,Ri*Ref(A,-1)*
Max(0,BarsSince(PREV=0)-Re)),
{then} -1 {reset}, {else} +1 {keep set}));
I:=Cum(Tr>-2)=1; {init variable}
Tr:=Tr+I; {add I to Tr}
Q:=I+(ValueWhen(2,1,Tr)<=0);{common expression}
{initial stop price}
Is:=Abs(Tr)*ValueWhen(1,I+Alert(Tr=0,2)*Tr,Is);
{stop price within Tr latch variable}
T1:=(HighestSince(1,Q,ValueWhen(2,1,Pr-M*A))+
HighestSince(1,Q,Ri*ValueWhen(2,1,A)*
Max(0,BarsSince(Q)-Re)))*(Tr<>0);
{trade exit signal and trailing stop price}
StopTrade:=Tr<0;
ValueWhen(1,Cum(N)=1 AND Tr<>0,Max(Is,T1));
***************************************************
Thx for reading this thread 🙏
Here are some good parameters to trail the latest rally on #SILVER
This indicator is open source and free
https://t.co/j1hHKHvU2u
See what parameter works best for you. This updated version allows you to select short/long trade setups.
Experiment it on previous price action and see what kind of a volatility you will be comfortable with.
It is ok to look at indicators. Make sure those indicators are least dependent on price. What is derived from price will be lagging.
I.e. volume and volatility indicators give additional input.
Open each chart with the same template. If there is a pattern it will pop out in the first few seconds of review. If there is no, don't analyze further. Move to the next chart.
How I start analyzing charts for better visibility and chart pattern identification?
1) Daily scale with 1 year of data loaded and no indicators
2) Weekly scale with 5 years of data loaded and no indicators
Load 1 year of data on daily scale (+/- 250 candles)
Load 5 years of data on weekly scale (+/- 250 candles)
That way the pattern you see on a price chart will be the same length (in candles) but on different time frames.
This will make the visual exercise easier.
@kisa256_@samuraipips358 For example; You see clar red line chanel on daily time frame.. Where it starts and finish.. But how come with horizontal lines?? We don't see where they start and finish!
@kisa256_@samuraipips358 Chart's just with their itself time frame.. I mean you don't put just on H4 horizontal lines from the H1 because I don't sea exactly from where stars this line..