@grok@MasterCryptoHq Ok so does that also means, X shorted when people where buying inorder to fill it's large orders. And if X wants to takes the market in opposite direction then it has to make people on the other side of the trade
$GOOGL may have the best investing track record of all time:
Acquired Android in 2005 for $50M, now valued at ~$200B+ (operating system market share) - a ~4,000x return
Invested in Stripe Series B in 2012 (valued at ~$100M), now valued at ~$70B - a ~700x return
Acquired DeepMind in 2014 for ~$500M, now valued at ~$100B+ (estimated standalone valuation) - a ~200x return
Acquired YouTube in 2006 for $1.65B, now valued at ~$300B+ (estimated standalone valuation) - a ~180x return
Invested in CrowdStrike Series D in 2017 (valued at ~$1B), now valued at ~$130B - a ~130x return
Invested in Uber Series C in 2013 (valued at ~$3.5B), now valued at ~$168B - a ~48x return
Invested in AST SpaceMobile Strategic Round in 2024 (valued at ~$1B), now valued at ~$31B - a ~31x return
Invested in Slack Series D in 2014 (valued at ~$1.1B), acquired for $27.7B in 2021 - a ~25x return
Invested in SpaceX Private Round in 2015 (valued at ~$12B), now valued at ~$1.5T (reported IPO target) - a ~125x return
@zip_ck@eliz883 The problem with this kind of analysis is that the pattern only shows up when it's already done. You never know what truly is the bottom or the high. Where will the price go next and that too from which level to what level.
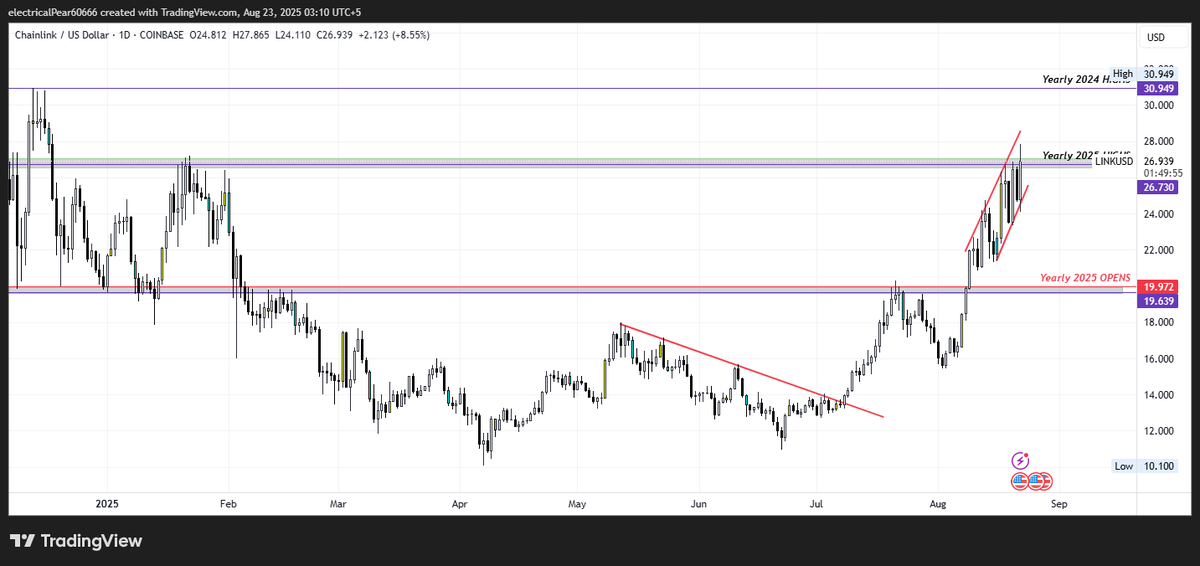
#Link
*Price Action*
-Link is currently retesting its 2025 highs
-Inside a rising wedge pattern
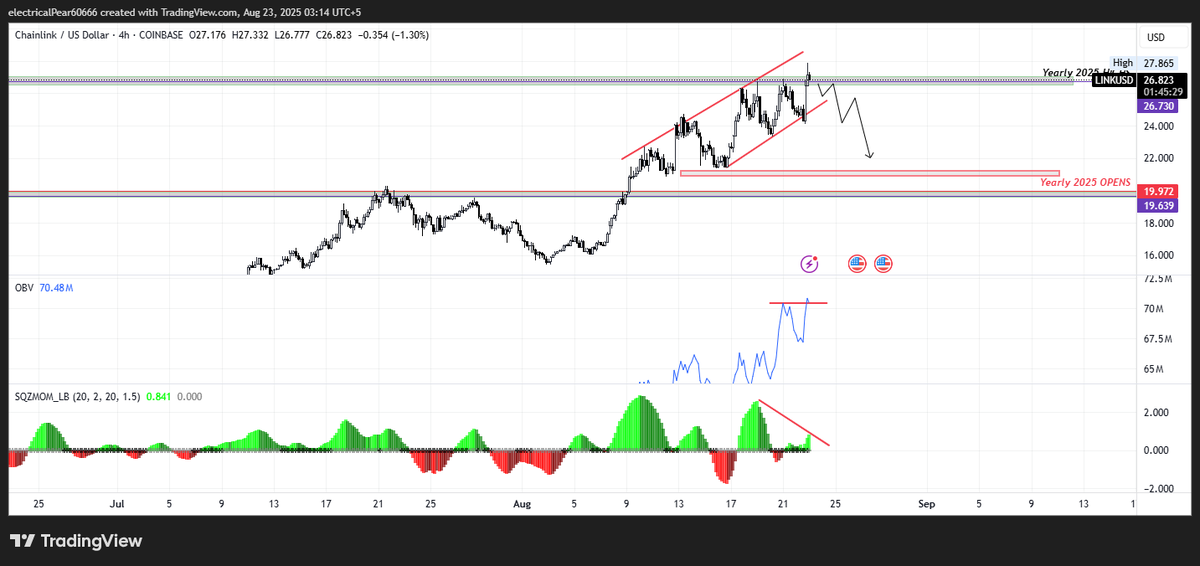
*Indicators*
-Multiple bearish divergences on multiple indicators
.RSI .Wavetrend .Squeeze momentum all indicate to exhaustion.
--Only concern is obv which is finding support on S/R
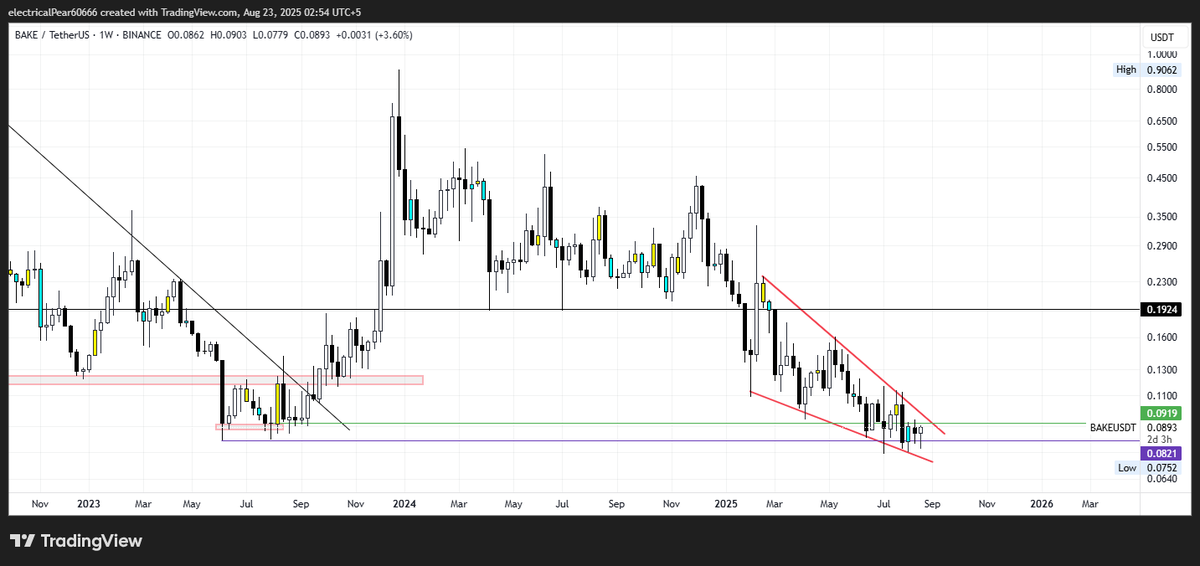
#BAKE
Price currently testing lows of summer'23.
*PA Wise*
- Liquidity swept under 0.82
- Falling wedge pattern in play
*Indicators*
-RSI forming hidden divergence
-Wavetrend forming hidden divergence
OBV also formed bullish divergence
Break and close above green line