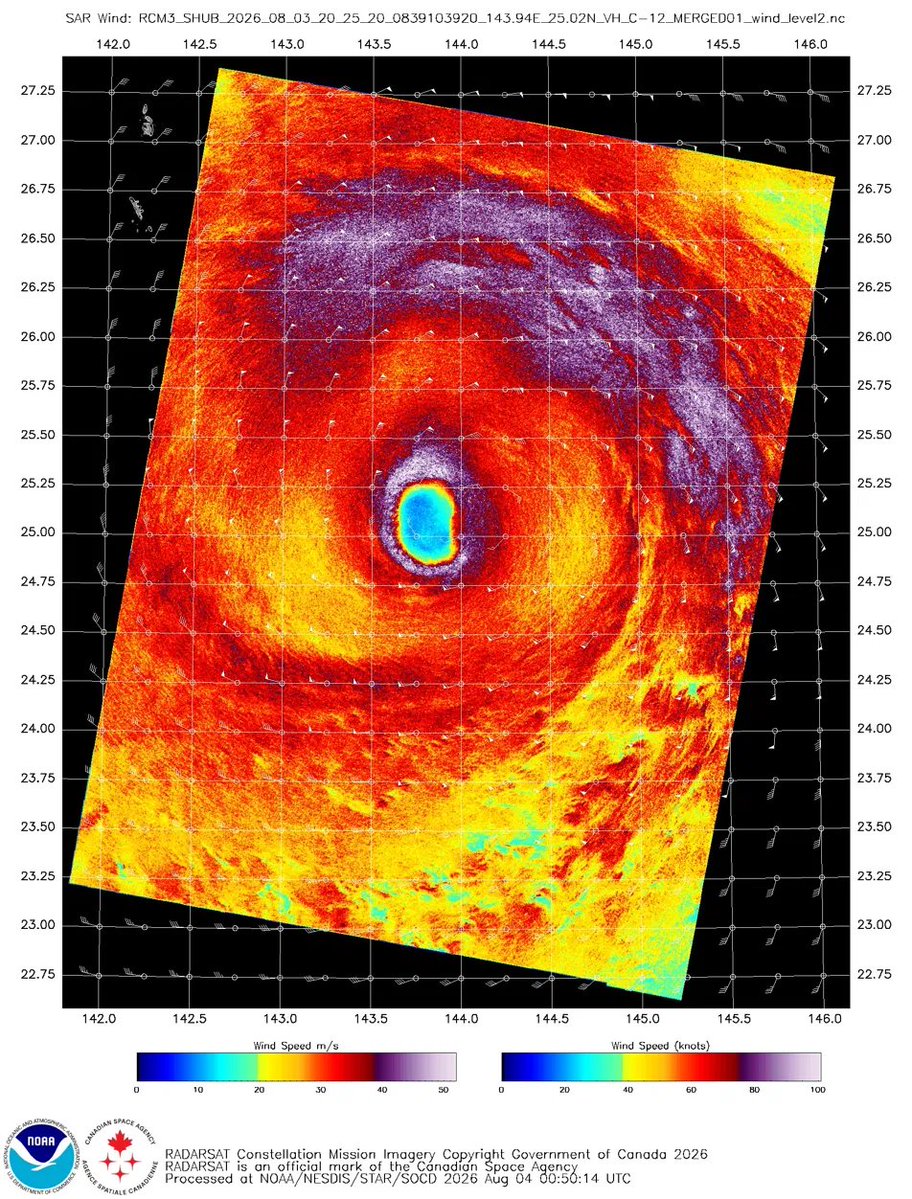
It's quite remarkable to see the recent recovery of Typhoon #Dolphin over the past day or so. Repeated ERCs have significantly broadened the storm's circulation, though it seems its most recent SEF attempt decayed into a large outer band instead, leaving the inner eyewall to survive suppression from the outer convective ring and re-consolidate.
Thank you so much @AriWeather and the wonderful @foxweather team for having me on tonight to discuss tropical storm #Bertha!
So grateful for another great segment, thank you for the opportunity!
Thank you so much to @AriWeather and the fabulous @foxweather team for having me on tonight! It’s always such an honor to discuss tropical weather with some of the best in the business 🤩
If you missed my segment, I’ve attached it below!
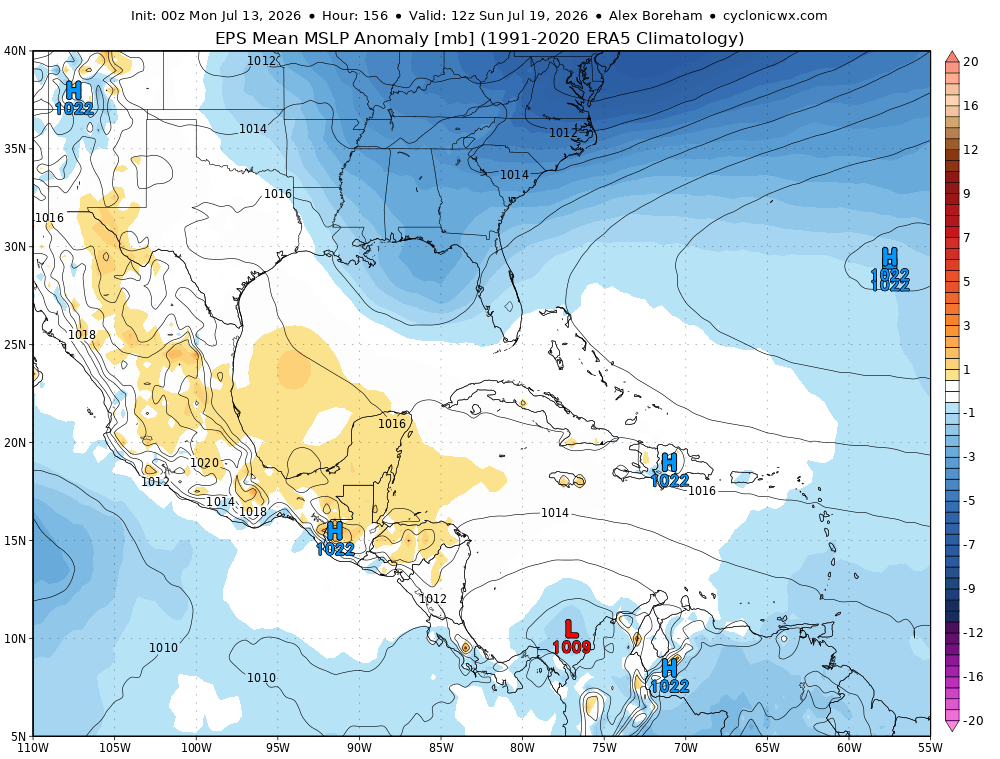
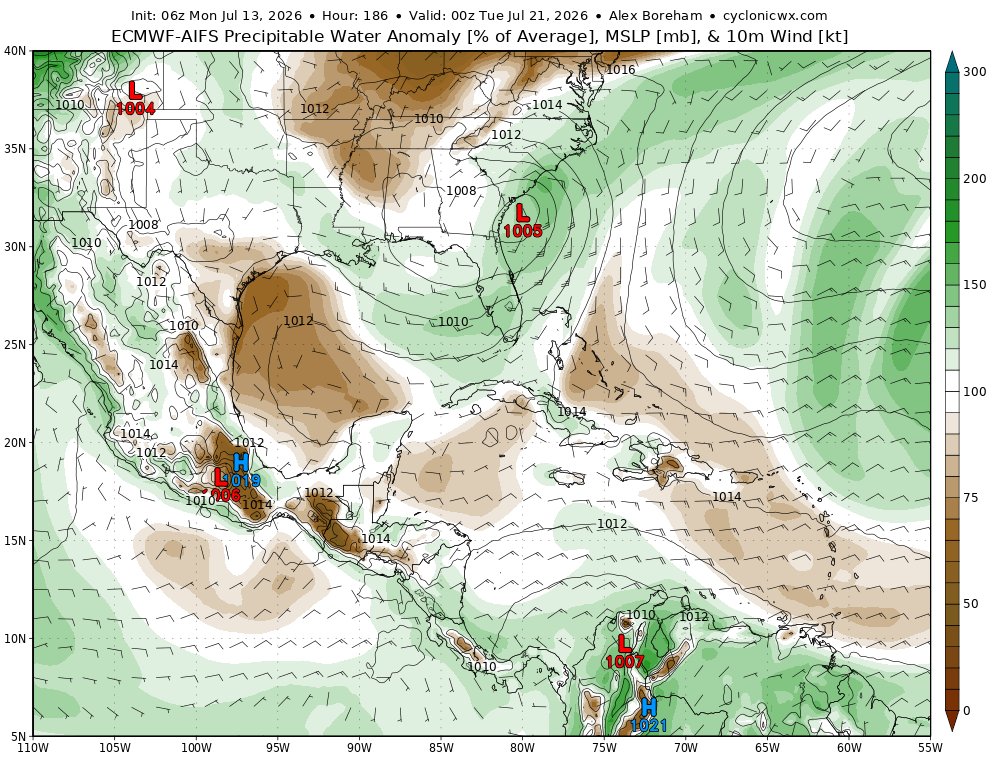
Despite what some have advertised on here, TC development in the northern Gulf currently looks unlikely.
By the time a disturbance moves into the gulf, a trough over the northeastern US will limit time over water whilst deforming the low-level flow, making it difficult to aggregate and stretch vorticity into a TC. Regardless of development, this synoptic setup will transport abundant tropical moisture up the East Coast, generating a flood threat.
To further exemplify this point, water temperatures in this region are record warm for this date for a vast majority of the eastern pacific basin.
Its also worth noting that we have been running at a warmer pace compared to 2015 and 2018 since April.
SST anomaly + records plot shows that the current warmth in the subtropical atlantic is the highest its been for this date since 1985.
This will work to further stabilize the deep tropics this season, which will already be hindered given the effects of El Nino.
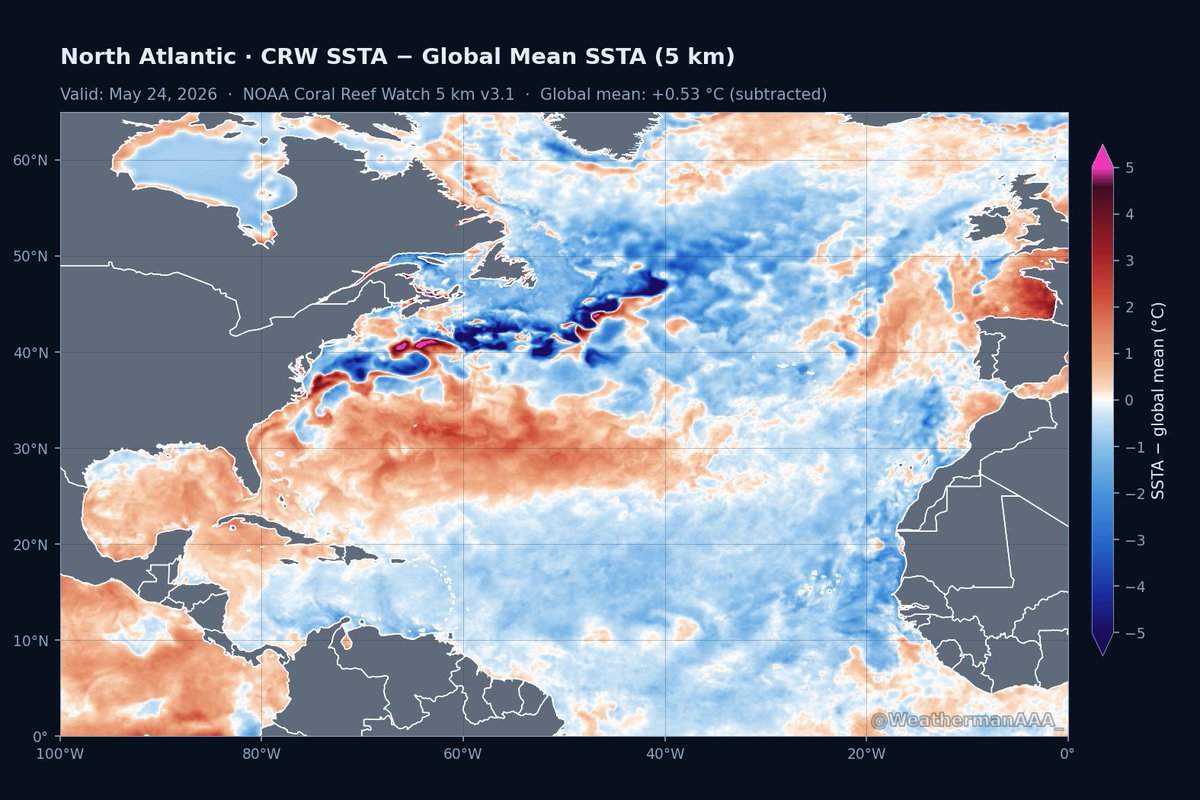
Nice depiction by AAA. This shows the relative sea surface temp anomalies. It subtracts the global mean which allows you to see where the Atlantic is relative warmer and relatively cooler than the other oceans. In this way, you can more easily infer where tropical activity is more likely and less likely. The main development region is not favored. If any place in the Atlantic is favored, it is the subtropics where sea surface temps are record warm.
15 years ago today, one of the most prolific tornado outbreaks ever recorded took place across the south.
Alabama, Mississippi, Tennessee, and Georgia would experience an onslaught of tornadoes; 4 EF5's, 11 EF4's, and 20 EF3's would touch down that day.
All visualized here in 30 seconds.
15 years ago today, one of the most prolific tornado outbreaks ever recorded took place across the south.
Alabama, Mississippi, Tennessee, and Georgia would experience an onslaught of tornadoes; 4 EF5's, 11 EF4's, and 20 EF3's would touch down that day.
All visualized here in 30 seconds.
You’d be hard-pressed to find a more favorable SST setup for eastern Pacific tropical activity this year.
A classic +PMM signature is present, with widespread record warmth off of mexico. can't really ask for a better configuration heading into +enso.
The full satellite view of the pacific provides a neat visualization of the twin Tropical Cyclones (TC's) occurring in both hemispheres.
Note the belt of enhanced westerly flow visible along the equator as their circulations interact.
Typhoon #Sinlaku in the western Pacific has generated a significant amount of early-season ACE, bringing the total up to around 40 units.
This places the 2026 season in 5th for ACE year-to-date, behind 2015, 2004, 1958, and 1979.
If the SST pattern verifies anywhere close to what’s presented here, we could be looking at one of the quietest Atlantic hurricane seasons in years.
Hard to get a more unfavorable setup than this!
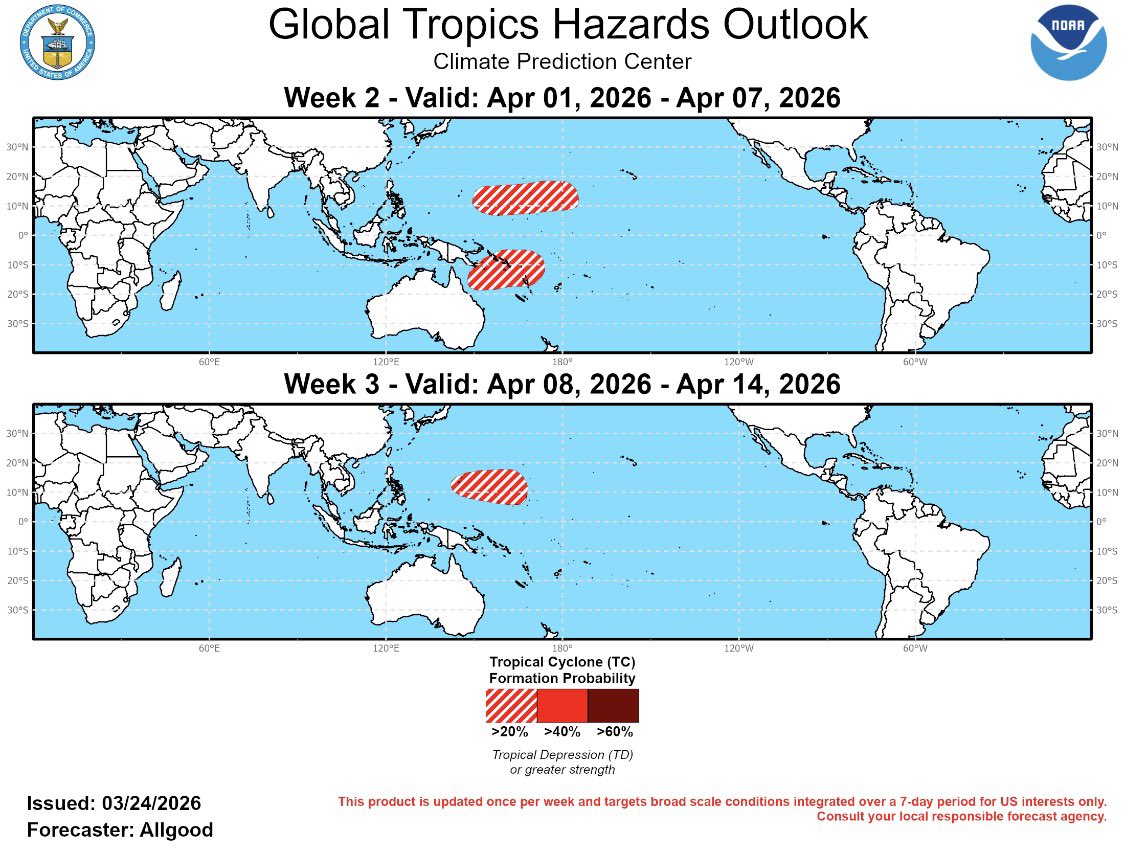
There is an emerging long-range signal for dual TCs to form on either side of the Equator in the west Pacific.
This is colocated with some of the warmest waters on the planet currently; their circulations would enhance westerlies across the region which can contribute to warm pool expansion/downwelling Kelvin waves further east.