The market rallied 20.6% off the March low in just 9 weeks.
Last week's selloff grabbed everyone's attention, but let's keep it in perspective.
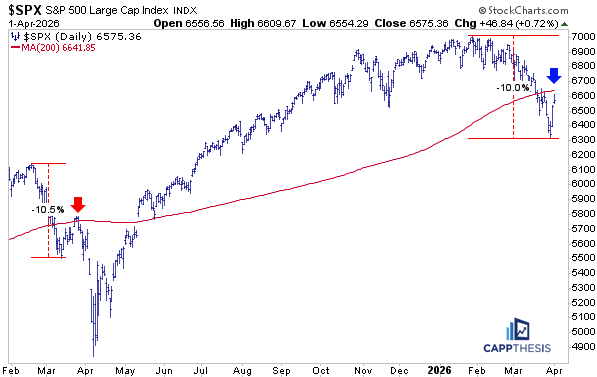
We now have well-defined support at 7333 and resistance at 7620, creating roughly a 4% trading range.
Today printed an inside day after Friday's damage.
That tells me one thing: the market is taking a breather, not waving a white flag.
Daily charts have taken some hits. Weekly charts are still holding up.
The next move will come from price, not headlines.
Trade the structure. Ignore the noise.
$SPX $SPY $QQQ @Optuma
8 consecutive higher weekly closes on the $SPX
Last time this happened was late 2023.
Back then everybody was calling for the top too.
Market just kept grinding higher anyway.
Now here we are again.
Still seeing narrow leadership underneath though.
This is not one of those “everything goes up” environments.
This is a sniper market, not a shotgun market.
Money is rotating very selectively right now.
Some names look incredible.
Some are completely dead money.
That’s why rotation matters.
That’s why structure matters.
Most people still chasing headlines.
Have a great long weekend with your family and friends. Thank you.
$SPY $QQQ @Optuma
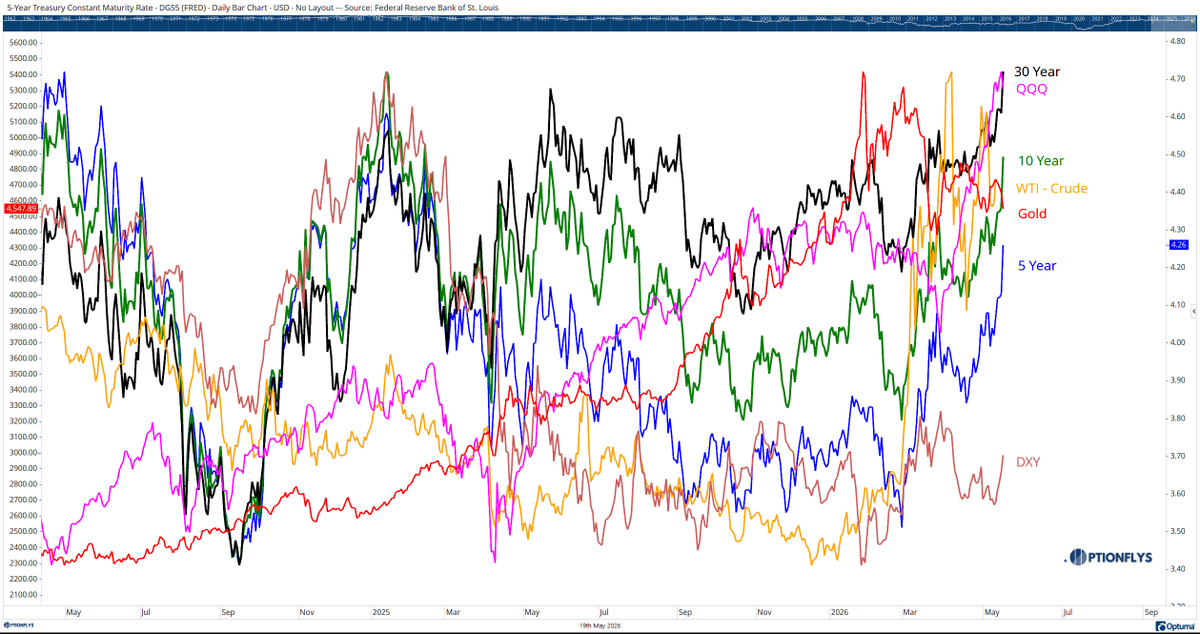
Something unusual is happening beneath the surface.
• 30YR yields rising
• Crude oil rising
• Gold consolidating after a massive run
• QQQ still making new highs
Historically this combination doesn’t normally persist together for long.
The bond market is signaling inflation/debt pressure while AI liquidity continues overpowering macro tightening.
Gold exploded higher first.
Now it’s digesting while tech and energy continue rotating underneath.
Very unusual market structure.
Structure > narrative.
$SPX $QQQ $SPY @Optuma
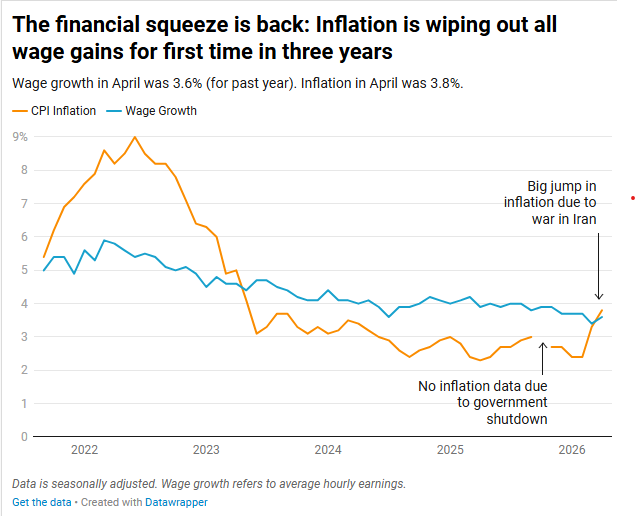
INFLATION NOW OUTPACING PAYCHECKS
Inflation is once again rising faster than wages, putting Americans under growing financial pressure for the first time in about three years.
Consumer prices climbed 3.8% over the past year, while wages rose just 3.6%, meaning many workers are losing purchasing power.
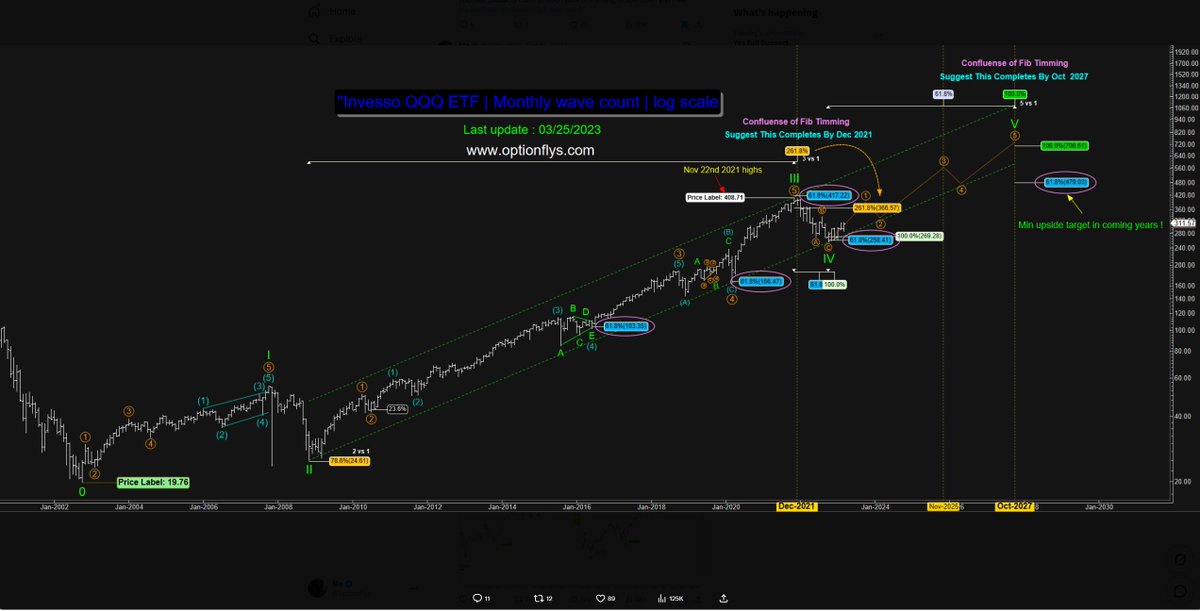
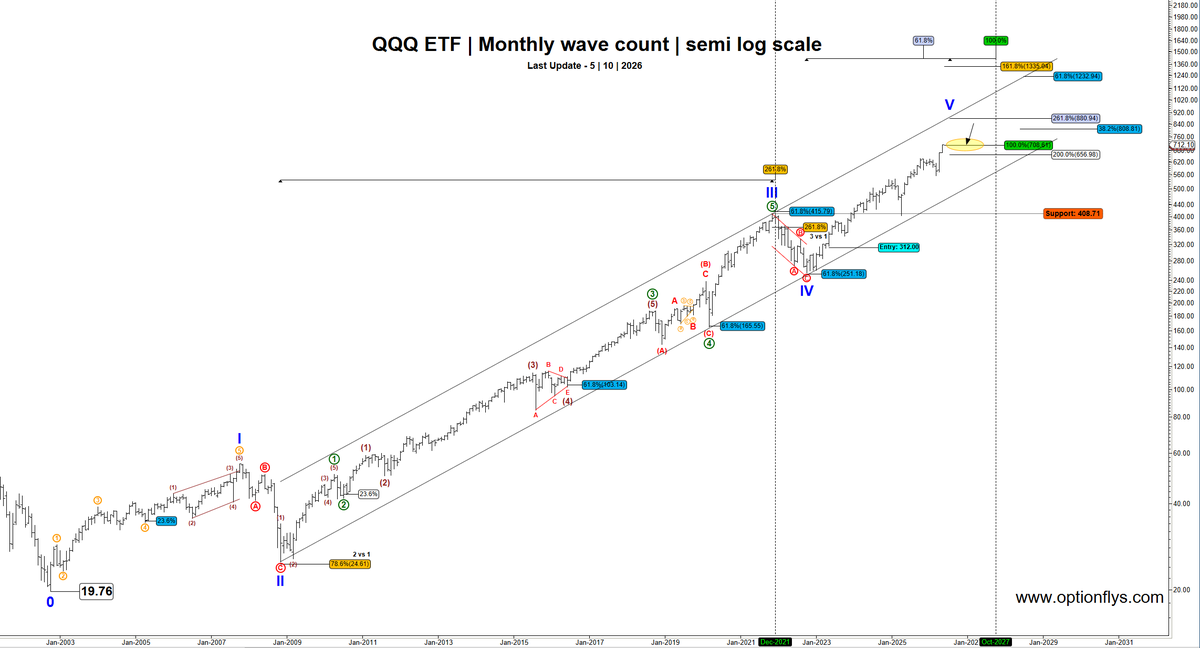
$QQQ Monthly wave update.
On March 25, 2023 I posted a long-term monthly Elliott Wave count on QQQ when price was 312.
On Sept 19, 2024 I updated the exact same wave count at 491.
Last Friday QQQ closed near 712 after reaching the projected 100% extension target at 708.61 nearly to the penny.
From the original 2023 roadmap:
QQQ rallied roughly +128%.
Time from first projection to target completion:
~3 years and 2 months.
People think Elliott Wave is just random lines and subjective counts.
Real wave analysis combines:
• price
• time
• momentum
• channel geometry
• Fibonacci expansions
• wave progression
The bigger picture?
QQQ has been rising inside this secular channel for decades and still has NOT tested the upper 5th wave channel resistance yet.
The original 5th wave target has now been extended using higher Fibonacci expansions and broader channel projections.
Wave counts evolve.
The primary wave count remains intact.
No predictions.
Just wave structure doing the work.
$SPX $SPY
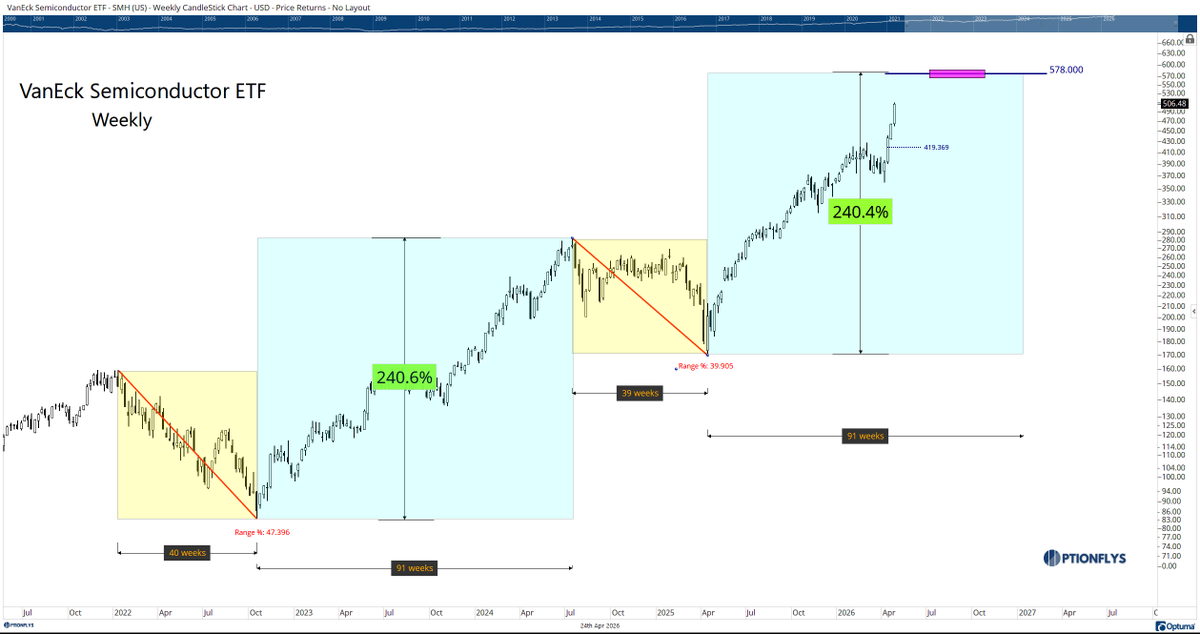
$SMH
40-week reset
91-week expansion
419 → 506
Still tracking the same path
578 next
Measured geometry
Feb 24th 👇
https://t.co/cIVMIvB92T
$SPX $SPY $QQQ
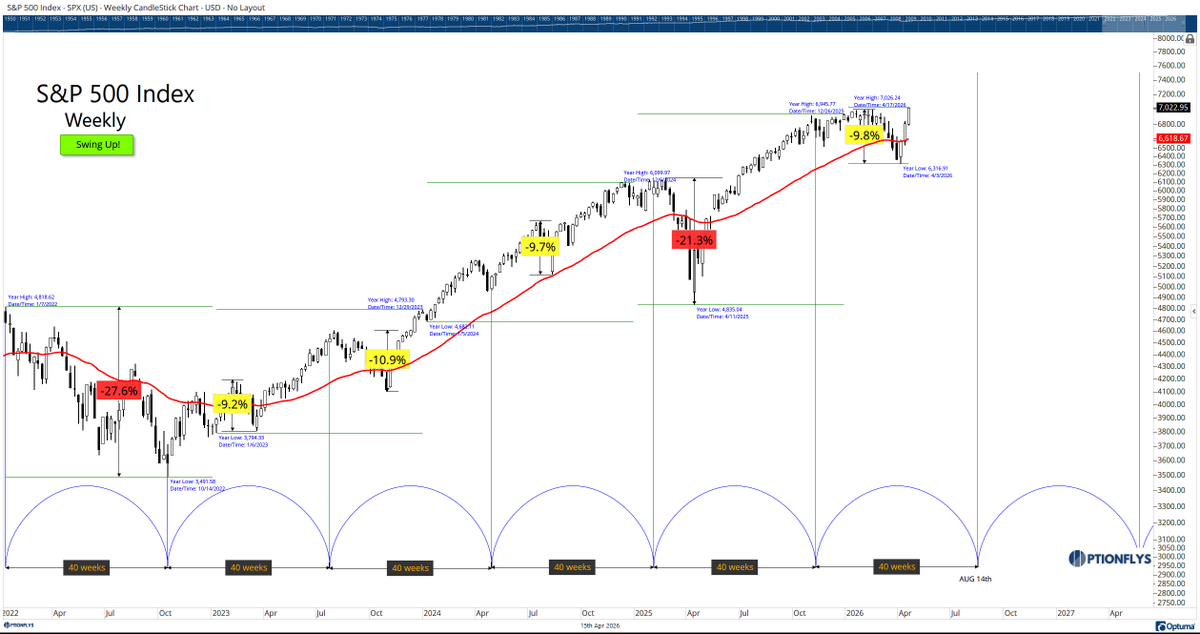
$SPX Cycle update.
April 1. Called the reset.
~10% dip into the 40 week.
Now new highs.
Same cycle again.
Next window Aug.
Everyone calls it random.
It’s not.
It’s structure.
April 1 👇
https://t.co/zAib2WFPhs
$SPY $QQQ @Optuma
Trump Presidency Seasonal Cycle Spring Bottom — S&P 500's low close was March 30, right on cue with the seasonal pattern. During Trump Presidency Years, the market tends to carve out a spring bottom in late March to early April before advancing into year-end. Ceasefire is holding, new U.S.-Iran talks in the works this week. Markets don't wait for clarity — they bottom in uncertainty. The S&P 500 has already erased all of its Iran war losses. Growth is holding, labor is solid, Fed is neutral. Setup for equities into year-end looks increasingly constructive. $SPX #TACO
$SPX
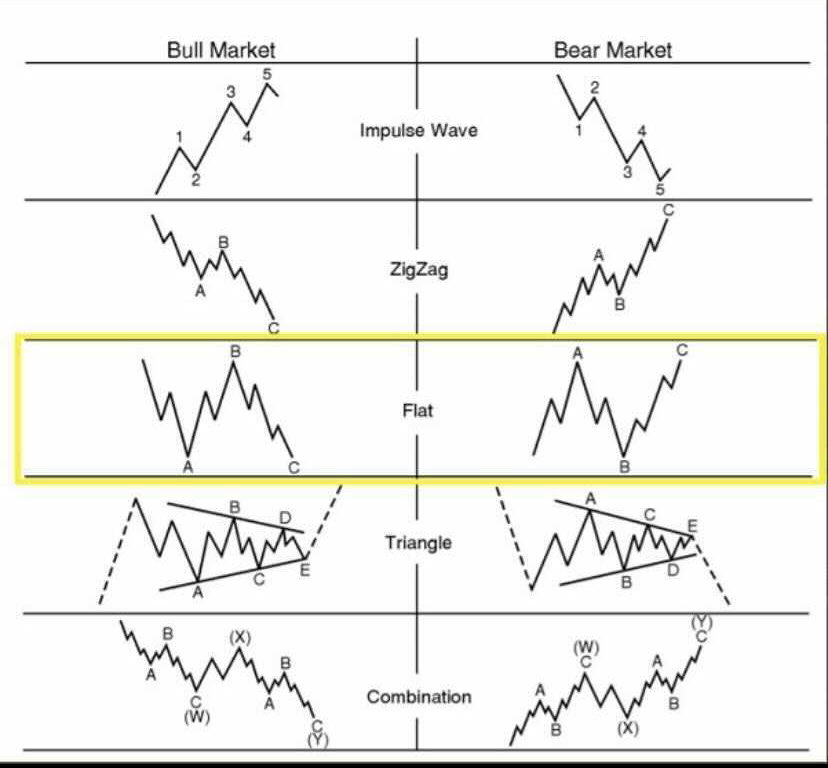
This entire move down can be counted as a complex W-X-Y correction.
If that’s the case, the low may already be in.
Now it’s simple.
If we build clean 5 waves up from here, that’s not a bounce - that’s a trend shift.
If this turns into a choppy 3 wave move, then this is just an X wave and we go lower for Y.
Most traders try to call the bottom.
I let structure confirm it.
Next few sessions will decide everything.
$SPY $QQQ
Experienced Investor
5% - pullback
10% - correction
20% - bear market
35% - market crash
50% - recession
New Investor
5% - market crash
10% - this is the crash
20% - WTF is this
35% - I thought stocks only go up
50% - The Market is a scam.
$SPX $QQQ $SPY
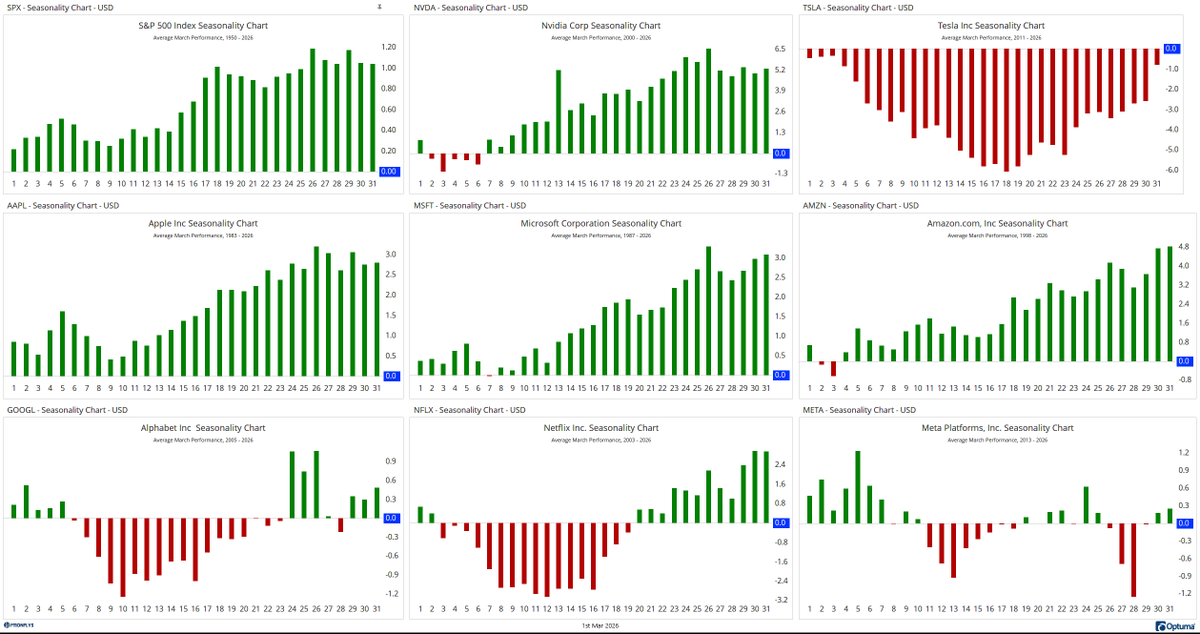
Just updated everything to March.
Seasonality is very clear.
$SPX historically firms up mid-to-late March.
The strongest stretch is usually after the 15th.
$NVDA tends to turn higher mid-month and expand into the 20–26 window.
$MSFT and $AAPL show steady accumulation patterns through the back half.
$AMZN improves after early noise.
Now here’s the interesting part.
$TSLA is weak almost the entire month historically.
Deepest negative stretch is March 10–20.
Seasonality + weak relative = caution.
$NFLX also weak early.
$GOOGL soft first half.
So, if geopolitical fear persists → gold stays bid, growth chops.
If fear fades → second half of March historically favors expansion in growth.
First half = shakeout.
Second half = expansion window.
Rotation first.
Signal second.
Let’s see which side March chooses.
$SPY $QQQ @Optuma
$SPX
Price did exactly what healthy trends do.
Digested through time, not damage.
Swing still UP.
Weekly never issued a sell.
Upper structure back in play.
This isn’t momentum chasing — it’s price reconnecting with structure.
Let the chart do the talking.
Pay attention to time, not just price.
Previous post Dec 18th, 👇
https://t.co/IsIXuMdDA4
$SPY $QQQ @Optuma