공부
1. 매매 기회를 탐색하는 수단이지, 그 자체로 매매할 충분한 이유가 되는 것은 아니다.
2.현재 시장 환경에서 내가 발견한 가격 움직임에 어떤 의미를 부여해야 하는지 판단
3. 자신의 전략이 어떤 시장 환경에서 작동하도록 설계되어 있는지 파악
4. 차트에서 패턴을 발견하는 것과 그 패턴을 활용해 하나의 거래를 운영하는 것은 서로 다른 작업
5. 정상적인 가격 변동과 매매 가설이 무효화되는 상황을 구별하는 능력이 중요
6. 손절을 잘한다는 것은 손절을 빠르게 하거나 적게 하는 것이 아닌, 자신의 매매 가설이 무효화되는 상황에 적절히 대응한다는 뜻
정리
가격 구조를 읽는다는 것은 패턴을 많이 아는 것이 아니라,
-언제 거래할 가치가 있는지 판단하고
- 자신의 판단이 틀렸을 때와 맞았을 때 모두 적절히 대응하는 능력을 갖추는 것
기술적 분석을 다룬 책에서조차, 차트는 예언 도구가 아니라 조건부 대응 도구라는 점을 명시.
더불어, 3개월 정도 제대로 차트 수천 장 돌려보면 패턴 인식 자체는 스킵 가능한 수준이 됨 (머리에서 1~2초 안에 처리가 이루어짐)
Triangle인지 Wedge인지, Rectangle인지 Flag인지 애매한 경우도 결국 실제 매매에서는 크게 중요하지 않음. 그러니까 “이 패턴 이름이 뭐지?” 단계에 오래 머무르는 것 또한 큰 의미 없음. 이게 무슨 패턴이네 아니네 싸우고 앉아있는 것 보면 웃길 따름이고...
진짜 어려운 건 Pattern Recognition이 아니라 Pattern Selection이고, 그것보다 더 어려운 것은 Pattern 보다 **Context를 살피는 것이고, 그것보다 더 어려운 것은 Trade management. 어디서 들어갈지보다, 어디서 틀렸다고 인정할지, 얼마를 베팅할지, 맞았을 때 얼마나 오래 들고 갈지가 훨씬 어렵습니다.
**Context라 함은 매크로, 시장 추세, 산업 동향, 섹터 강도, 상대강도, 수급, 거래량, 실적, 포지셔닝, 이벤트 일정 등...
어쨌든 책은 살펴보시는 것을 추천드립니다.
-
개인적으로 첨언하고 싶은 점은...
좋은 종목을 고르는 능력이 올라갈수록, 리스크 관리의 핵심도 바뀌는 것 같습니다. 손절을 잘하는 것보다, 현재 시장에서 정상적인 변동성을 손실로 착각하지 않는 것이 더 중요해지는 쪽으로.
명절에 어디 안가고 집에 있고 심심해서 할 것없다. 그런데 유튜브에 관심은 있었다면 GPT Astra 딱 100$ 만 투자해보세요.
1. 하고 싶은 유튜브 장르를 고른다
2. 레퍼런스 다른 채널을 분석해달라고 한다
3. 따라하고 싶다고 한다
4. 초안 작업을 맡긴다
5. 결과물을 올린다
꼭 경험해보시길....
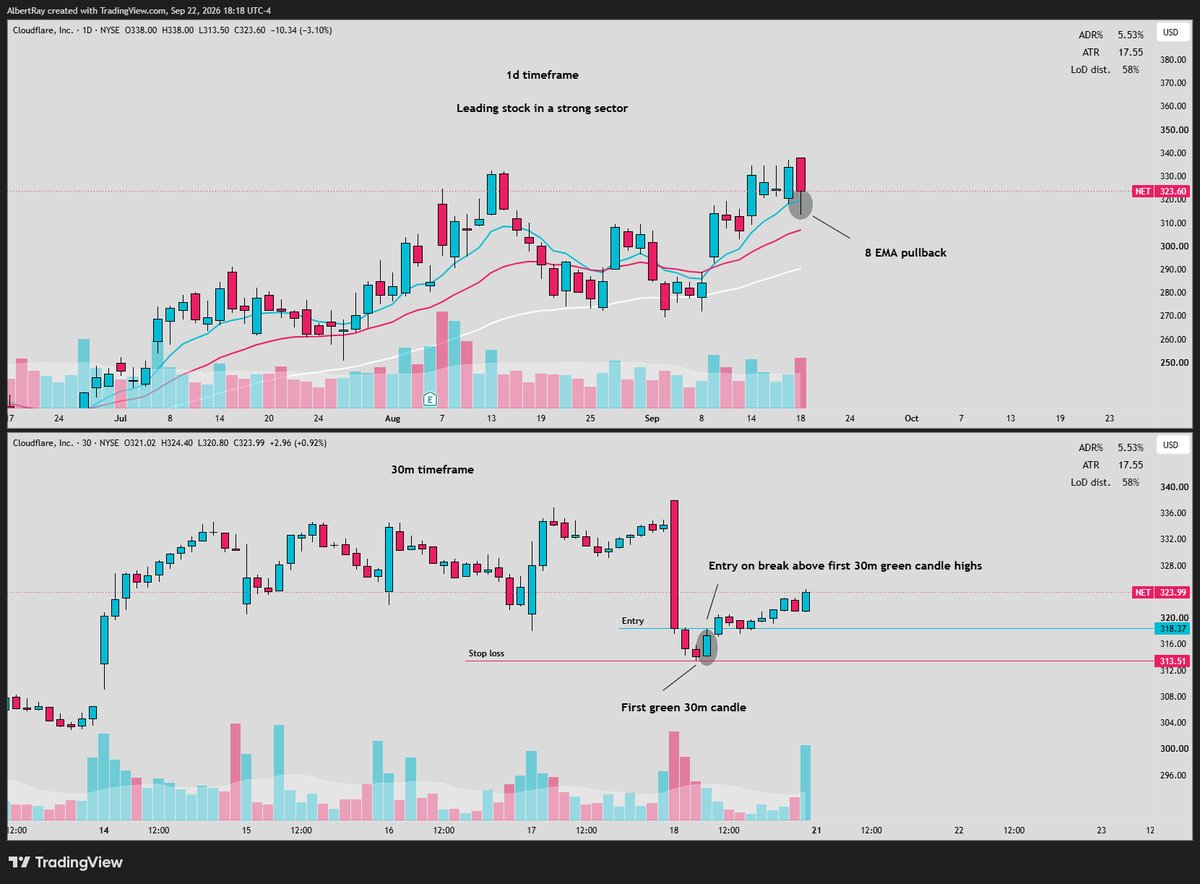
One of my favorite entries in the market:
Buying pullbacks on leading stocks using the 30 minute pivot, learned this concept from @1ChartMaster
A lot of traders know how to find strong stocks...
The problem is they have no idea WHERE to enter them
They either:
-Chase the initial breakout
-Buy randomly during the pullback
-Or wait so long that they miss the next move
This is where the 30-minute pivot can become extremely useful.
First, I want to identify a LEADER
I'm looking for a stock that has already proven itself:
Broke out of a major base
Expanded on strong volume
Made a multi-day move higher
Is outperforming the market/sector
Is trading in a clear uptrend
Then I wait.
I don't want to chase a stock that's extended from its moving averages.
I want to see it PULL BACK and give me another setup.
Ideally, that pullback starts becoming controlled:
-Selling volume decreases
-Candles tighten up
-Price starts respecting the 8/21 EMA
-The stock stops making aggressive moves lower
Then I drop down to the 30-minute chart
What I'm looking for is a clear pivot to develop...
The first 30m green candle that forms off the key moving averages tells me that buyers are regaining control
If price can break that 30-minute pivot with strength...
I'm no longer trying to GUESS where the pullback ends
I'm allowing PRICE to show me that momentum may be shifting back toward the direction of the larger trend
My process comes down to this:
Daily chart = tells me WHAT I want to watch.
8/21 EMA = tells me WHERE I want to pay attention
30-minute pivot = helps me identify WHEN momentum is potentially returning
That combination keeps the process simple
Leader + Pullback + Key EMA + Tightness + 30-minute pivot
Instead of chasing strength on extension
I want to let the stock come to me, build a structure, and then wait for confirmation.
You don't need to catch the exact bottom of every pullback.
You need a repeatable process for identifying when the stock is starting to act right again.
Seriously, spend a weekend doing this once & thank yourself later:
Create a watchlist for every major theme you care about + dump all the relevant names into them.
Now, when someone says... “memory is ripping,” you click your "memory" WL, and there you go!
Build the baskets.
If you're a momentum swing trader, build your process in this order:
Market/environment → Groups/themes → Leadership/RS → Setup → Risk → Entry & repeat.
Not:
Random scanner result → pretty pattern → BUY.
Start with where capital is flowing, then find the strongest stocks within those areas, and wait for your setup.
That hierarchy alone can eliminate a LOT of mediocre trades.
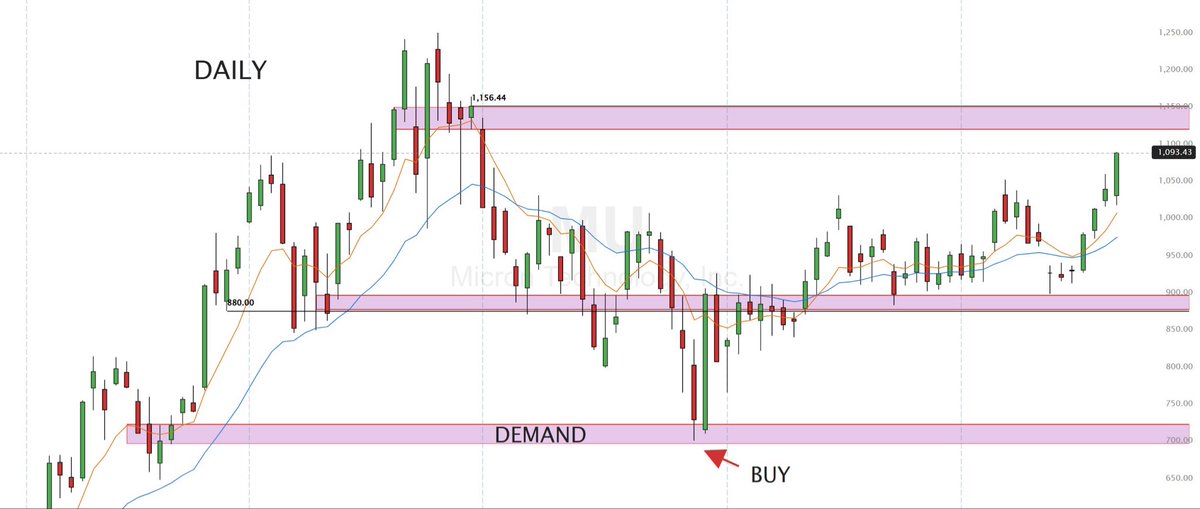
$MU is probably one of my favorite stocks in the market right now.
I also have absolutely ZERO interest in buying it here.
Let me explain why... 1 rule I’ve developed from getting punched in the face enough times is that I generally don’t buy recent momentum directly into a resistance gap.
I don’t care how strong the stock looks or how badly I want exposure. If there’s a large overhead gap where price previously broke down, I assume there is supply there until price proves otherwise.
Think about the psychology of who owns shares inside that gap. You potentially have buyers who bought before the breakdown and have spent weeks/months underwater. As price finally rallies back toward their cost basis, some of those people are thinking, “Thank God, just get me out at breakeven.” That creates supply.
At the same time, traders who bought the recent momentum are sitting on increasingly large gains and have an incentive to take profits as price runs into an obvious resistance area.
That’s why I want to see digestion, NOT immediate continuation.
With something like $MU, I’d ideally like to see at least a week of boring PA inside/under that resistance gap. Let the 9EMA catch up, watch for ranges to contract, volume to dry up, and let the stock absorb people who have been waiting months to sell while NEW buyers continue supporting price. I want sellers to have every opportunity to knock the stock down...and fail.
If $MU spends a week or a few days going sideways after a huge move instead of immediately puking, it tells me that supply may be getting absorbed. Every day that sellers have an opportunity to push price lower and make little progress makes the chart more interesting to me. It's important to know that time can heal an extended chart!!
And selfishly, waiting also gives me something I desperately need...a place to be wrong quickly.
Buying vertically into a resistance gap usually leaves me chasing price with terrible r/r. Where does my stop go? LOD might be miles away. The 9/21EMA might be nowhere close. I’m essentially betting that momentum continues immediately, and if it doesn’t, I’m sitting through normal digestion with a horrible average.
I’d MUCH rather let $MU become boring again.
Give me a week+ of digestion. Let the moving averages catch up, potentially lose/reclaim the 9EMA, build a higher low, tighten up, and then start curling up the right side again. Now I can use the 15/30 minute chart to look for my pivot, VWAP reclaim, first HL, etc., with an obvious pivot underneath me where the trade is wrong.
I might miss another 5-10% waiting for that. I genuinely don’t care.
I’ve learned the hard way that recent momentum does not automatically equal a good entry. My job isn’t to own $MU every day it goes higher. My job is to wait until the stock gives me an asymmetric opportunity where demand is still obvious, overhead supply has had time to get absorbed, and I can define my risk tightly.
So $MU can keep ripping without me for now. I love the momentum, I love the relative strength, and I’m paying VERY close attention.
But until it digests this resistance gap and gives me another setup off the moving averages, it’s a great stock that simply isn’t a great trade for me yet.
Do as you wish with this information. Godspeed :))
Chart: $MU.
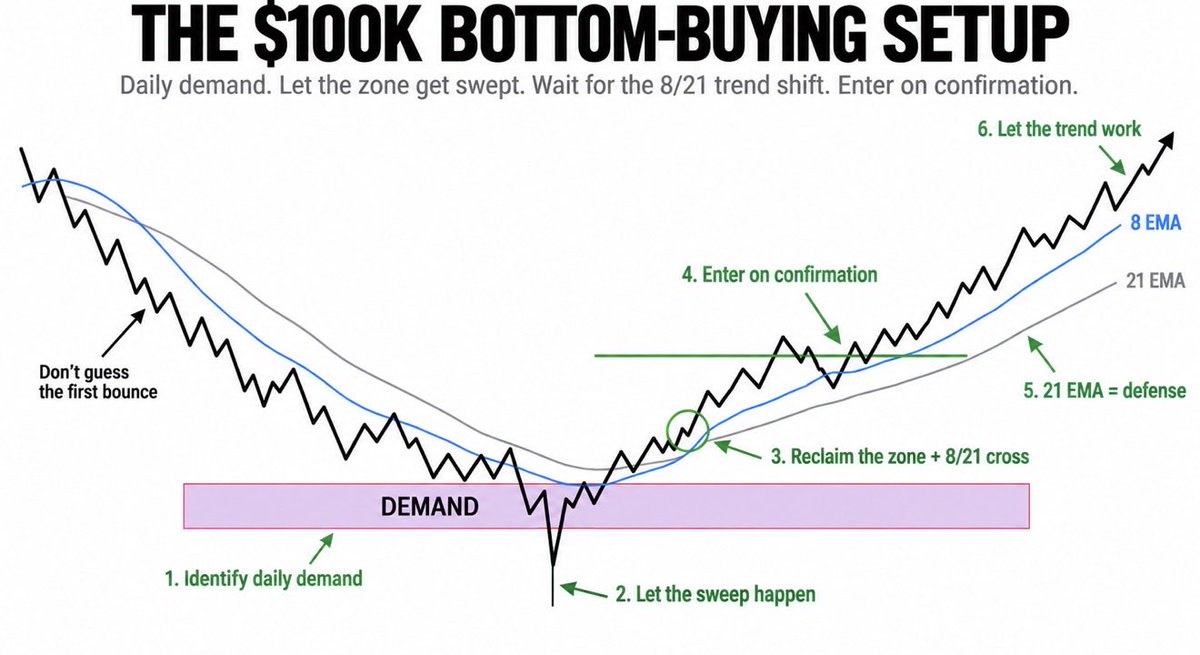
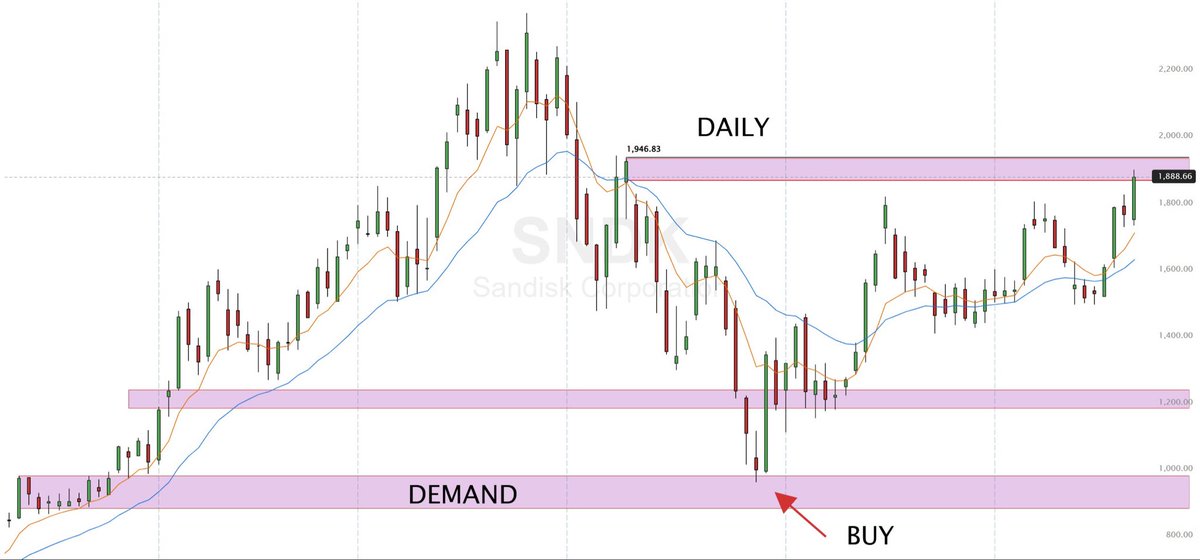
LEARN HOW TO BUY A BOTTOM TO RETIRE EARLY
Study these names: $SNDK $MU and
$ARM
The setup:
Daily demand.
Let the zone get swept.
Wait for the reclaim.
Wait for the 8/21 trend shift.
Enter on confirmation.
This is how you buy BEFORE every one else
Stop chasing AFTER the move.
“이미 1년 반이나 올랐는데 이제 와서 뭘 사냐.”
이런 이야기도 많이 보입니다.
그런데 역사적으로 강세장의 중앙값은 약 3.5년입니다.
1년 반이면 평균적인 강세장의 끝이 아니라 아직 중간 부근입니다.
강세장 중반부터는 ‘얼마나 올랐나’보다
‘왜 아직도 못 올랐나’를 물어야 합니다.
다만 이번에는 한 가지를 더 봐야 합니다.
AI는 ‘인프라 사이클’입니다.
인프라 사이클에는 언젠가 물리적인 끝이 있고,
주가는 인프라가 다 깔릴 때까지 기다려주지 않습니다.
닷컴 당시에도 나스닥은 2000년 3월 먼저 고점을 찍었지만
미국 통신사업자 CAPEX는 2001년에야 정점을 찍었습니다.
주가는 CAPEX의 정점을 확인하고 떨어지는 게 아닙니다.
CAPEX가 계속 증가하고 있어도 수주와 백로그, 실적 추정치의 추가 상향 여지가 줄어들기 시작하면 주가는 먼저 미래의 둔화를 반영할 수 있습니다.
그러니까 우리가 봐야 할 건
“인프라가 얼마나 많이 깔렸느냐”가 아니라,
앞으로 더 좋아질 여지가 얼마나 남아 있느냐입니다.
CAPEX가 계속 늘어나는가보다
CAPEX 전망이 계속 상향되는지,
수주가 많은가보다
수주 증가율이 계속 가속되는지,
실적이 좋은가보다
앞으로의 실적 추정치가 계속 올라가는지가 더 중요합니다.
그리고 이 논리를 반대로 적용하면,
시장 전체가 1년 반 동안 강하게 올랐는데도
아직 아무런 추세를 만들지 못한 기업을 단순히
“얘는 아직 안 올랐으니까 싸다”
라고 볼 수 없습니다.
강세장이 진행될수록
가격이 얼마나 높아졌는가보다
앞으로 더 좋아질 기울기가 남아 있는가를 봐야 합니다.
10배 오른 주식이 무서워 보일 때가 있습니다.
그런데 저는 가끔 반대로 생각합니다.
2025년 4월 관세 충격 이후 한국 증시의 강세장이 1년 반 가까이 진행됐습니다.
그동안 어떤 종목은 3배, 5배, 10배가 됐고
어떤 종목은 아직도 그 자리입니다.
많은 사람들은 이렇게 생각합니다.
“저건 너무 많이 올랐고,
얘는 아직 안 올랐으니까 싸다.”
그런데 가격이 많이 올랐다는 건
비싸다는 뜻이 아닙니다.
실적과 이익 추정치가 주가보다 더 빠르게 올라왔다면
10배 오른 주식이 오히려 처음보다 쌀 수도 있습니다.
반대로 주가가 바닥에 있다는 이유만으로
싼 것도 아닙니다.
오히려 시장 전체가 1년 반 동안 강하게 올랐는데도
계속 못 오른 종목이라면,
왜 아무도 이 주식을 사지 않았는지를 먼저 고민해봐야 합니다.
강세장에서 상대적 약세는
그 자체가 하나의 정보입니다.
때로는 10배 오른 주식보다
1년 반짜리 강세장에서 한 번도 제대로 못 오른 주식이 더 무서울 수 있습니다.
오늘 나는 좋았던 경험이든 나빴던 경험이든, 모든 경험이 소중한 스승이라는 것을 깨닫고 그 경험들이 가르쳐 준 교훈을 배우겠다고 다짐합니다.
나는 오늘 하루를 편협하고 좁은 생각으로 낭비하지 않겠습니다. 용기를 가지고 새로운 생각을 받아들이며, 내 꿈을 향해 나아가겠습니다.
오늘 나의 목표는 내가 가진 것들에 감사하는 마음을 잃지 않으면서, 단 1분의 소중한 시간도 헛되이 보내지 않고 최선의 나 자신이 되는 것입니다.
나는 하루 중 잠시잠시 시간을 내어 모든 사람과 모든 것에서 좋은 점을 발견하고, 인간으로서의 따뜻한 마음을 되새기겠습니다.
오늘이라는 하루와 그 안에 담긴 무한한 가능성에 감사드립니다.
🙏