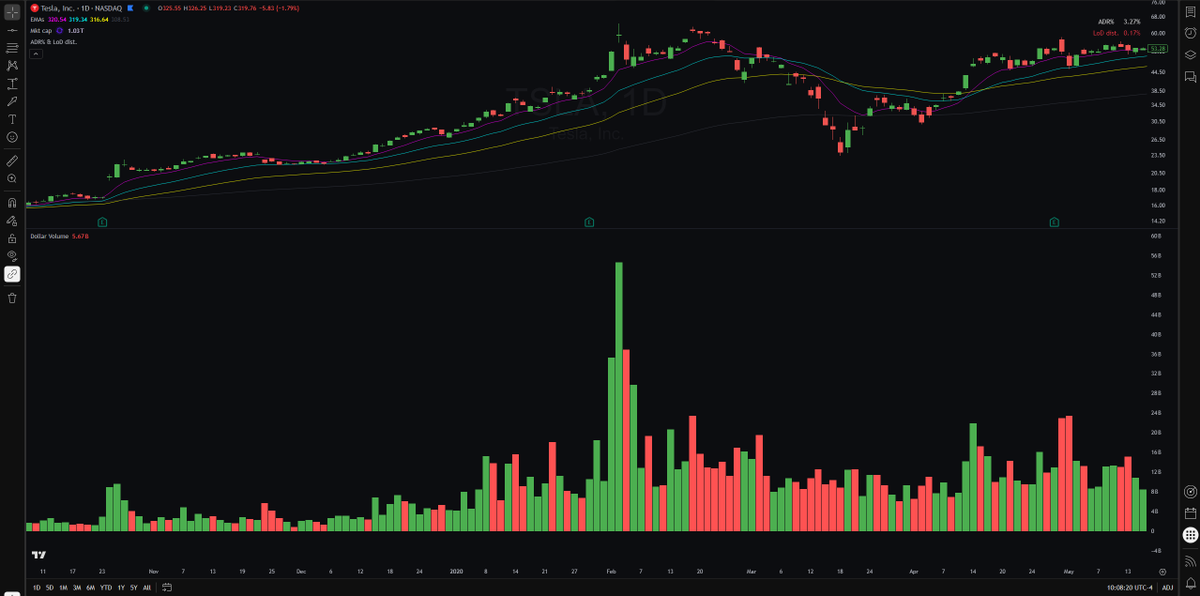
The most frequent advice we get on position sizing is a recipe for blowing up our accounts.
I looked at how Market Wizard Kristjan Qullamaggie actually sized his positions, to go from $9,000 to $105,000,000 in 10 years https://t.co/QNkqL5QvTX
I came across an article @PradeepBonde wrote and below is a very important excerpt:
- Expertise lead career is one of the way to achieving success
- Expertise is not knowledge, it is situation specific
- Expertise is not age dependent, it is dependent on how much focused effort you put in to building expertise
- Expertise is not hierarchy dependent
- Expertise is more self satisfying process. The title, salary, perks you will get is a side effect
- Expertise building is under your control not dependent on external factors
- Expertise and perspective are two most critical skills in any field
Tom Lee made a very interesting point in Thursday’s @fundstrat Macro Minute.
The first leg of the AI trade was upstream: semiconductors, memory, infrastructure.
Those trades had extraordinary runs and are now correcting
What is gaining traction now is downstream.
Software. Applications.
And, interestingly, $ETH
Ethereum already went through a massive deflation of expectations, while the underlying story kept getting stronger.
Stablecoins. Tokenization. Institutional adoption. And eventually AI agents transacting onchain.
That is what makes this chart so interesting.
Capital may simply be moving from building the infrastructure to owning the rails where the next wave of activity happens.
And that’s why this still feels like the early innings.
The price is starting to move.
The positioning hasn’t.
Most portfolios still own zero $ETH
Earnings EP on stocks no more work as all the move is priced in on day 1 in most cases.
So the setup no more works the same way it used to.
The post earnings announcement drift anomaly no more works like it used to, so you have to develop new setups.
https://t.co/GKonpSymxV
Sell into strength or let it run?
Whatever you decide comes with a side effect
This is the first data I have seen that says how big that side effect actually is 👇 https://t.co/0MsrchQd25
@PradeepBonde Thanks EG, but one thing I always find difficult with your MM is that it switches fairly quickly between sellers and buyers dominating? In MM it often seems to switch after 2-3 all the time? Or do I misinterpret ?
Weekend study: Share one observation from the QCOM vs NDX chart that really stands out to you.
You’ll be amazed how much could be extracted from a single chart.
A masterclass by Martin Luk: Why and how to short SKHY, one of the best trades he took recently.
https://t.co/ep8CBEq6cn
[23:35] - [32:50]
I just shorted a bit of SK Hynix. I would like to expand on this a bit. Generally, when I try to take a new trade, most of the time I would like to align with the daily and the weekly first. Actually, the first thing that I look at is the sector or the theme itself, whether they are doing well or not. I don't want to short the stock where its peers or its sector is doing very well, but it's a laggard in a strong sector. I don't want to short the laggard in a strong sector; I would like to focus on the stock in a weak sector. The more stocks look weak within that sector, the better the sector I would like to short, and vice versa. If I'm trying to go long, I would like many of the stocks to look great in an uptrend or show relative strength to the market, doing some bullish candlestick patterns like an undercut and reclaim, or building higher lows and showing some volatility contraction, maybe some inside days.
In this case, I think the semiconductor sector as a whole is just kind of weak to me compared to the market, and I don't really like the volatility and the volume expansion up there. That's the big picture behind there: the first thing is the sector and the theme, and then going to the individual stock.
SK Hynix is definitely one of the huge leaders that is extended into the upside, and now it is breaking down below the 50 EMA. This is the first bounce into the declining 50 and also bouncing into the declining 9. This is the underlying South Korean stock chart. I really love shorting at the first bounce or the first pullback. It also aligns with the previous swing lows from the bear flag here and the declining weekly 9 EMA. This is the daily and also the weekly too. Although the weekly is not that much, the weekly volume expansion is definitely some sign of distribution that I don't really like.
For the intraday, you guys know I love shorting it on the bounce. Luckily, I didn't short at the opening range lows. We got a quick flush into the previous high on this ADR launch date. I consider this as the previous swing high, then it built support, rallying into the unfilled gap and also the declining 9 EMA. Before the close, before it really turned lower, the 9 EMA was around 187. You can go back to the recordings and see how the 9 EMA looks. It was also near the unfilled gap from this huge green candle. We got an unfilled gap below the 188.50 area.
I'm looking at these levels. I think it's definitely okay to overshoot a bit, maybe into the 189 or 190 level. It did find some resistance at 188. When I saw this five-minute candle gradually losing the momentum, I zoomed in into the one-minute chart and used the anchored VWAP on the one-minute chart. This is the technique that I learned from Kristjan Qullamaggie when he's doing parabolic shorts; he always links it to either the anchored VWAP from the open or the high of the day. He uses this on parabolic shorts, but I noticed that it works pretty well on other entries as well. I utilized this entry tactic into this trade.
We got a one-minute bounce into the anchor. I think this is one of the best trades I've taken recently, and hopefully it works out. But if it doesn't, I think this entry is one of the best this year, definitely. We'll see how it plays out. The stop is pretty tight, and I think the entry is pretty concise and logical at that point. Definitely, you can wait for the five-minute breakdown, but the stop will be a little bit wide. Maybe I would have to set it up to this bar's high, which would be a 2% stop. That's why I always look for other types of entry strategies to really tighten my stop and find the best potential risk-reward entry.
Also, the weakness of the whole semiconductor sector and Western Digital helped. Western Digital is the one that I didn't take on the opening range low breakout, and it just went down like gravity, like a bungee jump, showing huge weakness. It also helps the short on SK Hynix too.
The pattern itself is not the most important thing for taking a trade to me. It's all about the theme as a whole, the sector as a whole, and then gradually zooming into the individual stocks—the weekly, the daily, and then the intraday. Sometimes I may also compare it with the index or the sector ETF to really nail the intraday entry, but it really depends. The precise entry really depends because I don't think there's any chart pattern telling you to short right here; I just couldn't find any.
But I would consider this short a really good entry and a really good trade, no matter how it's going to end up. Actually, if you don't look at today's candle, this pattern as a whole is a bullish pattern. It is called a Morning Star, I think, something like that. A red candle with a doji and then a huge green candle on the right-hand side. It's actually a bullish pattern, but I think the pattern really doesn't matter. It's just a gimmick.
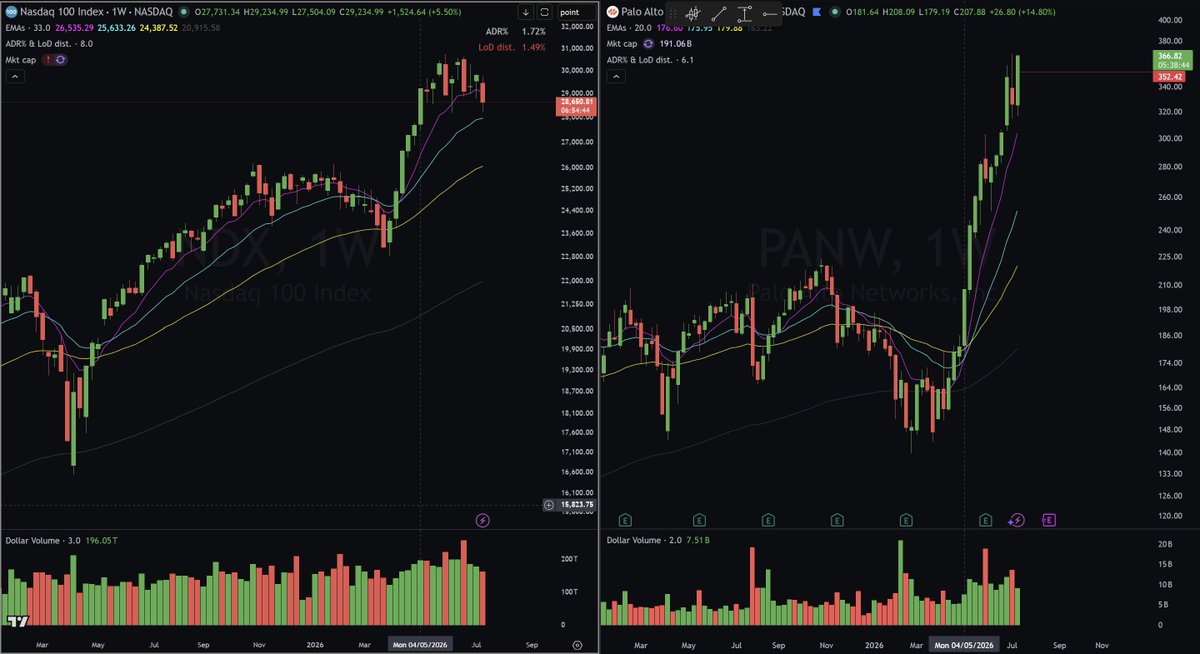
$QCOM has been mentioned repeatedly in my streams as an example of how the next market leader in the AI bull may not have appeared yet. Its stage 2 uptrend began in Jan 1999, near the late stage of the late 1998 lockout rally, and it eventually delivered a staggering 2,900% return after breaking out.
$PANW began its stage 2 uptrend in May 2026, which was near the late stage of the early 2026 lockout rally. I don't know where this thing is going to end up.
$CRWD $FTNT $NET have also shown immense strength during this pullback.
Hey history will you rhyme?
A member in the trading room was asking me about $INOD yesterday, and I explained it could work, but wasn’t for me - this is due to the megaphone pattern.
In other words, volatility is expanding, not contracting.
“Wide and loose is for losers, tight is for winners”
- @Qullamaggie
What makes stock go up say 100% plus in two months? how does the move starts? How it ends? How many days? What catalyst? Which sector? What price points? What capitalization? IPO year and so on. You want to create a profile of what to look for in big movers at start.
Parabolic volume expansion🚀
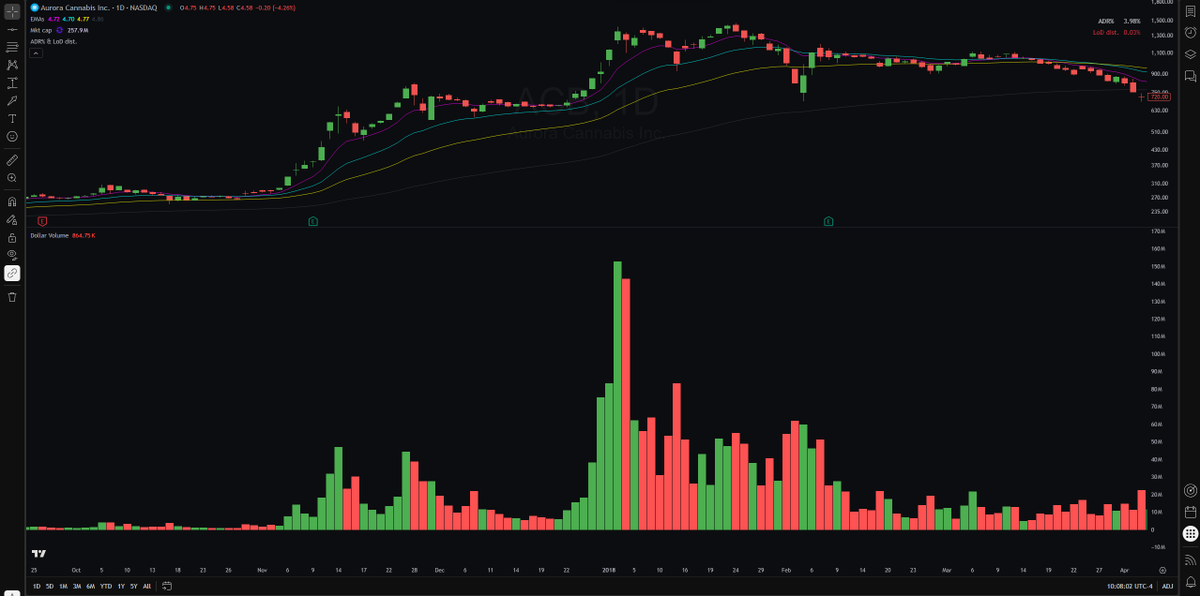
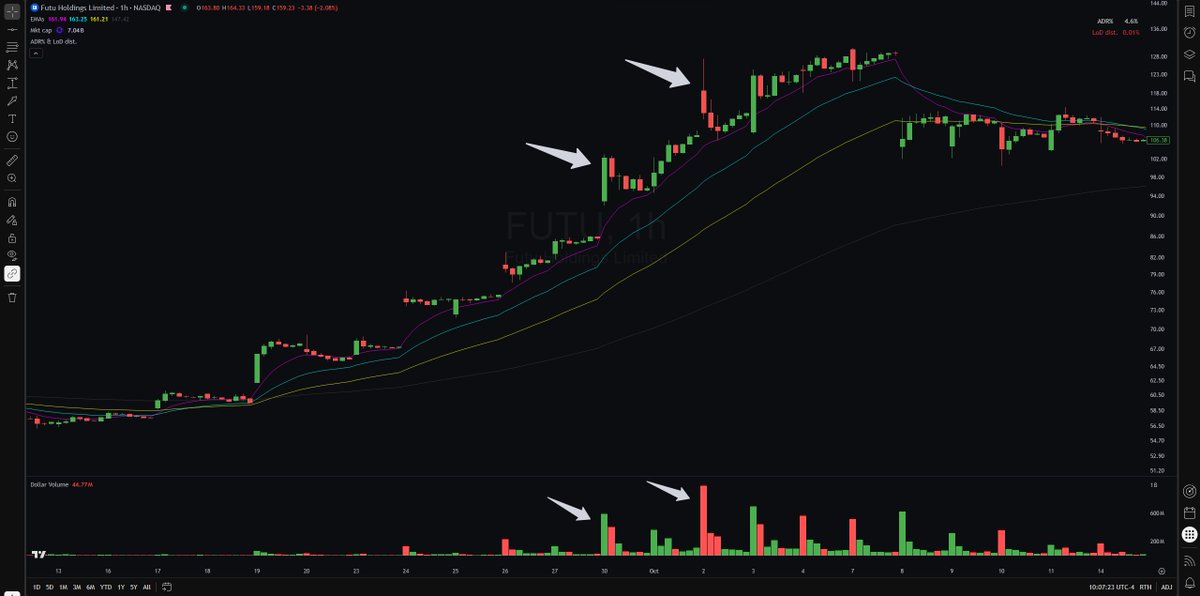
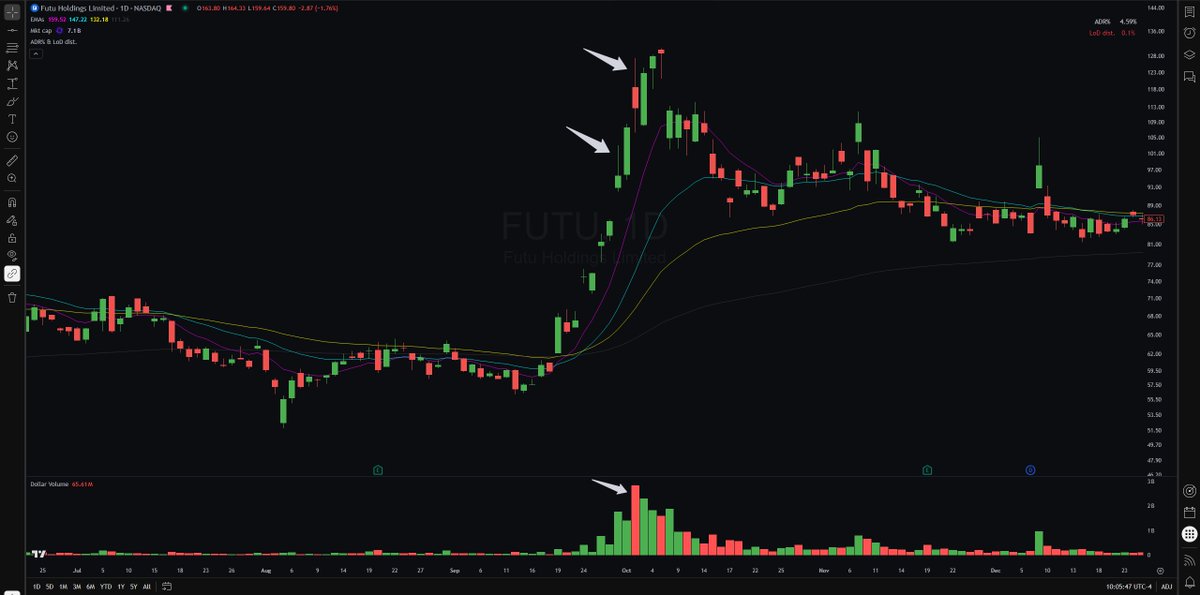
If I could share just one technical edge with others, this would be it.
When stocks are skyrocketing into no man’s land and the market is getting euphoric, it’s even more critical to stay calm and get out fast when the music stops.
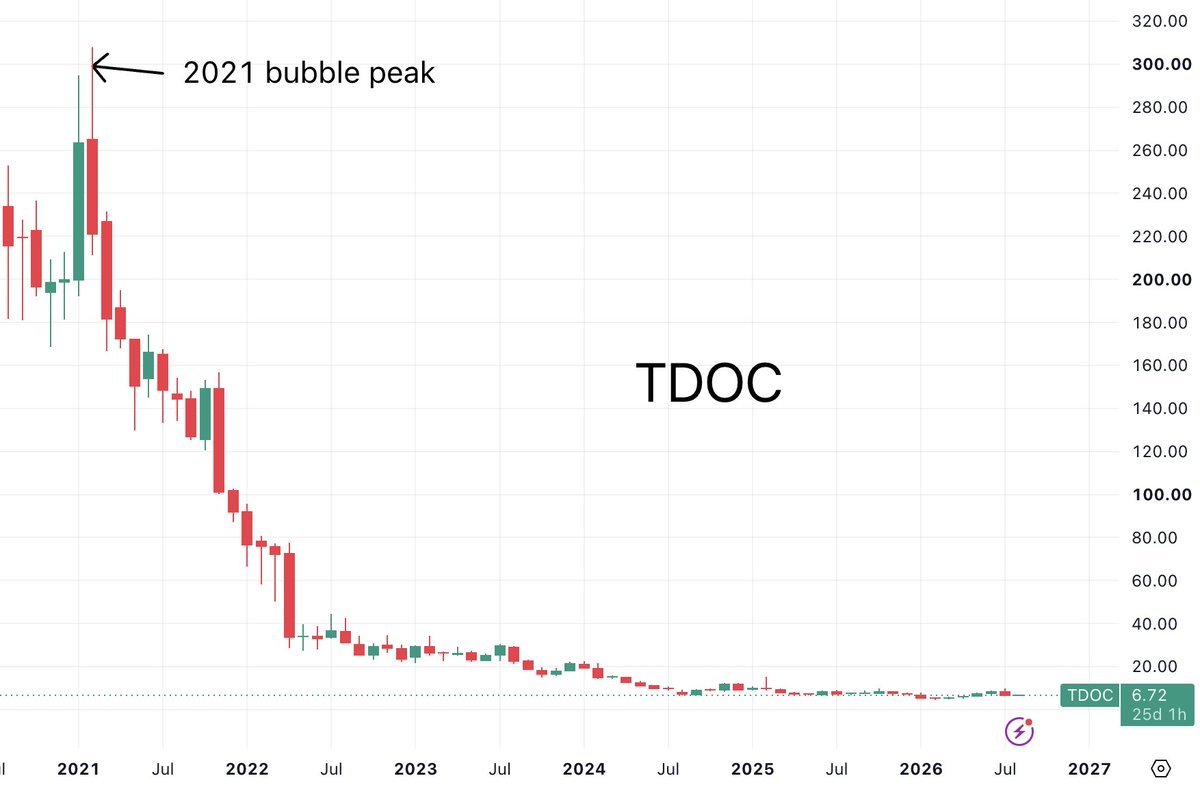
There are countless examples of stocks topping out on a massive volume day after a huge move.
It’s so easy to spot and use, no matter what setup you’re following, what time frame you’re using, or what asset you’re trading.
During the trading day, I’ll zoom in and use a 15-minute or 1-hour time frame to watch for volume expansion and sell into strength.
Even if you hide the price, you can spot the top solely by the volume.
Always sell some when the volume is pouring in.
---
I accidentally deleted the original tweet that's why you're seeing it again