The Great Gross-to-Net Panic of 2026: OpenAI’s ARR in two charts & glass half empty vs. half full
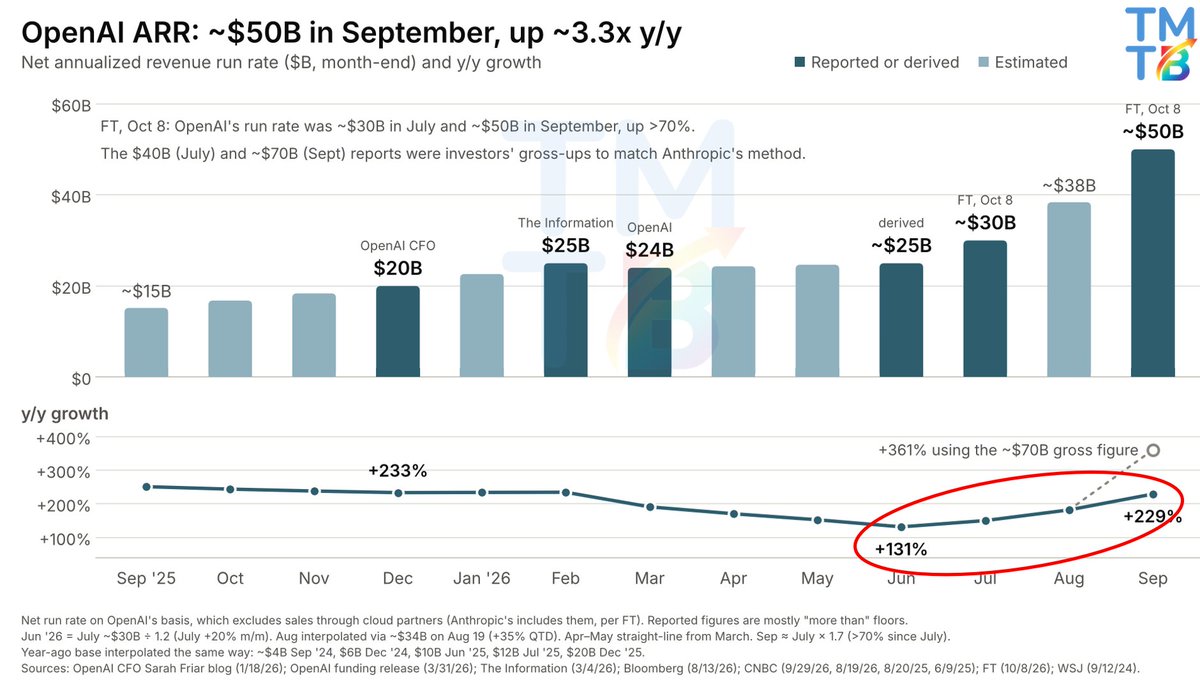
Glass half empty: People had thought $70B was net and the perceived dollar base just reset ~25–30% lower. OpenAI added ~$20B of ARR over August and September, not ~$30B. The first half was also weaker than people thought. The net run rate sat at ~$24–25B from February through June, and y/y growth slid to ~130% y/y by June, a bit decel from Dec 2025. That’s a lower starting point for YE26/YE27 net ARR targets & for valuation, and for the math on funding OAI’s compute commitments.
Glass half full: The growth rate hasn’t changed. $30B → $50B net is the same ~70% in two months as $40B → $70B gross, and the monthly additions picked up into September. The y/y line bottoms at +131% in June, then climbs to +150% in July, +182% in August and +229% (~3.3x) in September. Had July really been $40B, September’s $50B would have meant y/y growth flat at ~230%. On the net base, it’s actually sharp re-acceleration of ~100% y/y in 4 months. Against Anthropic nothing changes, because the ~$70B gross figure is still the like-for-like comparison.
We believe HBM-related strength should also be accretive to MU's margins as HBM commands a much higher premium compared to traditional DRAM (DBe HBM ASPs are ≥5x greater than conventional DRAM). HBM offers significant performance improvements vs. standard DRAM, which drives pricing substantially higher, more-than-offsetting the higher manufacturing costs associated with a more complex and silicon-intensive technology. The net result is a significantly stronger GM profile. As per our estimates, MU's HBM GMs currently stand in the ~60% range, while non-HBM GMs stand at ~35%. However, there is downside risk to these estimates depending on competitor product qualifications (increased competition diminishes individual vendor pricing power, resulting in GM headwinds).
Due to its 3D architecture and larger die size, HBM typically consumes 3-4x more silicon during the manufacturing process as compared to standard DRAM (i.e., HBM requires much more wafer capacity to produce the same amount of bits). This is conceptually understood as the "HBM trade ratio" and is particularly important because it grows larger with each new generation of HBM technology (e.g., as customers transition from HBM3E to HBM4, the trade ratio rises from 3:1 to ~4:1). This gives rise to two outcomes: (1) tighter supply for standard DRAM, which results in favorable pricing for products that account for more than ≥50% of MU's revenues (DBe), and (2) a higher floor for DRAM utilization, which results in improved profitability via higher fixed-cost absorption.
Helix 02 is Figure’s most capable humanoid model yet
Today we posted a long form write-up on the site, read more about it here: https://t.co/y7qcqyvr8t
$SNDK $NVDA REVISED NAND DC BOM: Under a 1 GW AI data center build costing $50B, the Bernstein Research framework for a $35B “1 GW” build can be rescaled to provide a reasonable first-order capex structure: approximately 39% of total capex is directed to GPUs ($19.5B), 13% to networking equipment such as switches and optics ($6.5B), 10% to power distribution including transformers, switchgear and UPS systems ($5.0B), 4% to thermal management and cooling ($2.0B), and 10% to land and buildings ($5.0B), leaving the remaining 24% or $12.0B for other IT hardware and site infrastructure. To tie these system-level percentages to a component-level bill of materials, J.P. Morgan’s AI server analysis of an 8×H100 system with a total server BOM of roughly $240K is used, in which the GPU complex accounts for 83% of the server BOM, CPUs 9%, DRAM DIMMs 2%, NAND-based SSD storage 3%, and other server elements (NICs, chassis, PSUs, backplane, labor, markup, etc.) 3%. Combining Bernstein’s estimate that GPU vendors capture 39% of total data center capex with J.P. Morgan’s finding that GPUs are 83% of server BOM implies that AI compute servers in aggregate (GPUs plus their surrounding server hardware) represent about 46.9% of the $50B, or $23.44B. Within this $23.44B server pool, the implied dollar allocations are: GPUs $19.50B, equal to 39.0% of total capex and 83.2% of server spend; CPUs $2.09B, equal to 4.18% of total capex and 8.9% of server spend; host DRAM $0.45B, equal to 0.90% of total capex and 1.9% of server spend; NAND-based SSDs $0.67B, equal to 1.33% of total capex and 2.8% of server spend; and other server components $0.74B, equal to 1.47% of total capex and 3.1% of server spend. The resulting top-down capex distribution for the full $50B build, consistent with these constraints, is therefore: AI servers $23.44B (46.9%), networking $6.50B (13.0%), power distribution $5.00B (10.0%), thermal management $2.00B (4.0%), land and buildings $5.00B (10.0%), and other infrastructure $8.06B (16.1%).
The next step is to isolate NAND-specific spending at the data center level rather than at the server level. The $0.67B attributed above to NAND-based SSDs represents the SSD hardware cost inside AI compute nodes only. AI and HPC operators typically also deploy separate storage tiers (scratch, training-data repositories, checkpoints, logs) whose cost is not fully captured by node-local SSDs; historical HPC procurement evidence suggests storage systems can account for roughly 10–15% of system contracts in traditional CPU-centric clusters, although this share has compressed materially in GPU-centric AI clusters. As a working assumption anchored in the observed shift toward GPU-heavy spending, a mid-case scenario is adopted in which stand-alone storage infrastructure (additional SSD shelves and storage servers beyond node-local drives) adds 50% incremental NAND spending relative to the NAND that resides inside AI nodes. Under this assumption, external NAND-backed storage contributes another $0.33B, equal to 0.67% of total capex, on top of the $0.67B of node-local SSDs. The resulting total NAND-based storage hardware outlay for the 1 GW, $50B data center is therefore approximately $1.00B, corresponding to 2.0% of total capex. A reasonable range, reflecting uncertainty about how aggressively a given 1 GW AI build provisions stand-alone NAND capacity, is roughly $0.83–1.33B of total NAND-based storage hardware, equal to 1.7–2.7% of the $50B budget.
Within that $1.00B of total SSD and storage-hardware spend, only part is the raw NAND silicon that SanDisk and its peers sell. Industry BOM analyses and SSD cost calculators consistently show that NAND flash is by far the largest material cost in an SSD, with NAND typically comprising on the order of 60–80% of the SSD BOM depending on capacity and design, while controllers, DRAM caches, packaging, firmware development and manufacturing overhead make up the remainder. Taking a 70% mid-point for raw NAND as a share of SSD cost implies that the $1.00B of total NAND-based storage hardware decomposes into roughly $0.70B of raw NAND chips (1.4% of total data center capex) and about $0.30B of controller, packaging, system integration and vendor margin (0.6% of total capex). Applying the range of total SSD spend discussed above yields a plausible band for raw NAND cost of approximately $0.50–0.93B, equal to 1.0–1.9% of the $50B build, with the central estimate at $0.70B or 1.4%. For comparison, Bernstein’s vendor-share analysis for 1 GW AI data centers indicates that memory suppliers as a whole (DRAM plus NAND) capture about 3–4% of total capex, or roughly $1.5–2.0B per $50B data center, which is broadly consistent with a memory split of approximately $1.0–1.3B to DRAM/HBM and $0.5–0.9B to NAND under the component-level breakdown above. Global memory revenue mixes showing DRAM at roughly $97B and NAND at $68B in 2024 (about 60% DRAM and 40% NAND of the combined memory market) further support the view that a $50B AI data center allocates low-single-digit percentages of capex to NAND.
On these numbers, and keeping the $50B total build constant, the impact of NAND price moves on overall project economics is small. Using the central estimate that total NAND-based storage hardware represents 2.0% of capex ($1.00B), a 50% increase in SSD pricing would raise aggregate capex by 1.0% or $0.50B, and a 100% increase would raise aggregate capex by 2.0% or $1.00B. If the focus is specifically on raw NAND chip pricing, using the 1.4% of capex ($0.70B) estimate, a 50% increase in NAND prices translates into only a 0.75% increase in total data center capex (an additional $0.38B), and a 100% increase in NAND prices lifts total capex by about 1.5% (an additional $0.70B). These sensitivities sit against a backdrop in which GPU, networking and power-infrastructure line items individually consume 10–40% of the budget and themselves exhibit significant price and lead-time volatility. Current market commentary from flash controller and SSD vendors indicates that NAND prices have already more than doubled over the past 6 months and that 2026 NAND output is effectively sold out, with further 10–30% or greater price increases expected into 2027 as suppliers restrict capacity additions. Taken together, the sharpened cost breakdown shows that, in a 1 GW, $50B AI data center, total NAND-based storage hardware likely represents roughly $0.8–1.3B or 1.7–2.7% of capex, with raw NAND content itself at approximately $0.5–0.9B or 1.0–1.9% of capex, while the largest capital line items remain GPUs (around $19.5B or 39%), the broader AI server complex ($23.4B or 46.9%), networking ($6.5B or 13%), power distribution ($5.0B or 10%), thermal management ($2.0B or 4%) and land and buildings ($5.0B or 10%).
The Non-Bubble that disappointed both Bulls and Bears -- how Sam's Splurge changed everything
The worst kept secret among Tech market participants — just something AI bulls don’t admit out loud: they want a price-action bubble every bit as much as the bears do.
Both want to see that steep, “blow-off” ascent that characterizes parabolic tops. Why? The AI bulls are all fully loaded for a vertical melt-up and AI bears want the aftermath so they can yell “I told you so.”
It’s obvious to AI bulls (us included) that we’re not in an AI bubble. The non-argument is simple: valuations are reasonable (NVDA near 20x), the equity risk premium is almost 300bps above where it troughed in the tech bubble, operating margins are rich, and we’re still very early in the demand/build out of the AI supercycle.
But bulls will typically follow this argument up by saying “‘it’s more like ‘97/’98.”
Implicit in that statement is that they’re hoping the inevitable outcome is a ‘97-’99 style ramp, with all hoping it would occur as soon as possible. Why? The simplest answer is usually the right one: everyone likes bigger bonuses as soon as possible.
Stated succinctly: the “AI bubble” ascent was the paradigm that both bulls and bears were operating under for most of this year, or longer.
Bad news for the AI bulls and bears: the past few weeks has brought an end to that paradigm and led us to an unexpected turning point in the dynamics of the AI trade/narrative. On the 3 year anniversary of ChatGPT’s release, no less.
And we have Sam’s $1.4T 30GW splurge to thank for it.
Sam’s Splurge (we’ll call it “SS”) opened up AI “pandora’s box,” shifting the AI narrative in unexpected ways.
First, the overarching discussion has shifted to a greater focus on OAI’s ability to monetize and what that means across the Tech ecosystem, from ad platforms to software/services companies to GPUs to infra hosting like ORCL. Despite the behemoth it already is, the market began to appreciate it was taking implicit bets on what is still a 3 year old start up industry/company.
Second, SS and connected deals brought more focus to the interconnectedness of the whole ecosystem, OAI’s outsized role in it, circular financing, and “too big too fail” discussions.
The interconnectedness of the AI ecosystem📷
Third, SS and his “Give us a few months and it’ll all make sense … We are not as crazy as it seems. There is a plan.” opened up discussions about government’s role in AI. While government intervention would help accelerate the AI buildout, it also opened a doorway of investor doubt. Reader CIO At CG expressed these opposite outcomes well in TMTB Chat:
“It’s bullish if/when it happens. But until it happens it creates doubt if it is gravy (more upside) or if it’s needed to execute the 1trn+ commitments. Any doubts on ability to execute the 1.4trn is just bearish sentiment vis-à-vis today. So Friar opened a door that was closed. And by opening it, it opened both the left and right side of the distribution. It also makes people realize that they are too big to fail: if they fail to execute they will bring the entire ecosystem multiple down. And hard.”
Fourth, the sheer scale of the SS $1.4T plan, which is nearly the size of the whole private credit market, nudged both public and private lenders to reprice AI-linked risk, most notably seen in the rise of Oracle and Coreweaves’ CDS spreads. At the same time, off-balance-sheet structures—e.g., Meta’s $27B Hyperion SPV with Blue Owl— didn’t help by concentrating risk with private creditors and muddying system-wide leverage mapping.
The ironic thing is, if SS would have been half the size, things would have continued to grind along, investors would have enjoyed the ‘27 and ‘28 visibility, maybe even building the energy for a large vertical ascent in price action. Instead, it had the opposite effect: pouring too much gasoline on the fire and drowning out the energy for a big move up.
Fifth — by locking in commitments eight years out, SS dragged the long-horizon AI debate into the present. Over the last few weeks I’ve heard an increasing amount of bulls give voice to risks they’ve been able to normally wave away over the first 3 years of the AI trade, in an unusual sign of humility. Some of the key existential questions that now feel more present in the discussion:
How does the grid support the post-’28/’29 buildouts and what about water, land use, and local pushback? We’ve already heard of local governments slowing DC buildouts, and this week the WSJ wrote how Bernie and others are dialing up scrutiny of Data CentersIf inference moves to phones/PCs/cars, how does that rebalance hyperscaler capex, useful life assumptions, and who captures value? What’s the risk of stranded assets if models plateau or workloads shift to cheaper/edge solutions?The AI catch-22 no bulls want to talk about: If enterprise agents and automation work as advertised, what’s the path for unemployment and wages? If white-collar unemployment rises, what happens to ad spend and consumer wallets — remembering that GOOGLE and META are cyclically exposed ad businesses at their core? How does the seep into their top line and capex trajectory? If AI models don’t deliver, do we get a capex hangover and productivity disappointment?All of this sits against a U.S. backdrop that’s still skeptical of AI — worried about job loss and asking for a slower, safer rollout — which can swing sentiment and policy quickly. Will the current administration still be as supportive of the AI rollout if sentiment and unemployment shift in a more negative direction?
These are issues that will be a lot more prominent in the next 3 years of the AI trade than they were in the first 3 years of the AI trade.
This all began to seep into the price action of AI stocks several weeks ago: ORCL giving back all of its “monster RPO” move and more, very speculative sectors like Nuclear/Quantum rolling over, and the AI ecosystem progressively rallying less and less on each Open AI deal that was announced.
It all culminated in the last two weeks. We can give thanks to some hawkish fed speak and Sam’s now infamous BG2 pod appearance for providing the spark needed to ignite the fire spreading. In a period of time where nothing has changed fundamentally in respects to the AI trade, the market began more heavily digesting the overarching effect of SS: more unknowns and more uncertainty in the minds of investors. After all, the market isn’t just a mechanism for discounting fundamentals and perceived risk, but also the current emotional state of participants. With belief shifting from inevitable euphoria (read: vertical ascent price action) to verification, SS has had the opposite effect of what Altman likely intended: more multiple compression and less belief in out year estimates.
With greater uncertainty, it’s no wonder certain pockets of the market have underperformed: names with perceived questionable business models / debt issues (ORCL, CRWV, NBIS, Miners, etc.), names with perceived AI top of funnel / structural issues (DUOL, MNDY), names with rising opex as the market is less confident in how long heightened spend will be here to stay (META).
It’s also no surprise that as the market digests these new developments, the profitability factor has outperformed while names with good narratives and fast growth but little in the way of valuation support have underperformed: NET, PLTR, SHOP, TSLA, U. This is also why memory has been so strong: EPS revisions are currently happening —> there’s nothing uncertain about opening up your favorite DRAM/NAND spot price checker, seeing how much DRAM/NAND has risen overnight, and plugging it into your model. These names are arguably more attractive in the current environment than they were before.
The market is currently doing what it always does after a narrative/paradigm shock: digest, recalibrate, reassign risk premia. NVDA EPS and Gemini 3 are the next events on the docket to absorb. We’re running low gross while we let the market do its thing, letting the overarching narrative/price action stabilize and become clearer.
@dylan522p at Semianalysis joked this week that time is now divided in BC (Before ChatGPT) and AD (After Da Launch of ChatGPT). We think the AI trade will eventually be divided between BSS (Before Sam’s Splurge) and ASS (After Sam’s Splurge). BSS and ASS.
Wait - that doesn’t have a nice a ring to it, so let’s say it differently. We think the straight-line giddy phase of the AI trade will give way to something healthier: a phase where fundamentals and idiosyncrasies matter even more. Tech will always be a narrative and boom and bust heavy investing sector (that’s part of the fun), but in a landscape where sentiment is more balanced, stock-picking will become more relevant. That’s a good thing.
SS popped the non-bubble. But the AI trade isn’t broken: it’s simply entering a more mature, scrutinized phase.
Designed for Helix, the home, and the world at scale, Figure 03 establishes the foundation for true general-purpose robotics. Read our detailed write-up:
https://t.co/tQgWizBuvg
📢 Jensen Huang brings good news from Beijing — #NVIDIA gets U.S. green light to restart #H20 sales in China. #Samsung, the top HBM3 supplier, is set to cash in.💡More: https://t.co/ykYiQH4zED 🔗