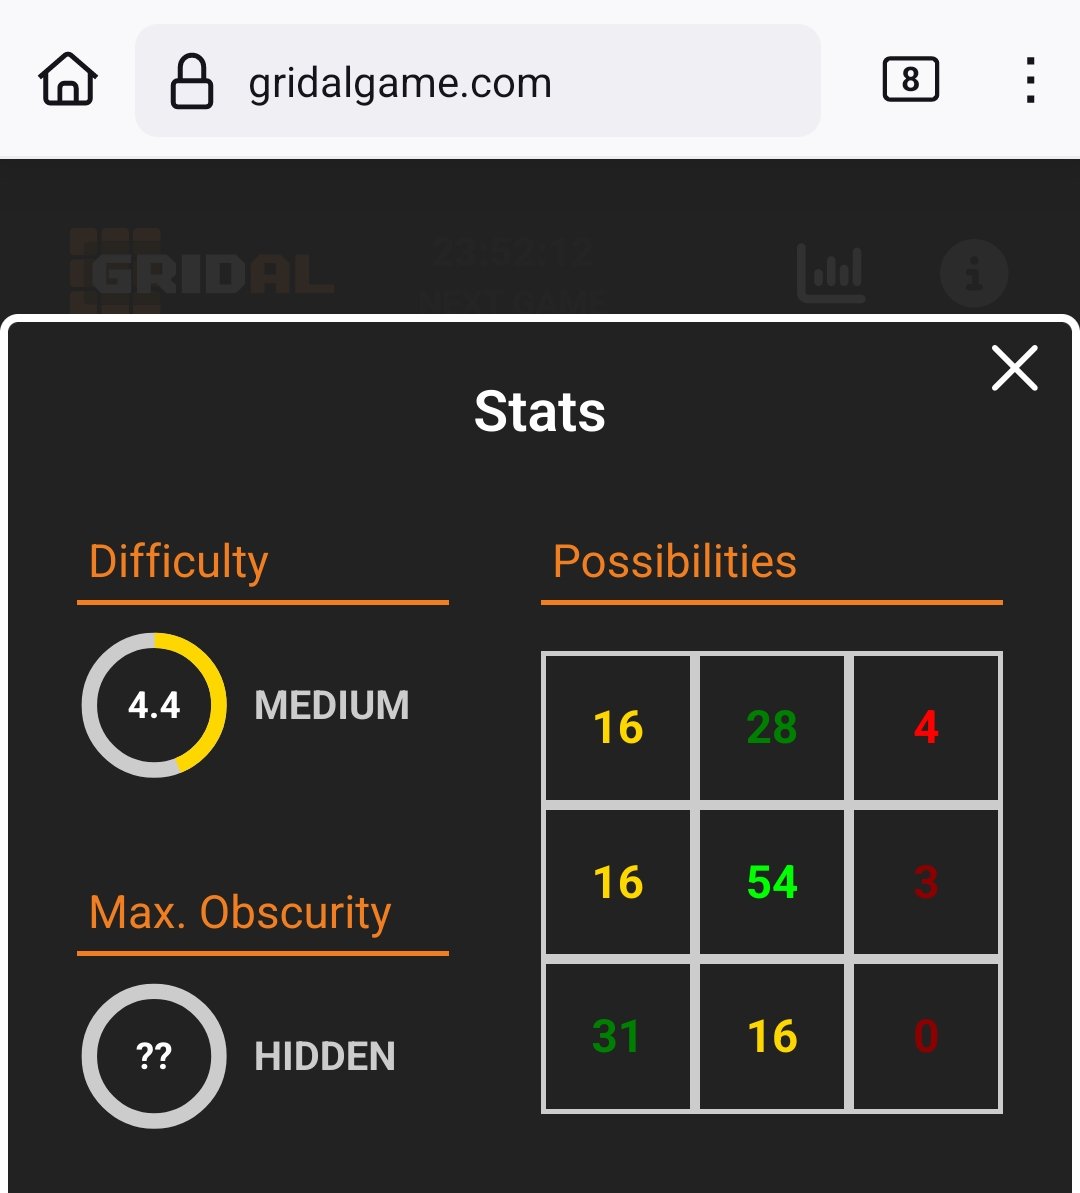
I built a @streamlit app to demonstrate the folly of drawing broad-brush conclusions from single match xG aggregations (the kinds that tend to get lots of traffic on social media):
https://t.co/8p2cGDNtNR
@AndyHowe_statto@aleaguemen Has there been a material increase in injury time minutes this season, noting this appears to be a thing in many leagues globally since the 2022 World Cup? And if so, does the record still look close on a per minute/hour basis as opposed to per game?
@Hirald0@VinceRugari Tilio is the former holder of the record as it's now Gauchi - "former" isn't being used in the former/latter sense between Robertson and Tilio. 🌝
@safreireleo@SimonGleave Thanks Leo, it's nothing too crazy, just a Monte Carlo simulation of each shot attempted assuming chances are independent and identically distributed. Which is a bold assumption in some cases e.g. missed pen but score rebound.
You can see the code here:
https://t.co/mFbQkmj7ut
@PawarBI 1. Calculate moving averages in DAX to smooth trend lines.
2. Facet into small multiples.
3. Filter out categories that aren't important, or aggregate into fewer categories.
4. Apply subtle light grey colour to all but 2-3 key lines.
5. y logscale to compare growth, not absolute.
Growing chatter about generative analytics seems to mostly be about how well text-to-SQL/chart/report will work. Idk the answer but I'm pretty sure it's the wrong question. If today's charts/reports/queries generally do not create significant value, why would more of them?
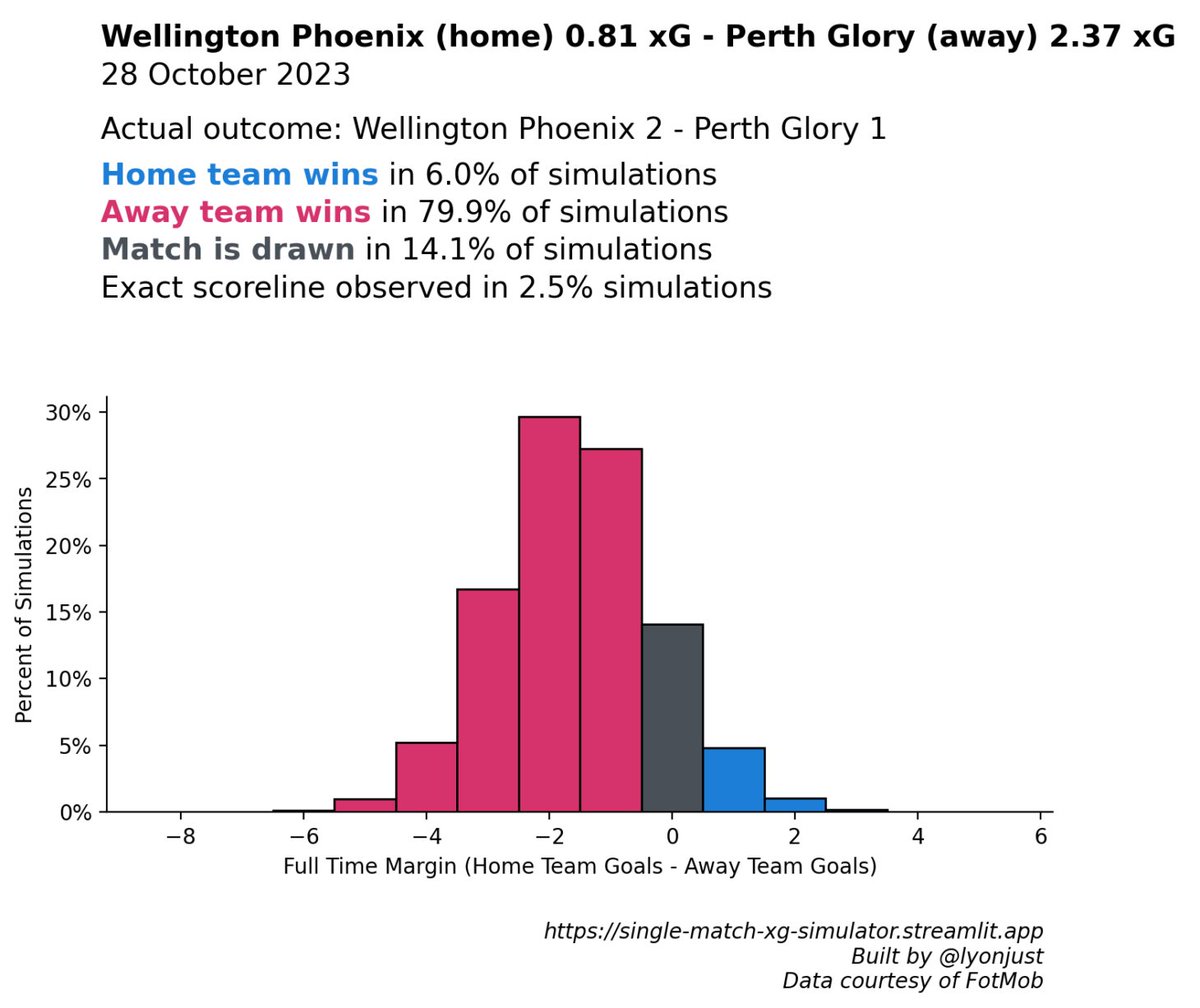
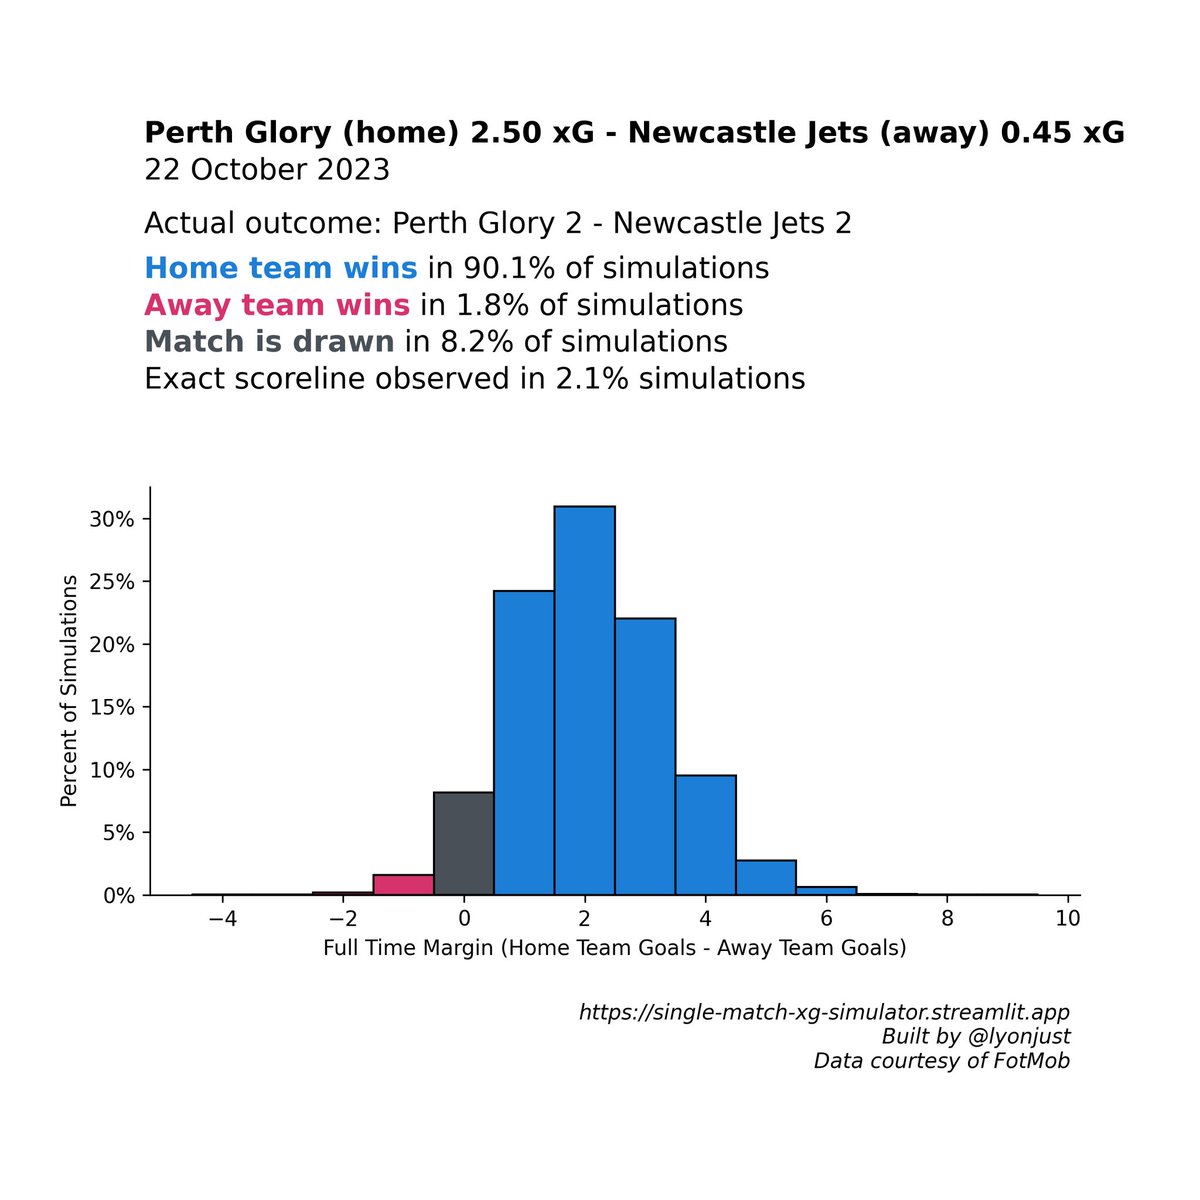
@ALeague_xG Perth stitched up by the xG gods again. Did enough to win this game 8 times out of 10. Dropped points last week when they get the chocolates 9/10 times.
#WELvPER