@Ausproperty95@freddjohns U went to the tier 1 cities, yes those two are clean, efficient and modern but china is massive and there are a lot of dirt poor places further west
Leaders that will continue higher that you should be targeting on any mild weakness into end of May
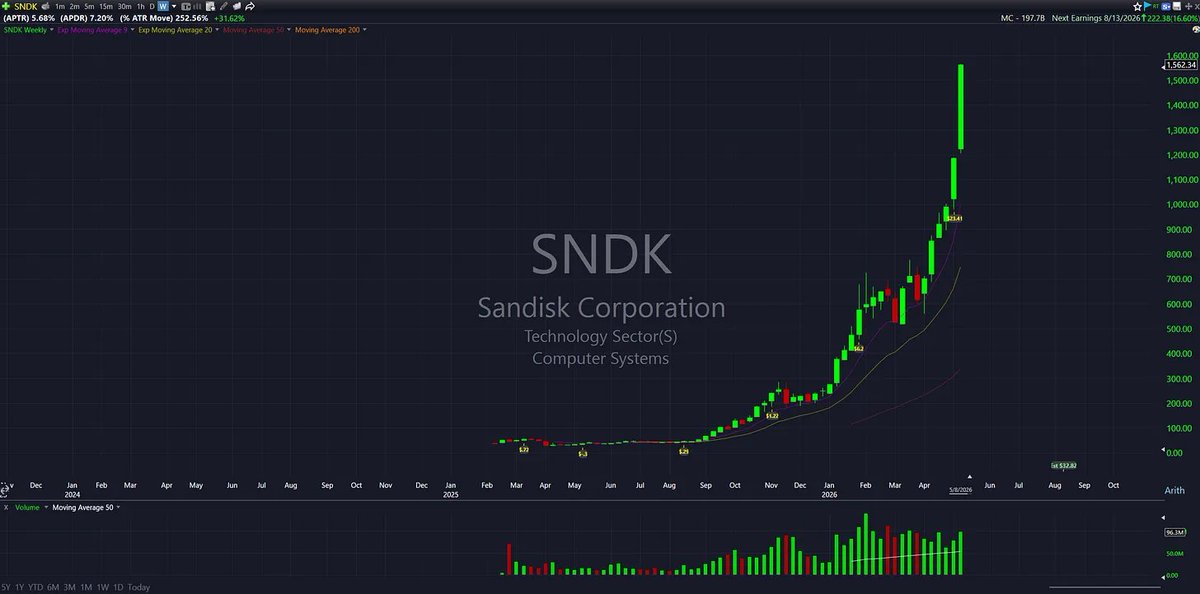
$SNDK
$MU
$INTC
$AMD
$NBIS
$BE
$GLW
$RKLB
$AAOI (smaller but best still liquid)
$ARM
Many others but these still have juice in the tank, end of summer minimum
$TSLA here we go...
If you're looking for the next opportunity to make serious money this summer, this could be it.
$TSLA is officially breaking out of a massive downtrend and is starting to look ready for a move to new all-time highs.
The plan is simple:
Build swing positions between $430 and $450
Add aggressively through $450
The window of opportunity is open this week for parabolic reversals in $SNDK $MU and solana:JCEmtMhYCuijq6t3bXbZeyr4566RYmsLaSdr6pYd79Rt
Let's see if this post is more hated than the parabolic short write-up I did on Silver in late January....
Jokes aside, I wanted to share my thoughts as I have during parabolic moves over the years with stuff like $SMCI $NVDA $MSTR $SLV $GLD $KORU $CAR etc, especially if I can help someone who is riding a large unrealized gain take advantage and trim into these parabolic extensions.
Early last week, I shared a screenshot of a spreadsheet I had saved from a study I did on the specific extension metrics in which many historic parabolic moves peaked. I also noted that it was too early to short the semiconductors as that they had not filled out the criteria required for a parabolic short.
Below is the same spreadsheet, but included is $SNDK $MU and solana:JCEmtMhYCuijq6t3bXbZeyr4566RYmsLaSdr6pYd79Rt updated with their extensions as of Friday's close. The green highlighted boxes represent above the average in which all the study examples peaked at.
As you can see they are not all quite above average yet, but any continued hype and momentum early this week and all three of these names will very likely be in play.
One characteristic that is extremely important when identifying a parabolic advance is consecutive weeks of range expansion. We recently saw this with Silver in January when it put together 3 consecutive weeks of range expansion before it's climax, as well as many more classic, model book examples throughout the years.
Consecutive weeks of range expansion signal exponential price progression, a hallmark of parabolic curves. It is a week by week build up into a climactic reversal. The cherry on top is a signifigant range expansion week on the 3rd or 4th week of the burst, which is typically the final week of the move.
Here are the last 3-4 weeks of percentage gains for these names:
$SNDK
Week 1 (+7.48%)
Week 2 (+19.91%)
Week 3 (+31.62%)
$MU
Week 1 (+8.20%)
Week 2 (+9.15%)
Week 3 (+9.16%)
Week 4 (+37.73%)
solana:JCEmtMhYCuijq6t3bXbZeyr4566RYmsLaSdr6pYd79Rt
Week 1 (+9.81%)
Week 2 (+20.50%)
Week 3 (+20.69%)
Week 4 (+25.40%)
Textbook parabolic price progression over consecutive weeks on all three of them.
After that final 3rd or 4th week of signifigant range expansion, you then look for a similar parabolic burst on the daily timeframe. $SNDK $MU and solana:JCEmtMhYCuijq6t3bXbZeyr4566RYmsLaSdr6pYd79Rt all closed down on Thursday, before exploding higher on Friday. Need at least 1-2 more large, consecutive days higher for these to trigger a climactic reversal.
We also witnessed what felt like complete upside panic and FOMO in the leading semiconductors on Friday. One example being the news that hit at 1pm stating that Apple and Intel reached a preliminary chip-making agreement, which led to a near +13% gain in just 20 minutes...
Moments after that headline, Trump said "Go and buy a Dell", which sent $DELL soaring an entire 200% ATR move in just 30 minutes.
This is typically the type of price action and hype you see during the final stage of a parabolic burst. Not to mention the absurd volume of options being traded on these names as we approach May OPEX this Friday...
To close this out, we also have the $QQQ at 9.91 ATR multiples above the 50-day moving average as of Fridays close, a level of extension never before seen since its inception in March of 1999. I have no doubt this market can continue higher this year, but this print only helps add conviction to the names potentially setting up for a opportunity into this week.
To clarify, the parabolic short is an extraordinarily high-probability mean reversion opportunity, that can sometimes lead to secular tops, but not always. I have no clue where these stocks will be a month or a year from now, but I know my setups when I see them.
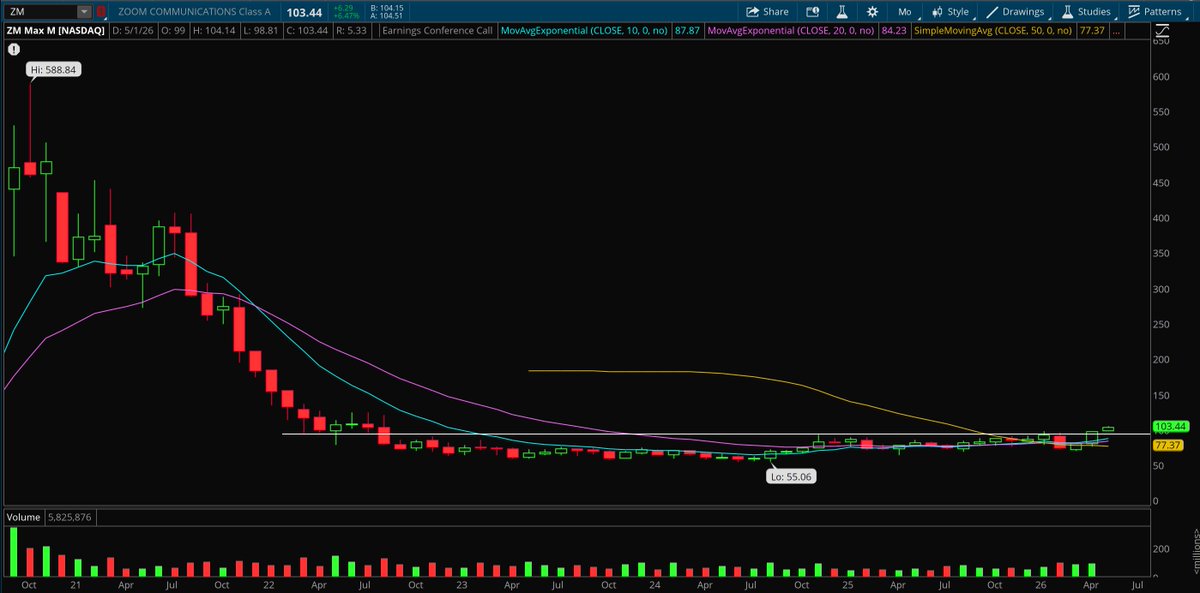
$ZM
This is a monster base.
- 2021 winners such as $TWLO $ROKU breaking out
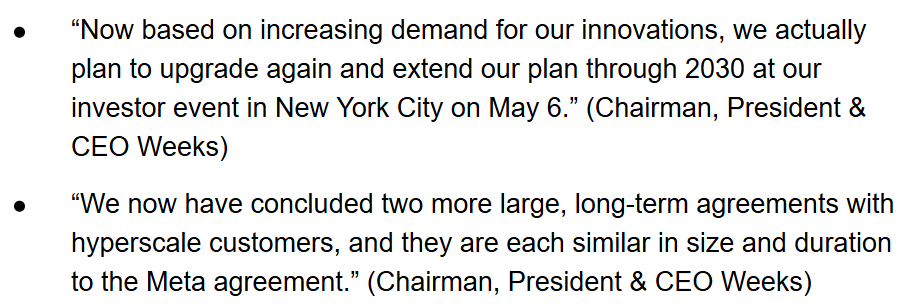
- Sizable Anthropic stake
- $2B in FCF
- $8B in cash
- 0 debt
The bigger the base, the higher in space they say.
Doesn’t get much bigger than this.
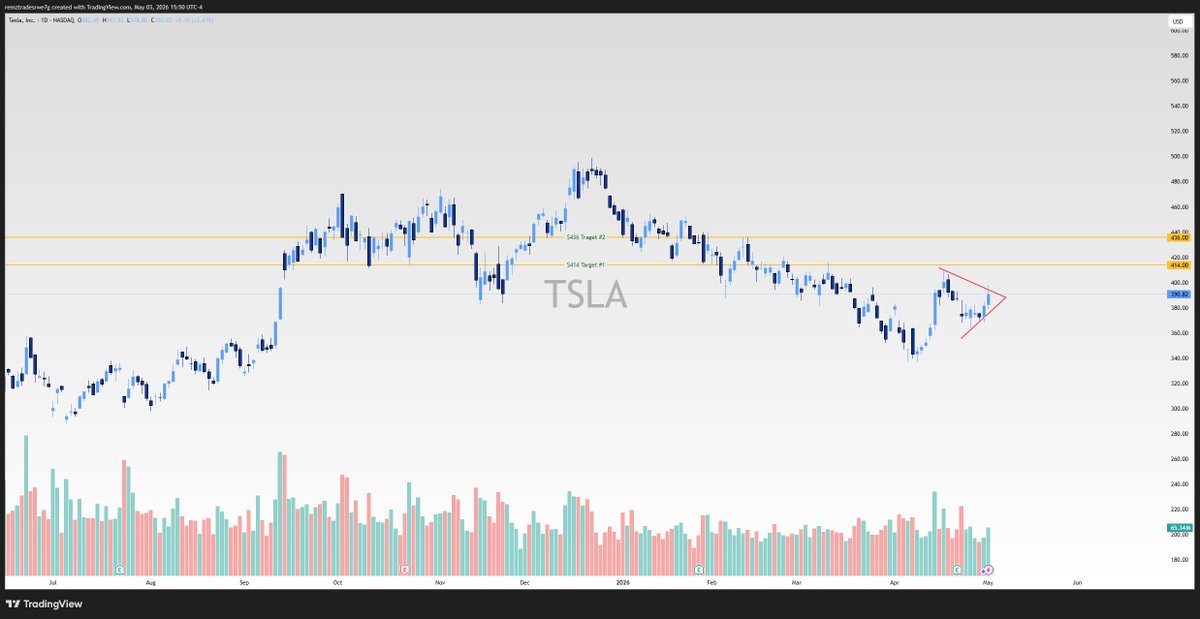
$TSLA
I probably wouldn't want to miss this if i were you
One of the biggest laggards this rally, yet one of the cleanest charts setting up right now. Here’s the breakdown
Not only is $TSLA approaching $400, but $402 lines up with the 200D SMA. That kind of confluence doesn’t come often.
Major psychological level right into a key technical level
Wouldn’t be surprised to see this push toward $430 very quickly once that breaks
$414 is the first target, previous ATH
$436, then $450+ next.
$500+ this year is absolutely in play for $TSLA