2010: 1 $BTC ≈ 1 day of work
2013: 1 $BTC ≈ 6 days of work
2016: 1 $BTC ≈ 16 days of work
2019: 1 $BTC ≈ 2.4 months of work
2022: 1 $BTC ≈ 7.5 months of work
2023: 1 $BTC ≈ 9 months of work
2026: 1 $BTC ≈ 1–1.5 years of work
2029: 1 $BTC ≈ …Show more
Another massive piece of confluence.
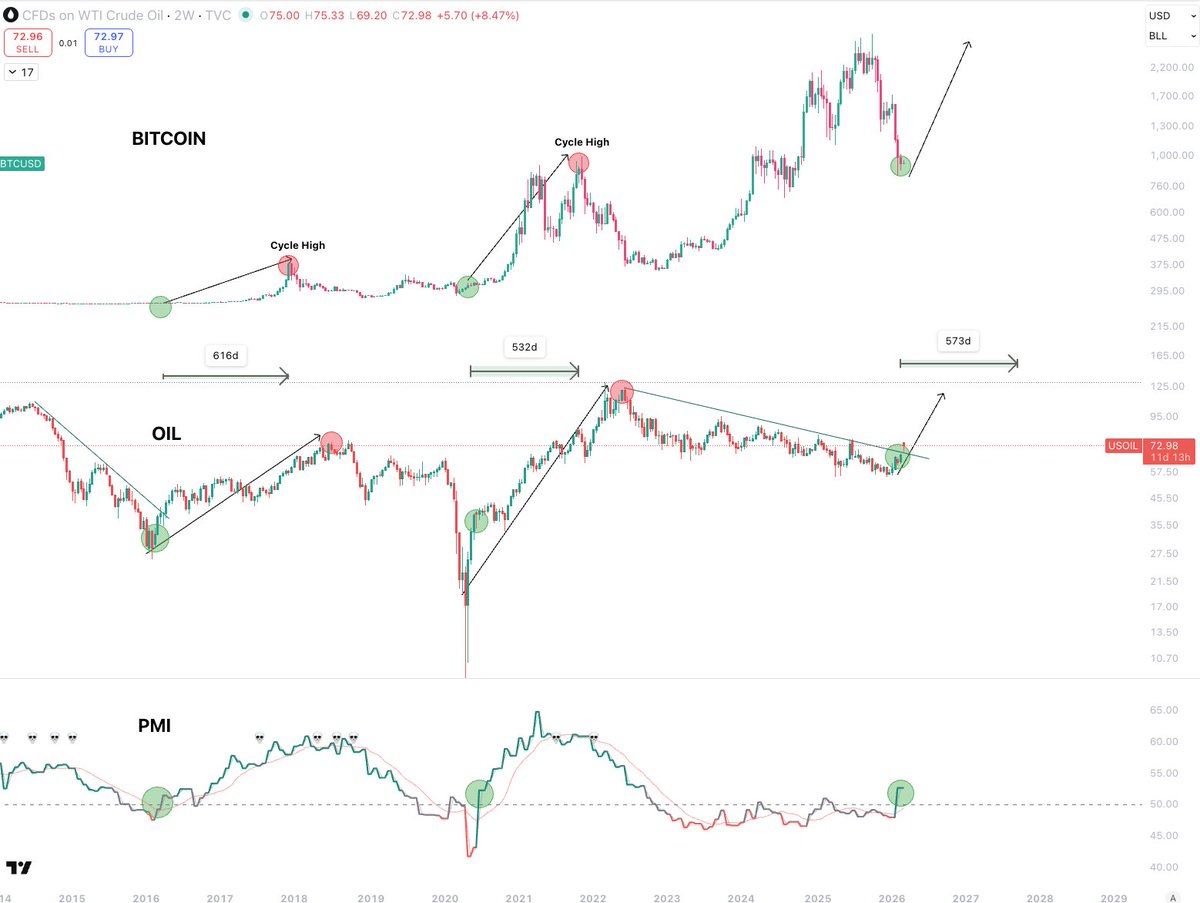
OIL just gapped up 11%... the largest gap ever, and broke its almost 4 year downtrend.
And when we compare Bitcoin, OIL, and PMI, we see a striking correlation.
They all move in absolute lock step.
It is not a surprise that OIL performs well in times of ISM/economic expansion.
And I just don't understand why everyone is fading it so hard.
All the pieces of the puzzle are forming into their places at the exact same time.
We can see here that in the previous cycles, when OIL breaks out its trend, Bitcoin has pushed for 500 - 600 days.
And OIL continues to push the whole time ISM is in expansion.
Look at the red circles... they are cycle highs.
Does that look like where we are?
Or does it look like we are at the green circles?
Its very clear.
Are you really going to try and kid yourself over and over that OIL just had its longest consolidation ever, and so did ISM?
Every single one of these broad macro charts is saying the same thing to you.
And yet, the majority just ignore them and think "$30k soon".
I literally just chart these things... i have no control over how it looks.
I have no bias, it simply is what it is.
And all it says it that its all going much higher.
I am just the messenger.
THIS IS NOT A NORMAL BTC CYCLE
Bitcoin made an ATH before the halving, which breaks the whole model.
The timing shifts to 700-800 days.
That puts the bottom in July-August.
Buying now = buying at $22K last cycle.
🚨 THIS IS THE MOST IMPORTANT ANNOUNCEMENT OF 2026
🇺🇸 PRESIDENT TRUMP JUST CONFIRMED CRYPTO MARKET STRUCTURE BILL IS READY AND WILL PASS SOON
IT WILL INJECT TRILLIONS INTO THE MARKET AND REDUCE MANIPULATION IN CRYPTO
THIS IS MASSIVE FOR CRYPTO !👀
BTC.D REPEATING EXACT SAME PLAYBOOK FROM 2018 AND 2021
BACK THEN, LIQUIDITY ROTATED FROM BITCOIN INTO ALTCOINS
THEY GREATLY OUTPERFORMED $BTC AND PUMPED 150-200X
ARE YOU READY FOR ALTSEASON 3.0?
THE TRUTH NOBODY WANTS TO HEAR
Market is showing artificial strength.
You see green candles and feel relief.
This is a temporary reaction to low volume.
I’ve been tracking institutional liquidity for months…
HERE IS WHAT’S ACTUALLY HAPPENING:
Recent price increase is a mechanical bounce.
Nothing more.
Mainstream analysts call it a new bull cycle.
They are looking at price action.
I am looking at capital flows.
Capital is leaving the system.
This isn't a recovery. It’s a distribution phase.
Nobody is talking about this…
Large players aren't buying this move. They are selling into it.
They are moving to cash while retail traders buy a 15% jump.
WHY THIS MATTERS:
– Global credit spreads are widening despite price growth.
– Corporate defaults in tech sector are at 4–year high.
– Bitcoin volume is decreasing while price stays stagnant.
We’ve seen this before.
Remember 2001. Remember 2008.
Periods of low volatility often precede major drops.
SCENARIO LADDER:
– If base case: A 6–month period of declining prices and low activity.
– If stress case: A sudden crash triggered by high leverage liquidations.
– If break case: A total loss of liquidity where buyers disappear entirely.
This is how wealth transfers happen.
META–INSIGHT
Goal isn't to guess price.
Goal is to have cash when others are forced to sell.
Pay close attention.
I’m warning you now.
I post for 1% who listen.
I’ve spent years identifying these patterns.
If you haven't followed me yet, you're operating without data.
A lot of people will regret missing this warning.
Alt Season indicators are Lighting Up.
Clear Breakout of a multi-year falling wedge on dominance.
Weekly MACD shifts like this are structural and happen before massive rallies like 2021.
The market's starting to price in Clarity:
Trillions flooding into high-quality alts - ISO, RWA, DeFi - not memes, and apparently not BTC.
The few of us left are about to get another shot at Generational Wealth - overnight.
My main thesis is that the markets have peaked in December '24 on #Bitcoin.
The thesis also holds that we're currently on the bottom of the bear market for #Bitcoin.
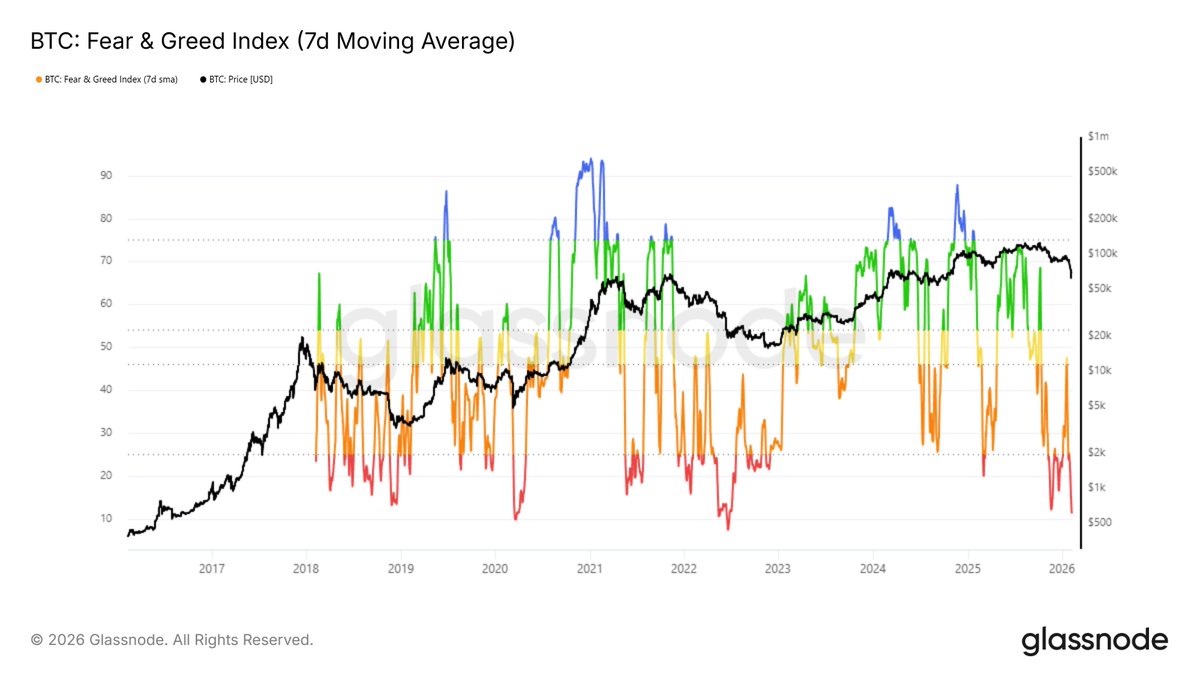
- The previous times we've hit this level on the fear & greed index were during COVID-19 crash and the Luna crash.
- As a result out of that, price has gone into a bull period after that and resulted into a gain of 1,800% and 900%.
These periods, when the fear & greed index hits such a low number.
That's when you need to step into the markets.
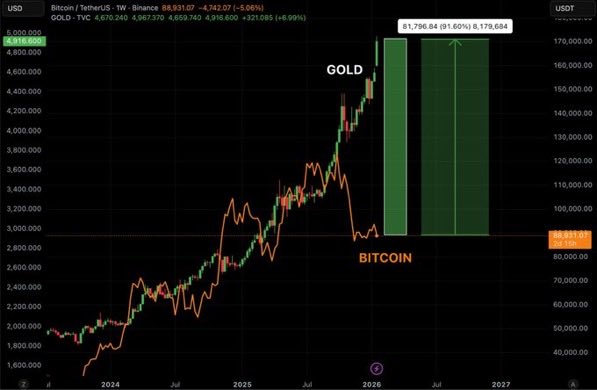
The price divergence between Gold and Bitcoin is insane.
The Crypto rebound is going to be unlike anything we've seen before - and it'll only take a fraction of what it took to move Gold where it is...
This cycle is proven: Gold Leads - Bitcoin Follows - Alts Outperform Everything.
Billionaire, Bill Miller IV just said Bitcoin likely bottomed last week and the Fed is flipping from draining $50B/month to injecting $40B/month.
Liquidity is about to shift and Trillions about to Rotate from Gold into Crypto.
Sentiment is at an all time low - it's almost time for Crypto to shock the World again.
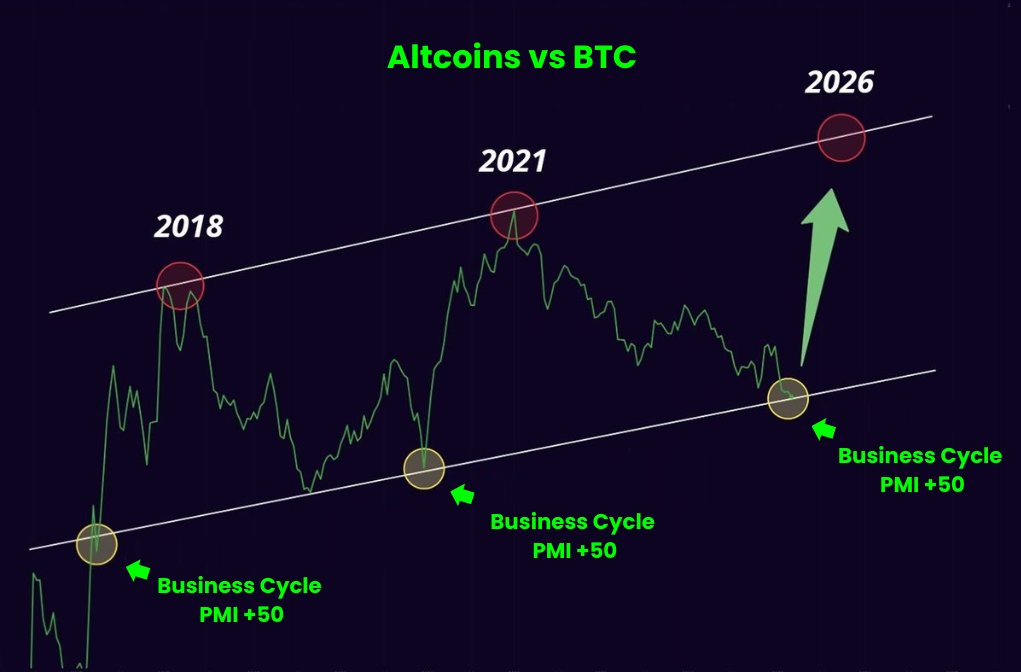
I don't think people understand how massive Alt Season 2026 is looking right now...
This pullback only magnifies the upside.
The key is Manufacturing PMI - and it just flipped back above 50.
First bullish print in ~4 years.
2016–2017:
Alts +1,000–4,000%
2020–2021:
Alts +800–3,000%
2026:
Lower entry.
Bigger move.
Rate cuts.
Regulatory clarity.
Liquidity returns.
While most disbelieve - the next wave of Crypto Millionaires do.
🚨 THIS CHART PREDICTED EVERY BITCOIN BOTTOM SINCE 2011
Bitcoin and macro cycles are heavily correlated, believe it or not.
Every time the business cycle bottoms and starts moving toward expansion → Bitcoin explodes with it.
The liquidity cycle isn’t even halfway done, and BTC is bleeding heavily.
As soon as the business cycle starts expanding, we can expect Bitcoin to start moving again.
Right now, we’re in the phase where most get shaken out.
Stick to your analysis and hold on to your positions.
Historically, you will win in the end.
If Bitcoin goes to $1.5M by 2035, entry price matters way less than people think
Math
$60k → $1.5M ≈ 43% CAGR
$100k → $1.5M ≈ 35% CAGR
$120k → $1.5M ≈ 33% CAGR
Over nearly a decade, a 2× difference in entry only changes returns by ~10% per year.
That surprises people.
When the outcome is 12×–25×, compounding overwhelms timing.
Bitcoin can swing 30–50% in a single year arguing over perfect entry inside that noise misses the point.
That’s why DCA works.
It’s not about buying “low.”
It’s about staying exposed long enough for the curve to do the work.
Deepest insight:
The biggest mistake isn’t buying too high.
It’s not being there at all.
READ THIS CAREFULLY.
Bitcoin’s next cycle bottom won’t be where you think.
The part most people ignore:
Timing.
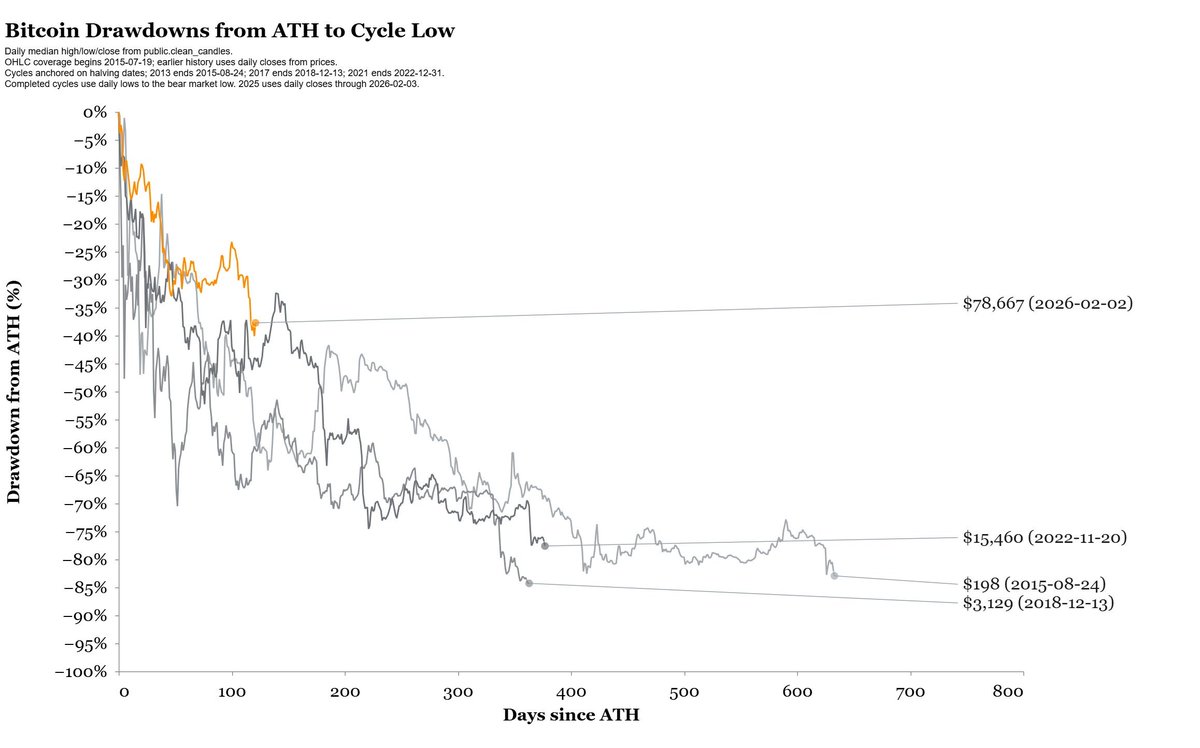
Days from all-time high → final low:
2012 — ~406 days
2016 — ~363 days
2020 — ~376 days
We haven’t reached that timing zone yet in this cycle.
Purely on historical timing, the highest-probability window for the real bottom is July–November 2026.
That matters more than any single number on your chart.
Most traders only operate on price:
“I’ll buy at X.”
But the zone that feels “safe” is usually the zone where people do nothing.
I don’t play that game.
Below $50,000 I’m a buyer. Regardless of when it happens.
July–November 2026 I’m a buyer. Regardless of price.
If either condition is met, I buy. No hesitation.
Yes, I started accumulating as soon as we entered the $60k range yesterday, even though the timing window isn’t here yet.
Yes. That also means lower is still very possible.
Back in October, when Bitcoin was around $120,000, I said I’d be a strong buyer near $60k.
People laughed.
Sentiment was euphoric.
“BTC will never see $100k again.”
Now we’re here.
Price thesis played out.
Time thesis is still pending.
There’s one more thing most people keep ignoring: NUPL.
Every generational bottom — 2018, COVID, 2022 — happened when NUPL entered the blue zone.
We’re not there yet.
That’s why a $40k–$50k Bitcoin by late 2026 wouldn’t surprise me at all.
That’s where I’d be comfortable getting extremely aggressive.
I’ve been in this market since 2013.
I’ve watched exchanges collapse and prices drop 99% in minutes.
A 50% drawdown isn’t chaos.
It’s normal.
Everything so far is playing out exactly how cycles usually do.
When I make my next move in the market, I’ll say it here publicly — like I always do — because I want you to win.
All you have to do is turn on notifications and pay close attention.
Many people will regret not following me sooner.
🚨 THEY'RE MANIPULATING BITCOIN AGAIN!
If you're really think $BTC went to $70K with no reason, you're completely WRONG.
Look at the flows.
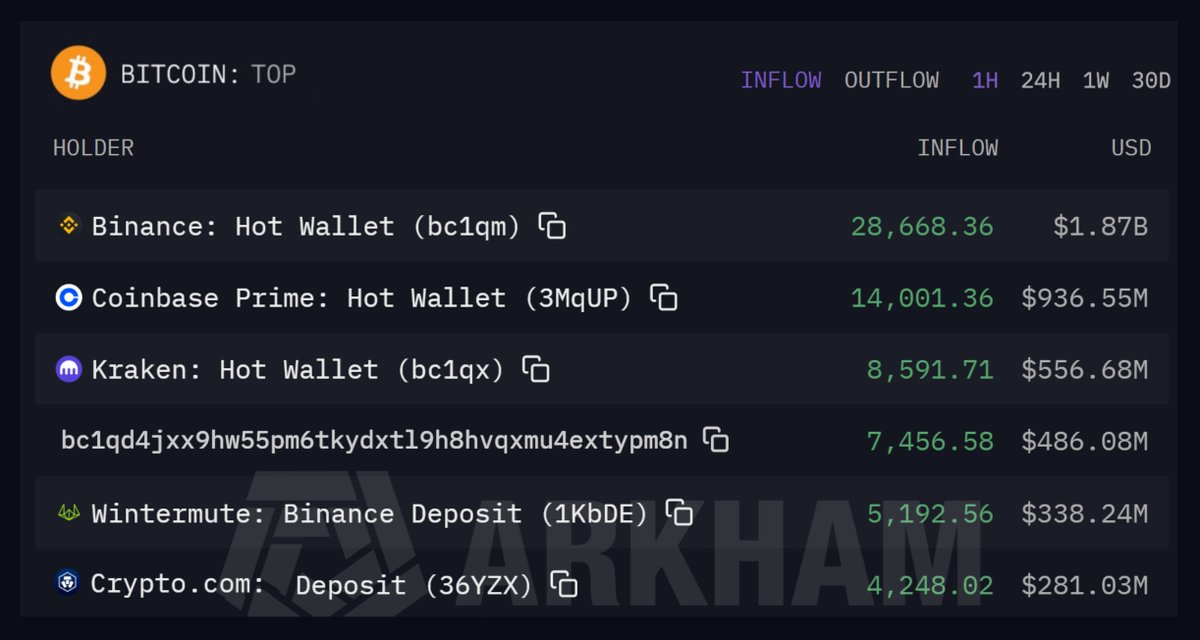
BINANCE BOUGHT 28,668 BTC
COINBASE PRIME BOUGHT 14,001 BTC
KRAKEN BOUGHT 8,591 BTC
INSIDER WALLET BOUGHT 7,456 BTC
WINTERMUTE BOUGHT 5,192 BTC
CRYPTOCOM BOUGHT 4,248 BTC
That's ~68,159 BTC, about ~$4.47B in just 1 HOUR.
Which pumped BTC to $70K
That's not "organic demand".
That's a coordinated inflow.
Let me explain this in simple words.
Everyone stares at the candles.
Nobody watches the only thing that matters.
WATCH THE FLOWS.
Liquidity is LOW.
So they can move price without tens of billions.
Now connect the dots.
They push price up fast.
Just enough to trigger FOMO.
Just enough to pull people into leverage.
THIS IS THE TRAP.
Then the moment leverage is stacked, they can flip the button anytime.
Price up fast → Shorts get liquidated → FOMO longs ape in → Then the dump comes.
That one fact explains a lot.
Because this is how they farm both sides.
They pump first to liquidate shorts.
They dump after to liquidate longs.
And they do it with no news because it's not about headlines.
It's about leverage + low liquidity.
I've studied macro for 10 years and I called almost every major market top, including the October BTC ATH.
Follow and turn notifications on.
I'll post the warning BEFORE it hits the headlines.
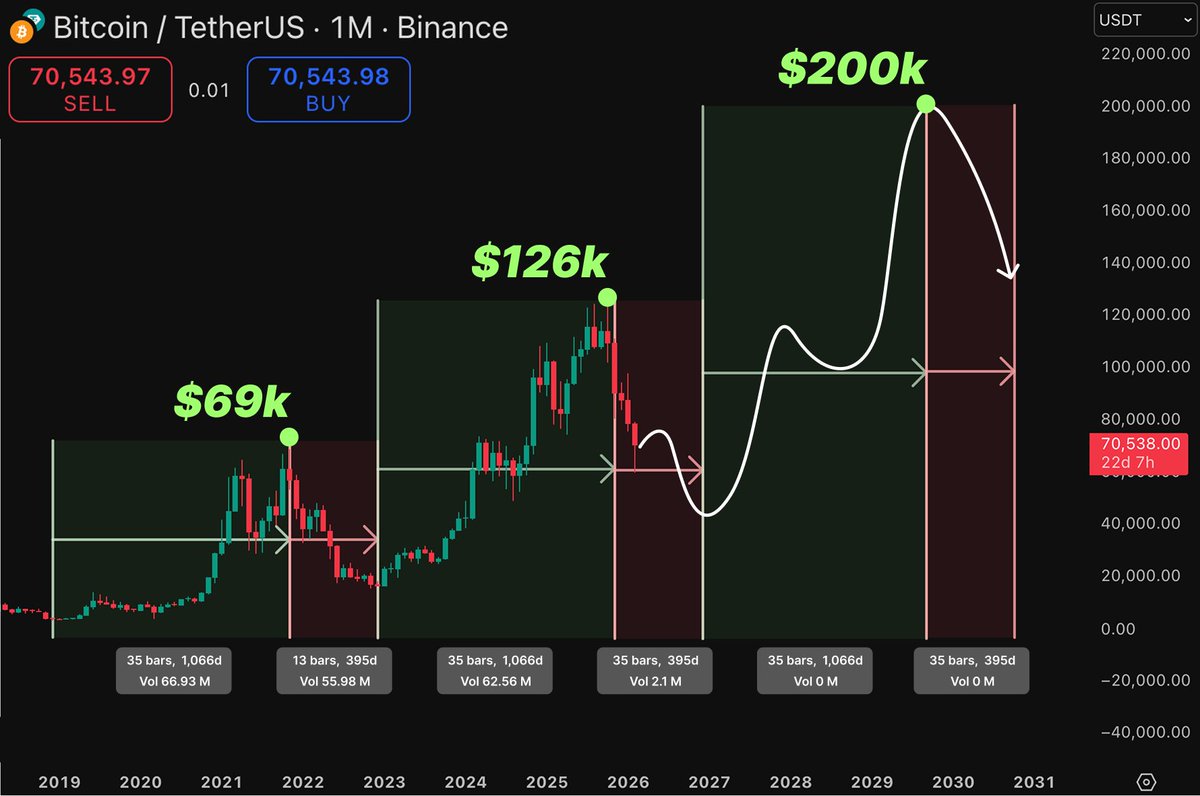
This cycle IS truly different.
Everyone likes to pretend its not, but it is undeniable at this stage.
- First cycle with ATH before halving
- First cycle with no true expansion on 2W BB
- First cycle with no 1M RSI expansion
- First cycle with no altcoin expansion
- First cycle with dominance at 60% at the end
- First cycle with no ATHs for TOTAL2, 3, and OTHERS
- First cycle that ends with BTC/GOLD at the lows
- First cycle with ATH with ISM in contraction
There are probably more, but you get the idea.
Unless, the cycle isn't actually over and what we have had is a mid cycle top?
Even after yesterdays events, i am still of the mind that we have a mid cycle top, now a mini bear phase on speed run, and more expansion this year.
After the 60k low yesterday, everything changes.
Now, truly, I am not sure how we move for the next month or so.
However, the 1M RSI has now tagged the same level RSI as the 2014 and 2018 bear market bottoms, and very close to 2022.
We also have to consider that this cycle we didnt truly expand, so to hit such a low level on the 1M RSI after not entering overbought on HTF, is a very deep move.
Even though my levels have been wrong and timing off, I cannot unsee this being a mid cycle top with new highs this year.
Assets will contract to whatever degree they have expanded.
Each previous bull market has been a true expansion, followed by a 75% to 85% drawdowns.
This one, however, is now at the same macro levels at a 50% drawdown...
Because it did not expand enough to warrant 75%.
This cycle has been truly different, and we need to look at it through a totally different lens now.
Where we are is still mirroring 2019/2020 so much more, even with the crash yesterday.
Next few months will be very interesting and i truly believe it will not be what the majority expect.
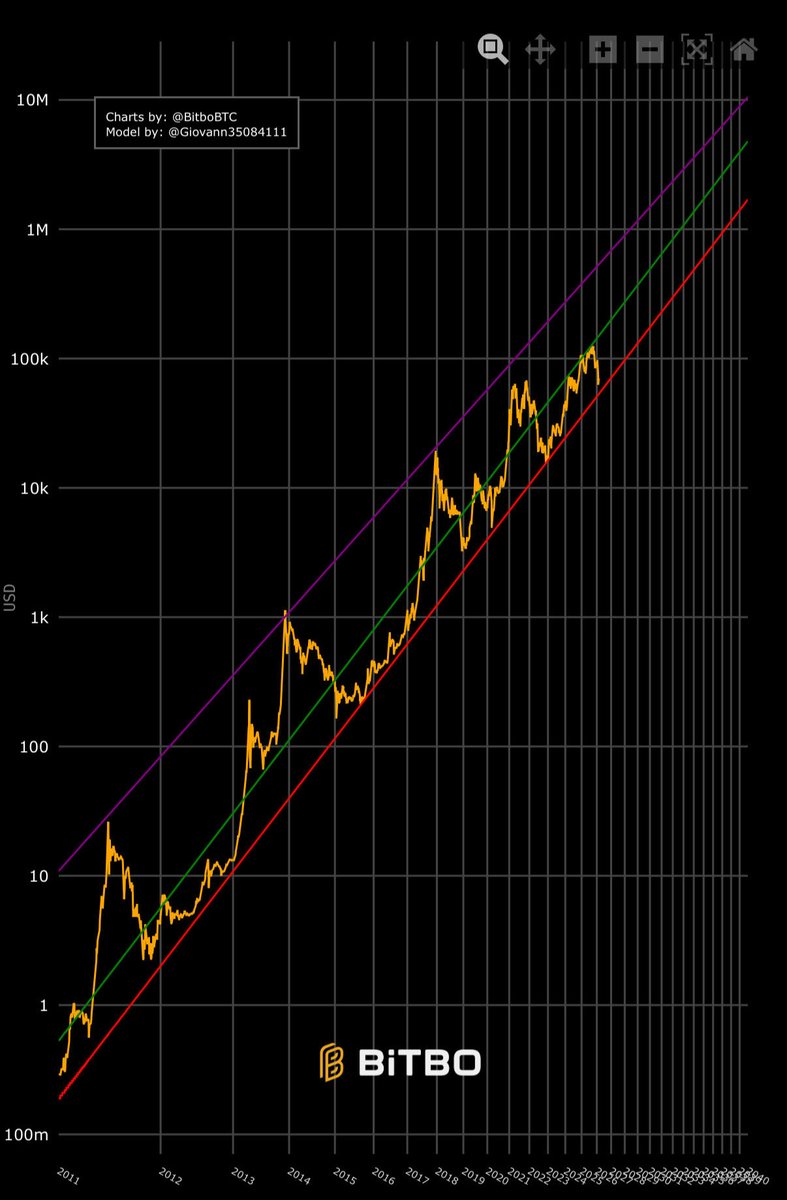
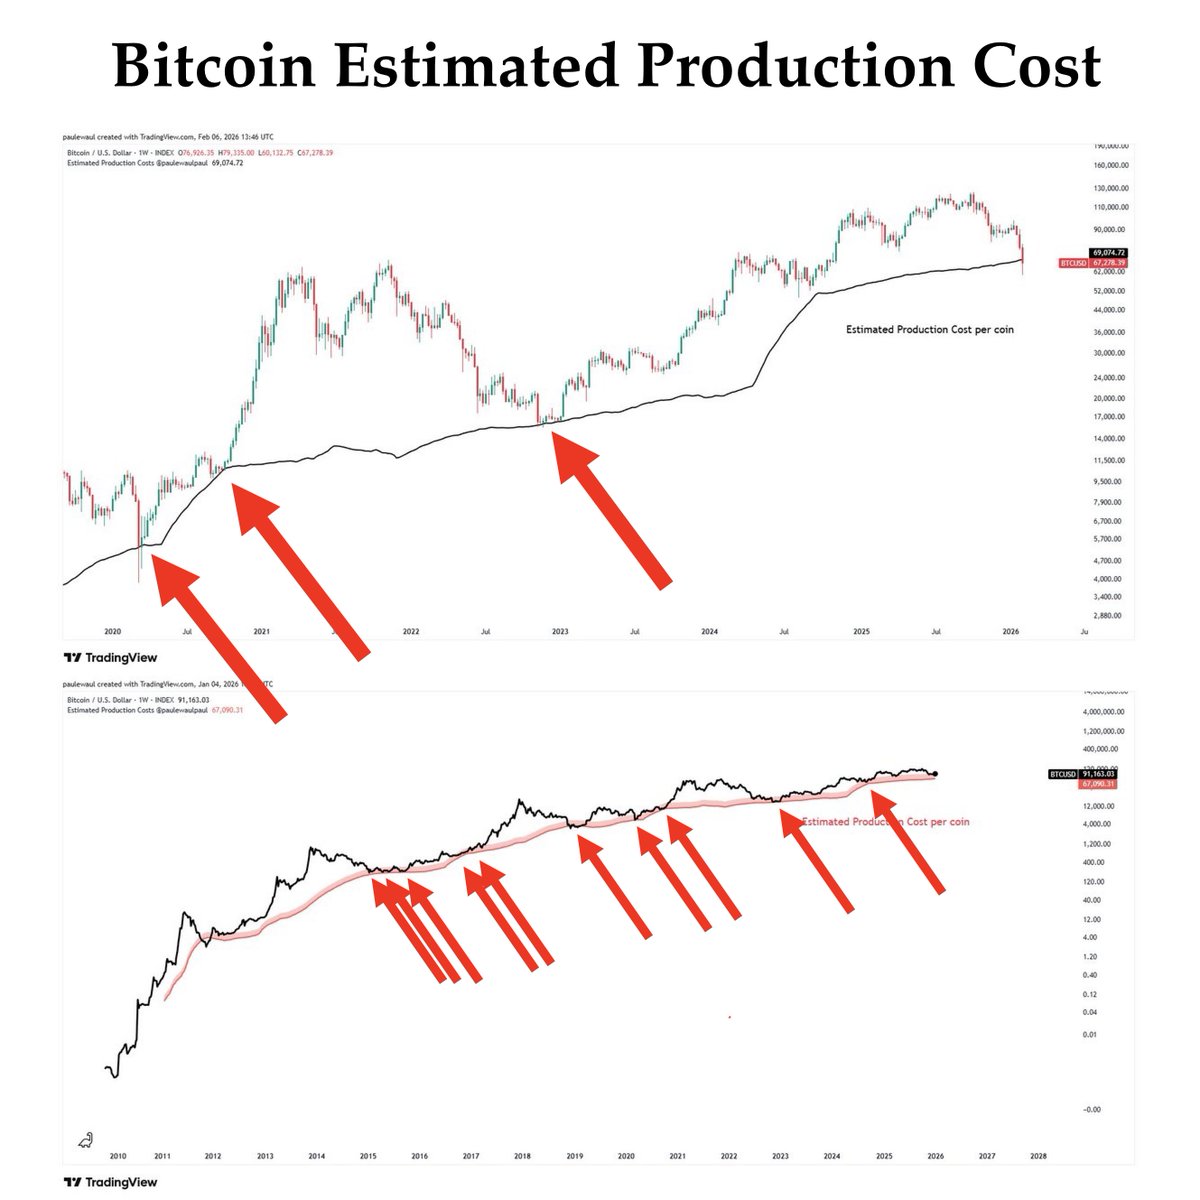
Important: One of the most significant Bitcoin charts you have most likely never seen!
Notice how many times Bitcoin has found support at this estimated cost of production red line.
The line currently sits at $67,000.
This is not just on-chain data—this is a cost of production model for Bitcoin, which is a commodity, and commodities almost never trade below their cost of production.
Shout out to (@)paulewaulpaul for creating this chart.
Make sure you give him a follow; he does unique and great work.
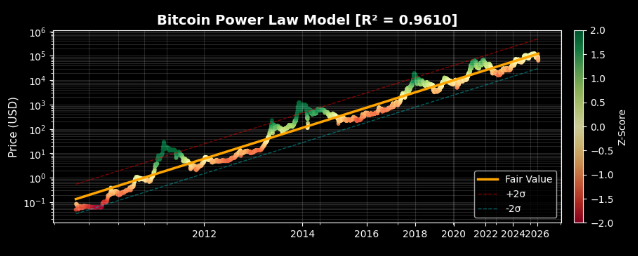
2013 déjà vu
🟢 Multiple rejections at the mid-line of the PL channel
❌ "Top is in" calls
🌊 Wave 5 breaks blue mid-line decisively
Target ⓹
$400k now - $500k EOY
Invalidation wave ⓹-(5)-5: < $31k
Implies wave ⓹-(5) is final --> BM since '09 starts correcting to ~④