Never miss a 10x trade like $SIVE, $NBIS, $AXTI, etc from Serenity again.
Use the @asymmetrix_xyz scanner to find the next stock that will go up 1,000%+.
It tracks all tickers posted by Serenity in real time.
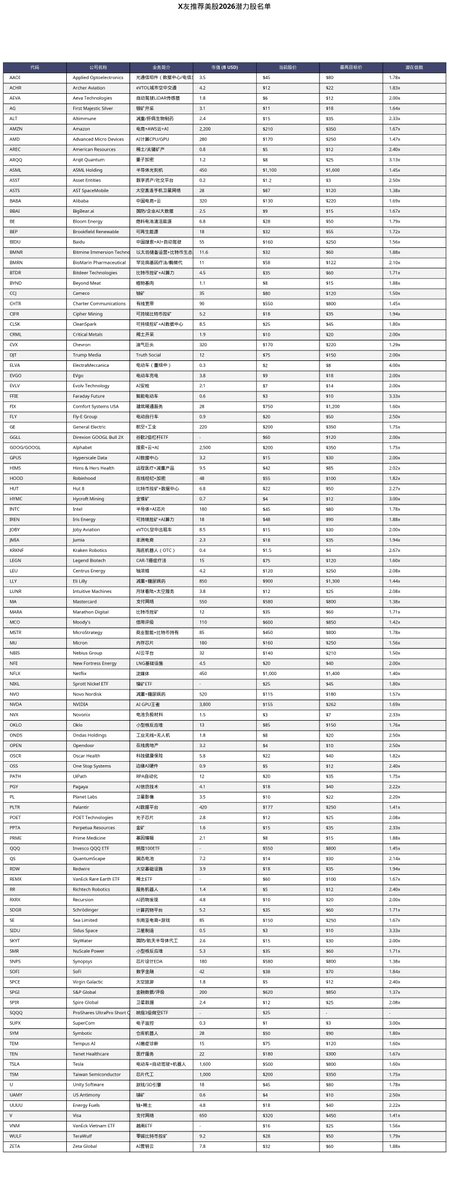
8 stocks to buy and hold for the next 10 years:
1. $CRDO
Near monopoly for Copper-AEC's in AI-Datacenters.
Expanding into photonics.
- Rev Fwd 2Yr: 63%
- FCF Margin: 27%
- EPS Fwd 2Yr: 286%
- NTM P/E: 36.7x
A sub-$1B market cap company is sitting at the intersection of nuclear, quantum, semiconductors, and medicine.
Using proprietary laser tech to enrich rare isotopes the world is desperate for.
Currently imported almost entirely from Russia and China.
Here it is:
It's 2035, you're a millionaire, you did exactly this in June 2026:
1. Open up a ROTH IRA (or tax-free savings account)
2. Buy stocks Trump is telling you to buy when he says it (not after it spikes)
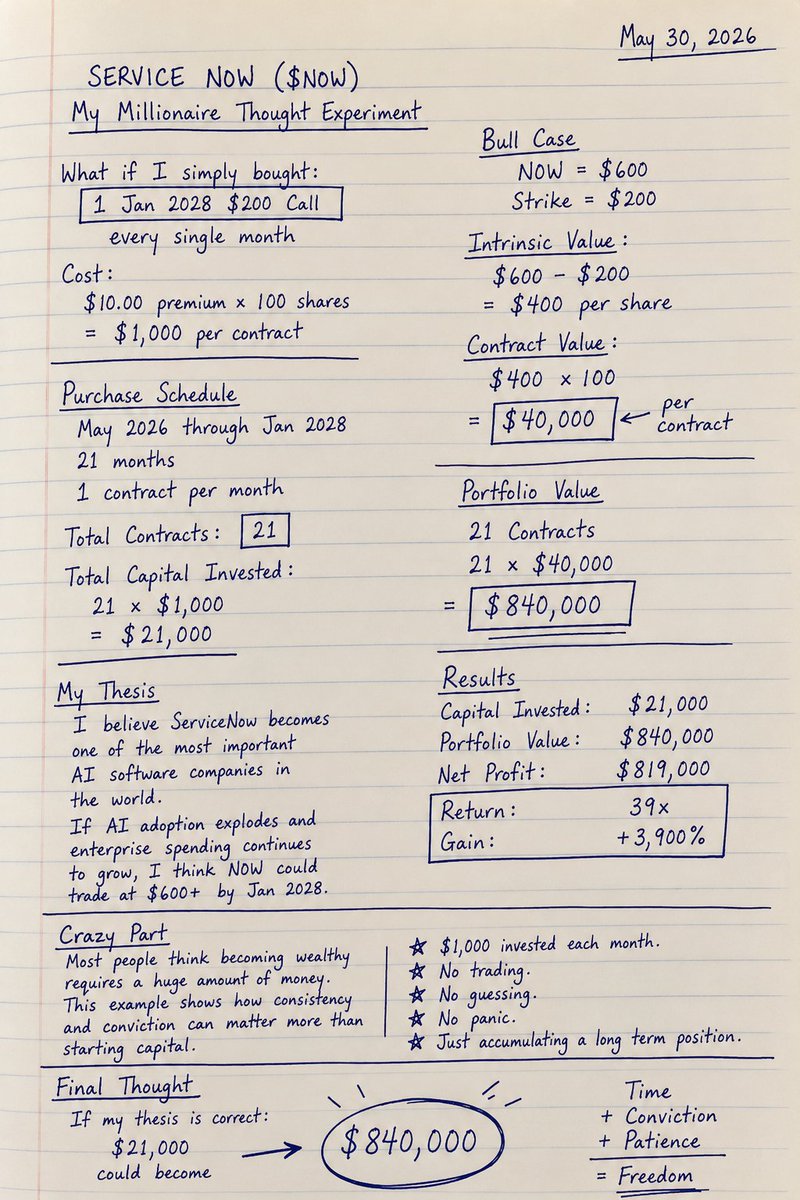
- $NOW $85 →$400+
- $DELL $235 → $800+
- $MU $320 → $3000+
- $IBM $220 → $600+
- $INTC $20 → 400+
*these are going a lot higher by 2035 just like $NVDA $AAPL $GOOG $TSLA $AMZN $MSFT
3. BUY LEAPS example $NOW buy Jan 2028 $200 calls.
4. OR just put $500-$1000 bucks into $VOO $QQQ each month (safest)
5. Be patient, keep it boring and simple.
♻️ RESHARE this post and write 1 comment, I'll DM you what LEAP to buy for each of these. Then do nothing, just buy and hold it.
I’ve dropped full breakdowns on:
• Market structure
• Directional bias
• POI (point of interest)
• Liquidity & inducement
No fluff. Just real understanding.
If you’re serious about trading, this is for you
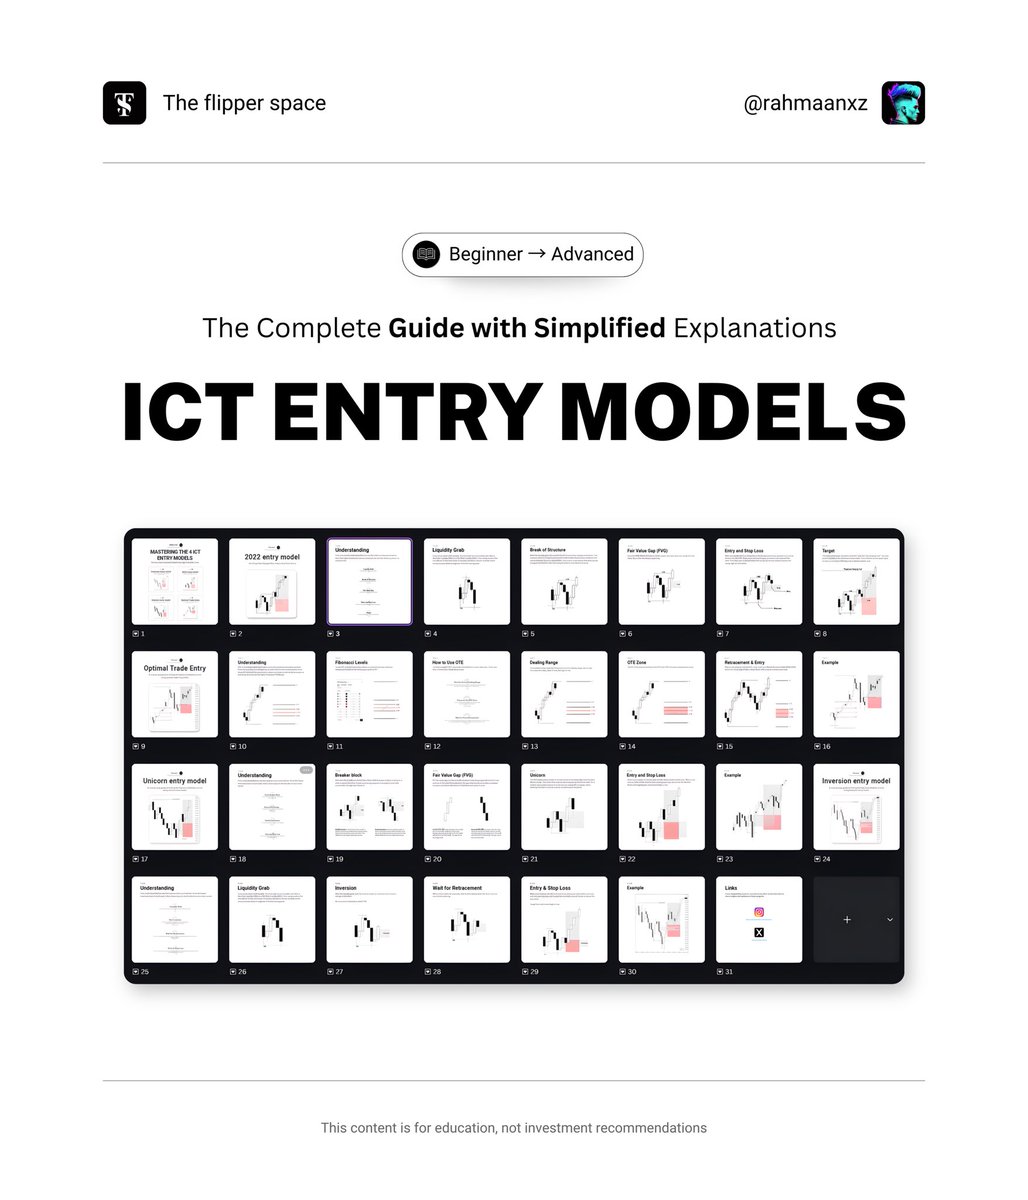
I studied ICT for years and i compressed
all ICT entry models into a 30+ page ebook.
I’m giving it away for free.
Want it?
Like & repost
Comment “Entry Model”
Follow me so I can DM you
How to read OrderFlow? 🤔
Here comes another quick guide on how to read OrderFlow like a pro and how you can profit from market-generated information. 👇
/Introduction:
OrderFlow is not another indicator or strategy. It’s simply a visualization of how the market actually works. Instead of only seeing open, high, low, and close on a standard candlestick chart, OrderFlow lets you see the real-time interaction between buyers and sellers, including the volume traded at each price level.
/How the market works:
If you trade the market, you need to understand how it works first! Markets operate as a two-way auction.
On one side, market buyers transact with limit sellers.
On the other, market sellers transact with limit buyers.
Market orders never trade with other market orders, and limit orders never trade with other limit orders!
Limit orders sit in the OrderBook and provide liquidity.
Market orders execute immediately by consuming that liquidity.
From here on, we’ll refer to traders who execute at market as "aggressive traders", and traders who place limit orders and wait for execution as "passive traders".
So when and why does price move?
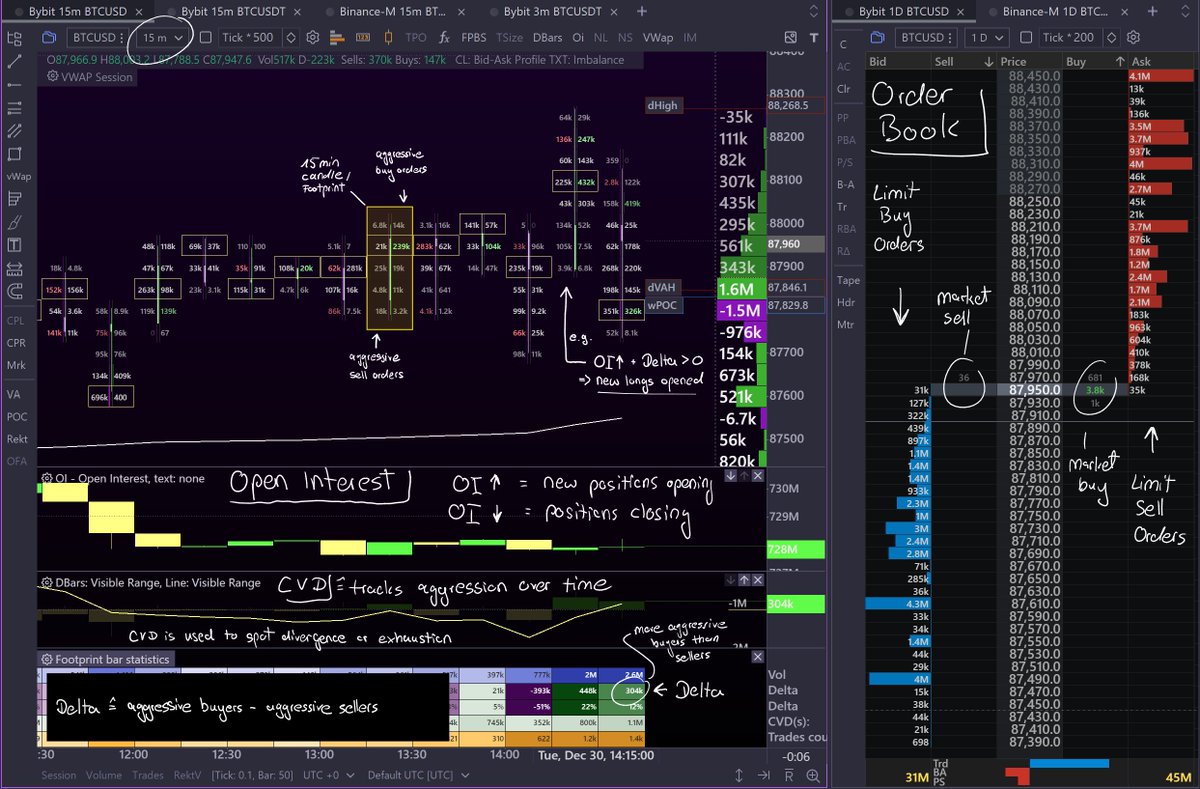
Let's say a large aggressive sell order hits the market; for example, a 5M contract market sell. To execute the order we need a 5M limit buy order on the other side.
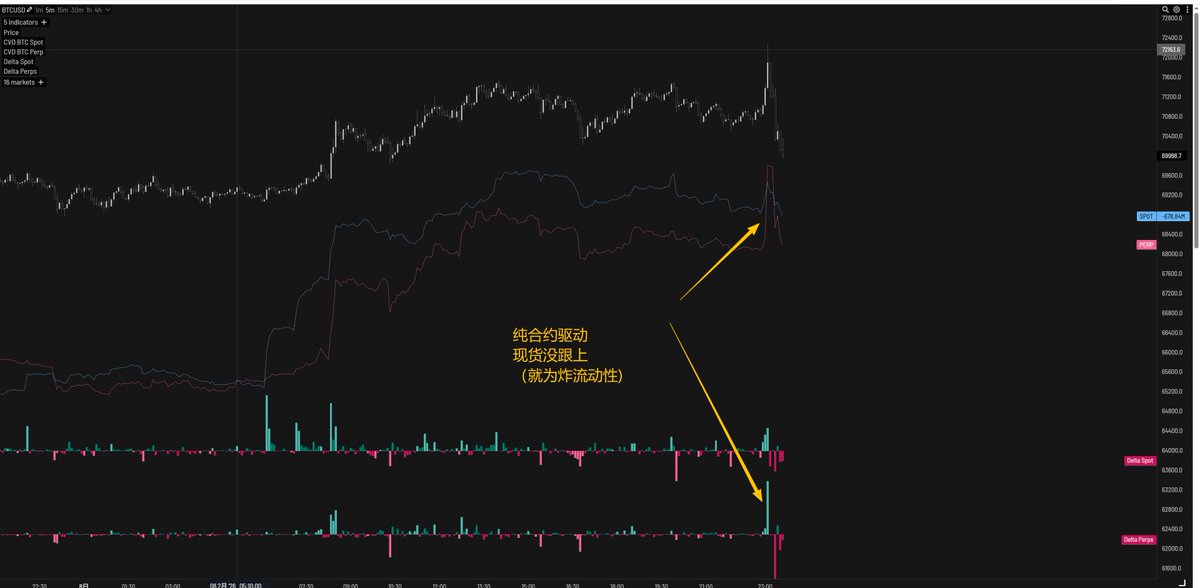
If we look at the current OrderBook (see picture, right side, in blue = limit buys), we can see that at the current price (87,950) there aren’t enough contracts resting on the bid. The order can’t be fully filled there, so price has to move lower to find more passive buyers and enough liquidity to complete the execution.
Price does not move lower because there are more buyers than sellers. Price moves because one side is more aggressive, starts crossing the spread and there isn’t enough liquidity at the current price!
/OrderFlow:
If you understand how the two-way auction works, you can watch it play out in real time using OrderFlow and so-called footprint charts (provided, for example, by @ExochartsC).
On the left side of the picture you see a footprint candle chart, showing aggressive sell orders on the left side of each candle and aggressive buy orders on the right.
Those are actually executed orders: market orders that got matched with limit orders.
You could also say that the left side of each candle shows limit buy orders executed by market sell orders. But for OrderFlow analysis, we focus on the aggressive side of the market, the market orders, because only aggression consumes liquidity and drives price discovery. So It shows intent, because aggressive orders reveal who is actively forcing price to move.
Thus we say we got market sells on the left and market buys on the right.
Now it gets really interesting when price does not follow the aggression.
For example, you see a lot of aggressive market buying (large numbers on the right side of the candle), but price doesn’t move higher. That tells you passive limit sellers are providing liquidity and absorbing the aggressive buyers. The buyers are essentially "hitting a wall".
That’s extremely valuable information you can use in your trading.
/How to trade with OrderFlow (OI, CVD, ...)
(next post coming soon...)
(Chart is showing ByBit's BTCUSD.p, 15min rotation, by @ExochartsC) #Bitcoin $BTC