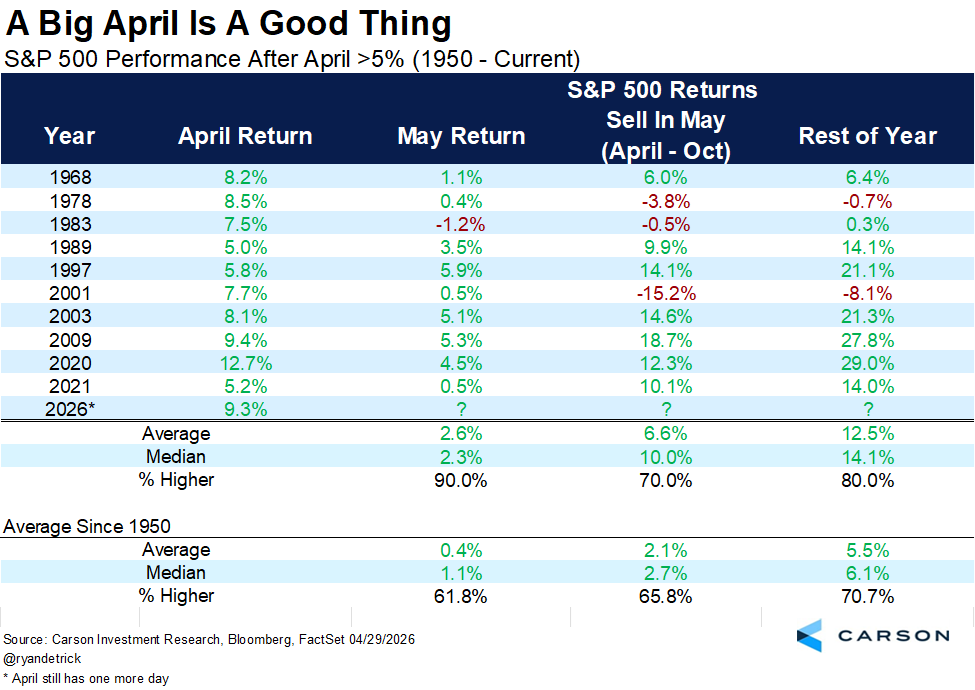
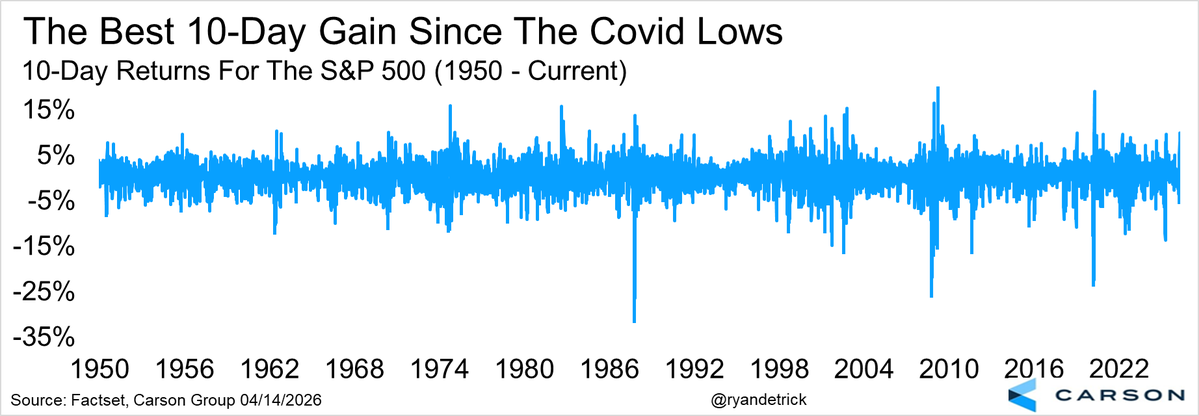
The S&P 500 is having a huge April, up more than 9% right now.
10 other times in history it gained >5%.
May was higher 9 of those times and both the Sell in May (May - Oct) period and the rest of the year were up substantially better than the average returns.
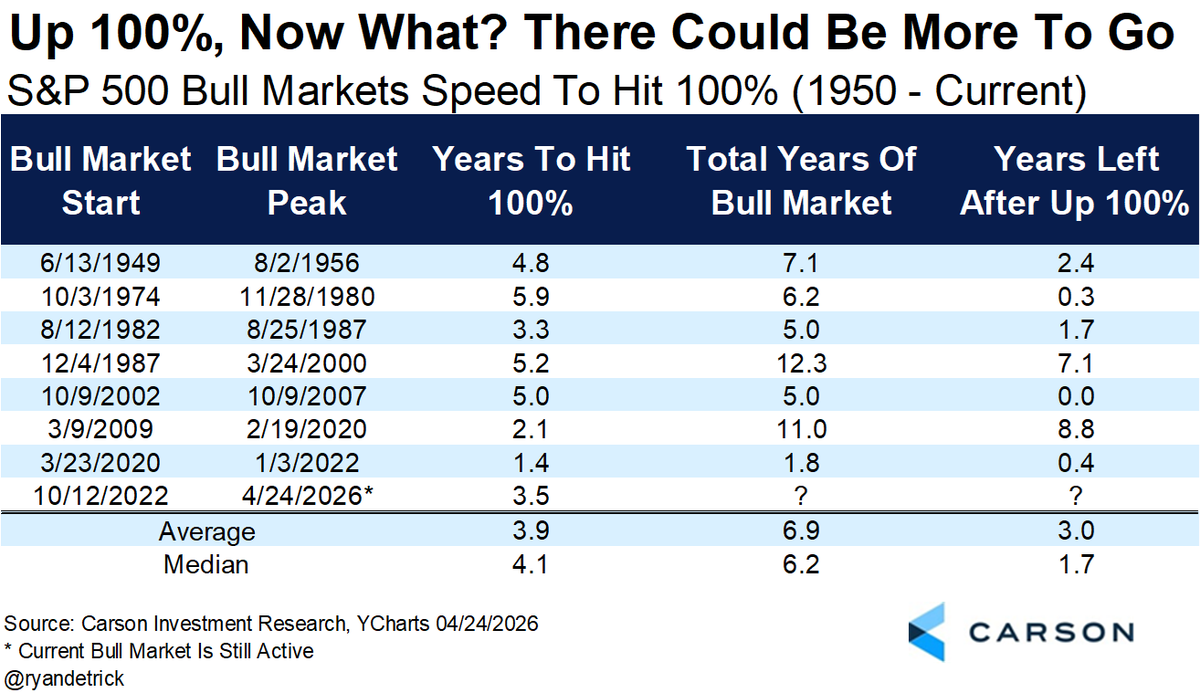
It took 3.5 years for this bull market to double, a tad faster than normal.
Did you know after previous bull markets doubled they had another three years on average left?
S&P 500 has a real shot at closing up 3% for three consecutive weeks.
This has only happened twice in history. At the '82 lows and after COVID. Stocks were up 33.9% and 32.3% a year later after those signals.
The S&P 500 moved to positive on the yr and is now only 1.32% away from a new all-time high.
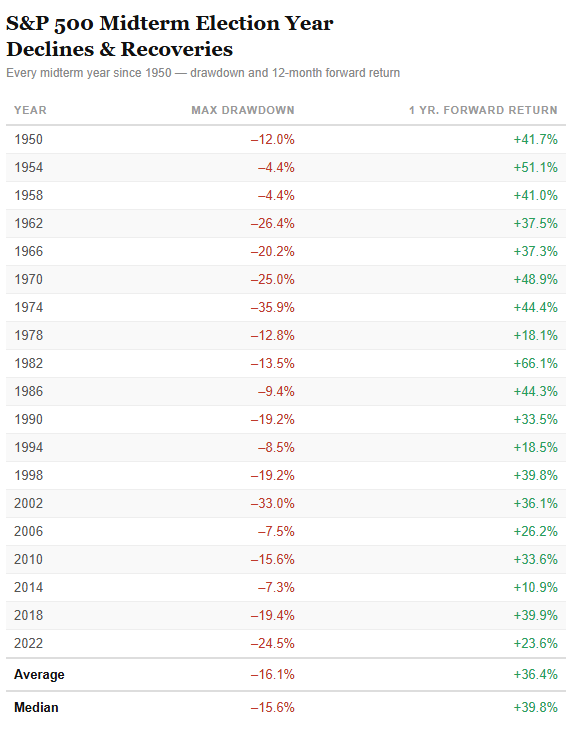
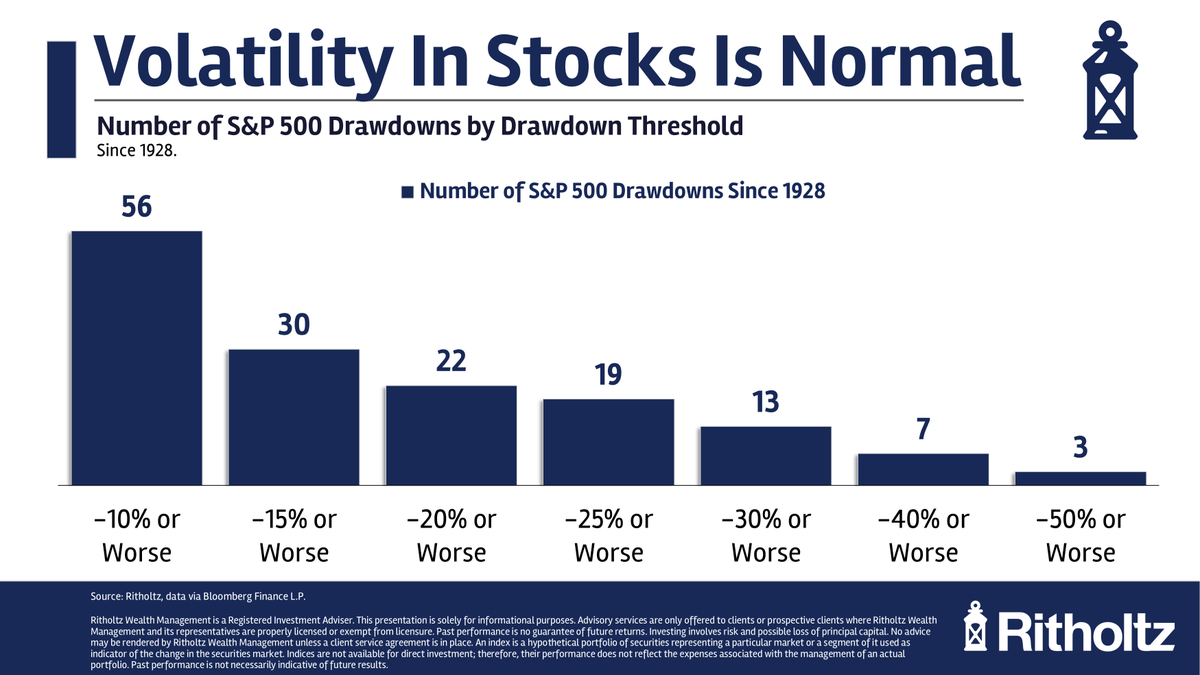
After an incredible 9 month win streak, we saw a perfectly normal 9.1% mild correction. They happen most yrs.
We've said for yrs now we are in a bull market and this is still the case.
No one knows how long a correction will last when you're in it
But buying stocks when they are down tends to be a good long-term strategy
A look at what happens when you buy the stock market down 10%, 20% and 30%:
https://t.co/iIhxLqzSjf
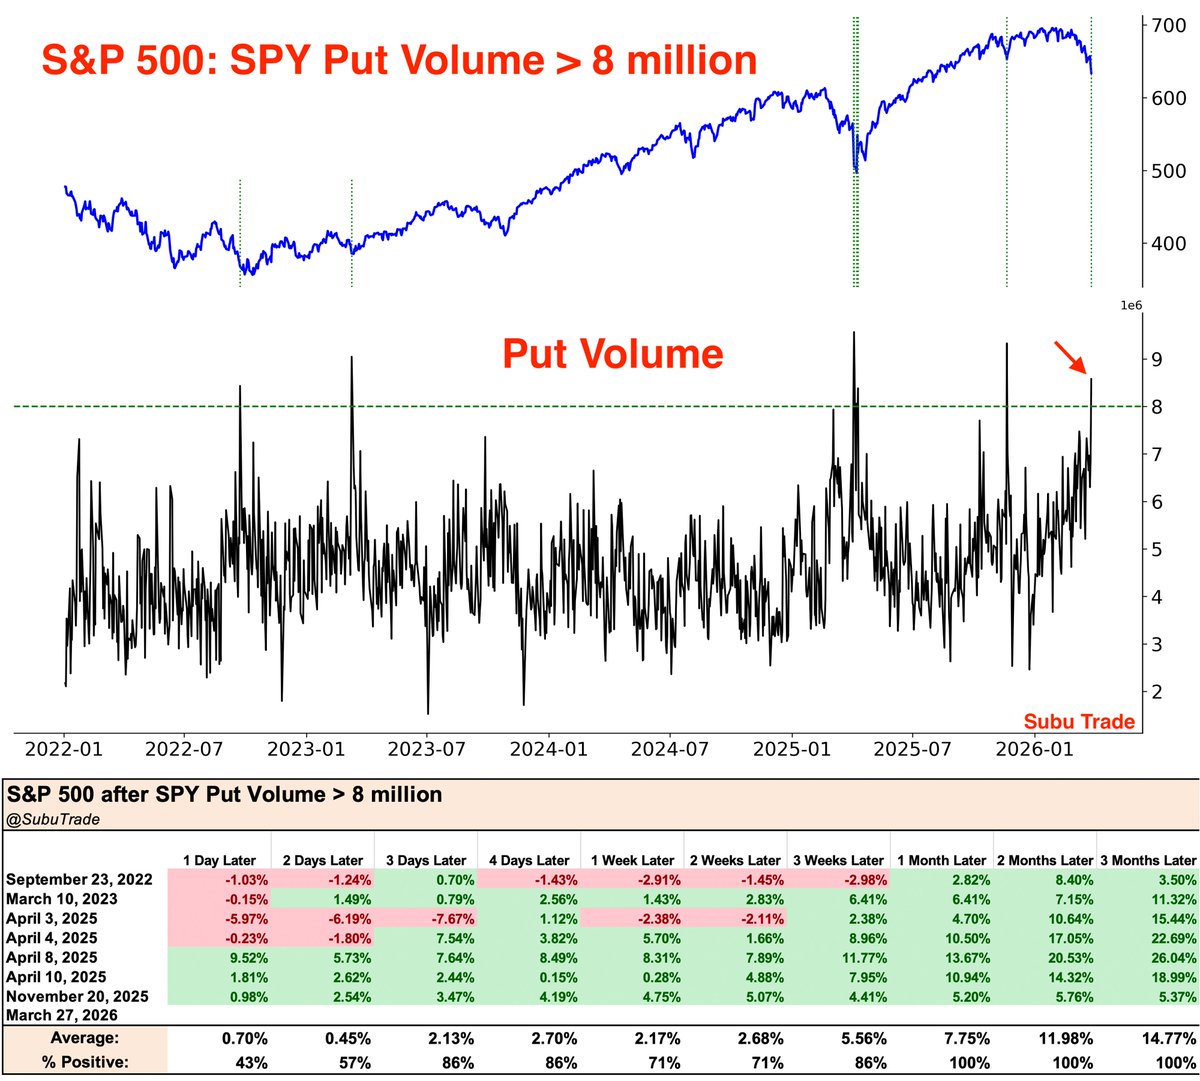
On 4/9 last year the S&P 500 was up 9.5% in a single day on the Liberation Day TACO
I'm convinced that one day is the only reason markets haven't gone down more on the war/oil crisis
Everyone who wants to be bearish is terrified of that scenario
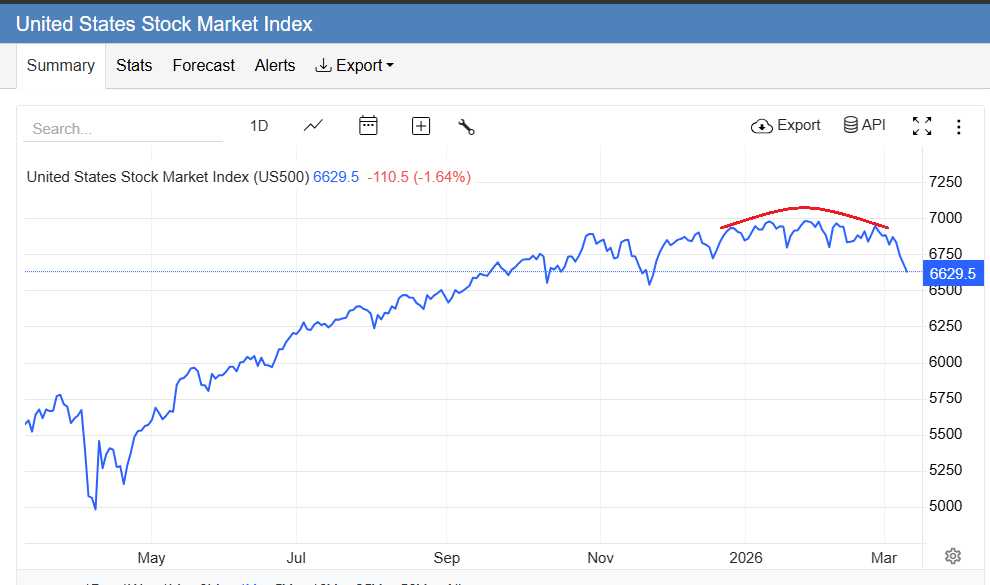
The S&P 500 is 5.9% from its 52-week high.
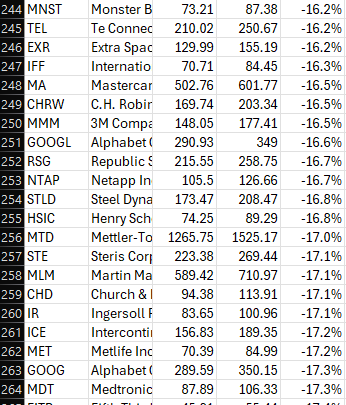
The median S&P 500 stock drawdown is 16.6%.
And that's very normal. Don't let anyone tell you it's somehow bearish or indicative of extra risk in the market.
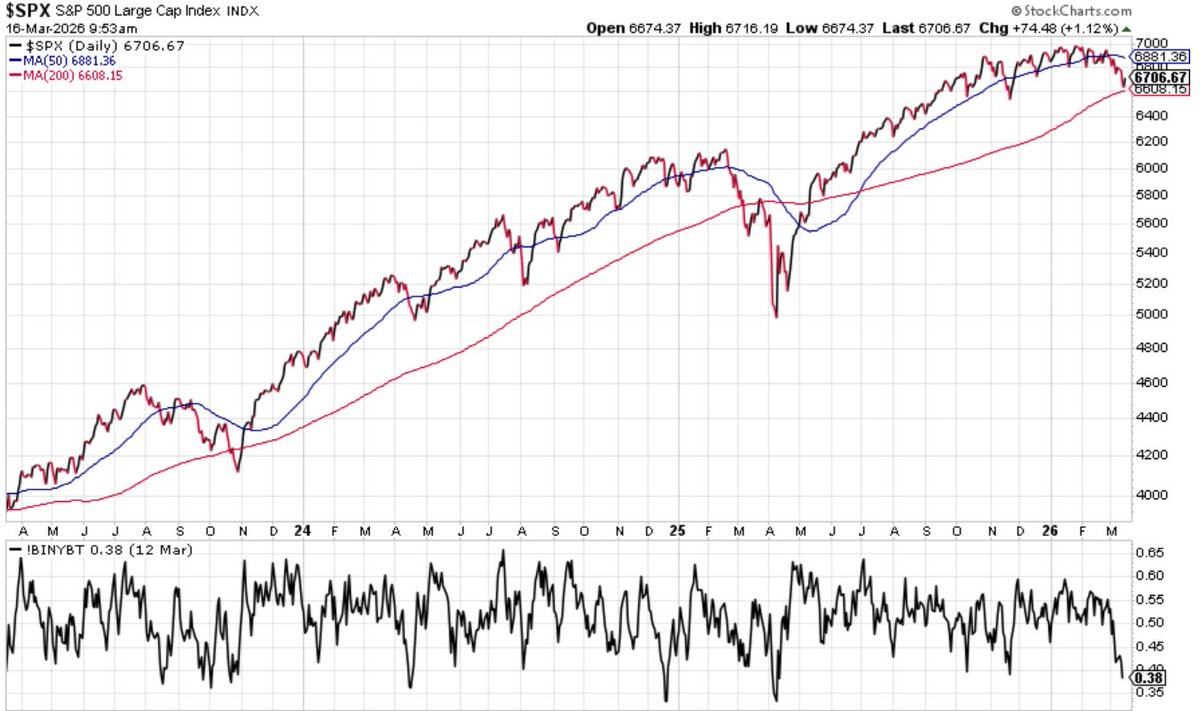
The clock for a potential Zweig Breadth Thrust (ZBT) started last week.
Only 2% of all these signals go from oversold (like now) to overbought within 10 days (triggering a signal). But those that do tend to suggest the bulls are back. April '25 last time we saw one.