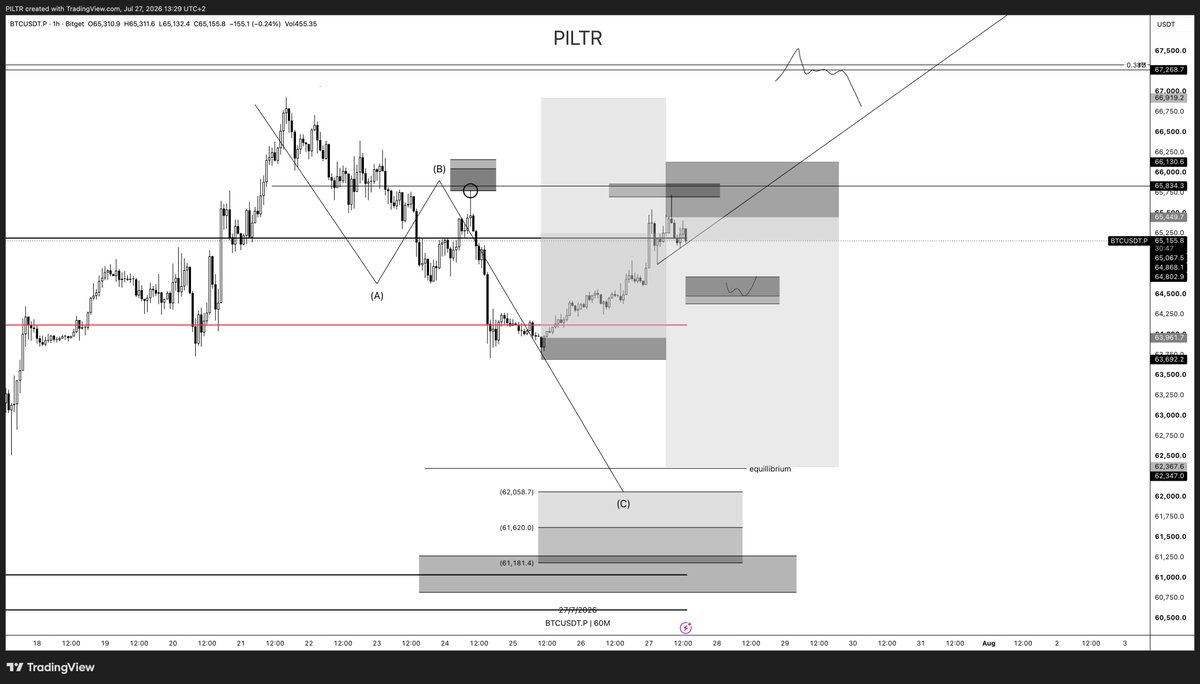
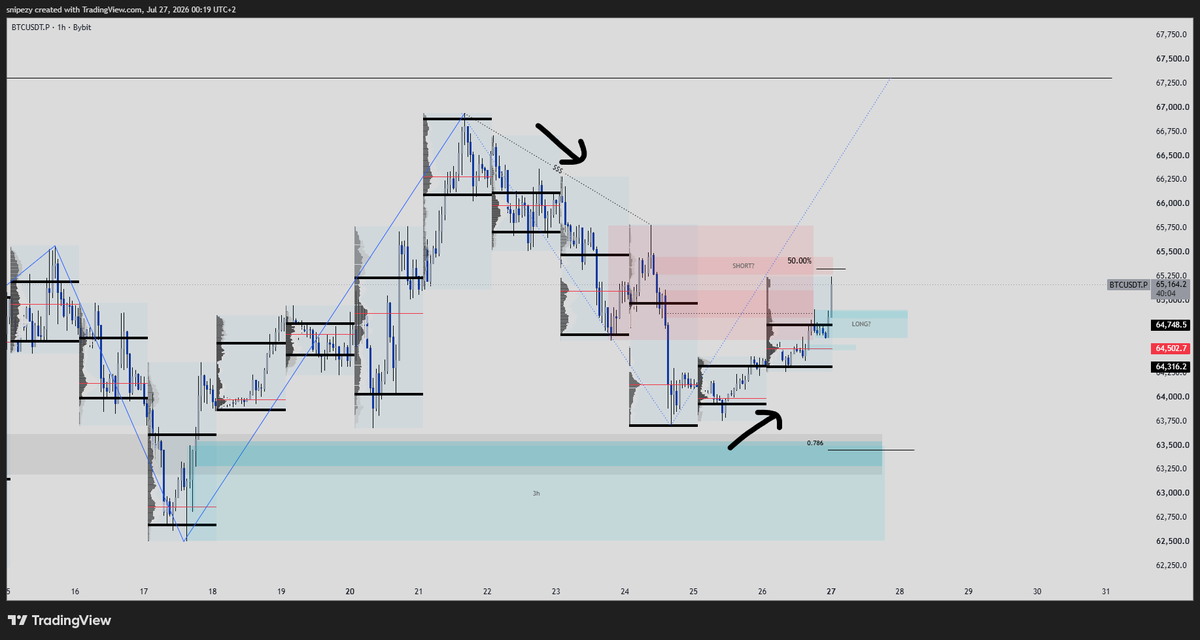
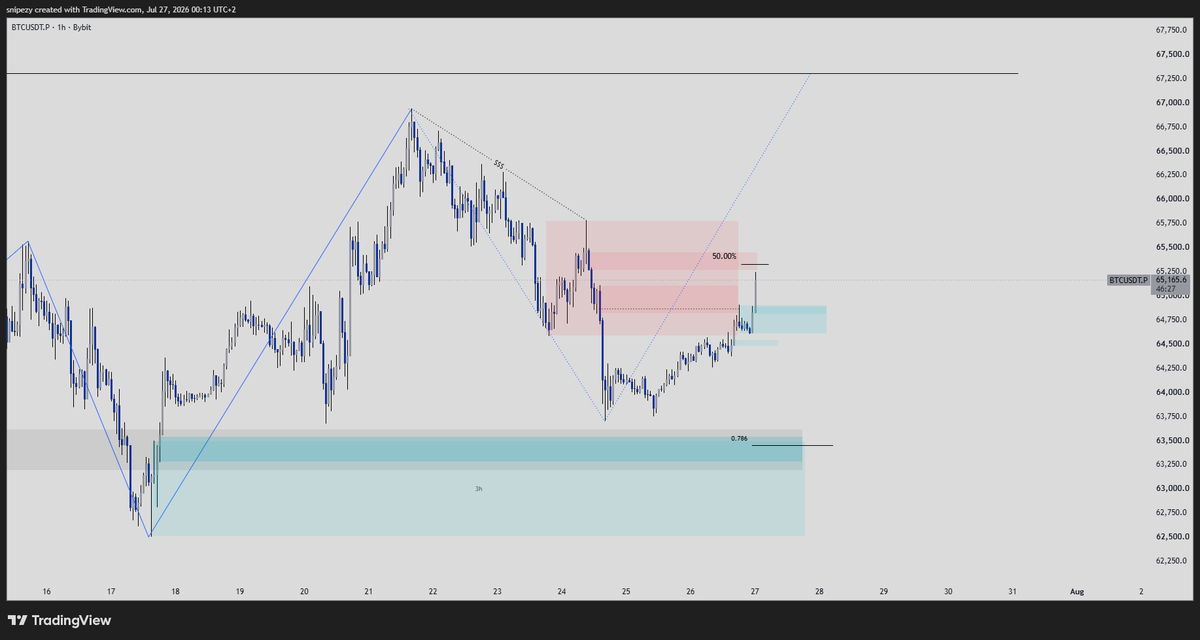
$BTC update daily plan
> I just finished breaking down my current positioning and market outlook live on Discord.
> If you’re interested, feel free to join through the link in my bio. I’ll be streaming more frequently going forward.
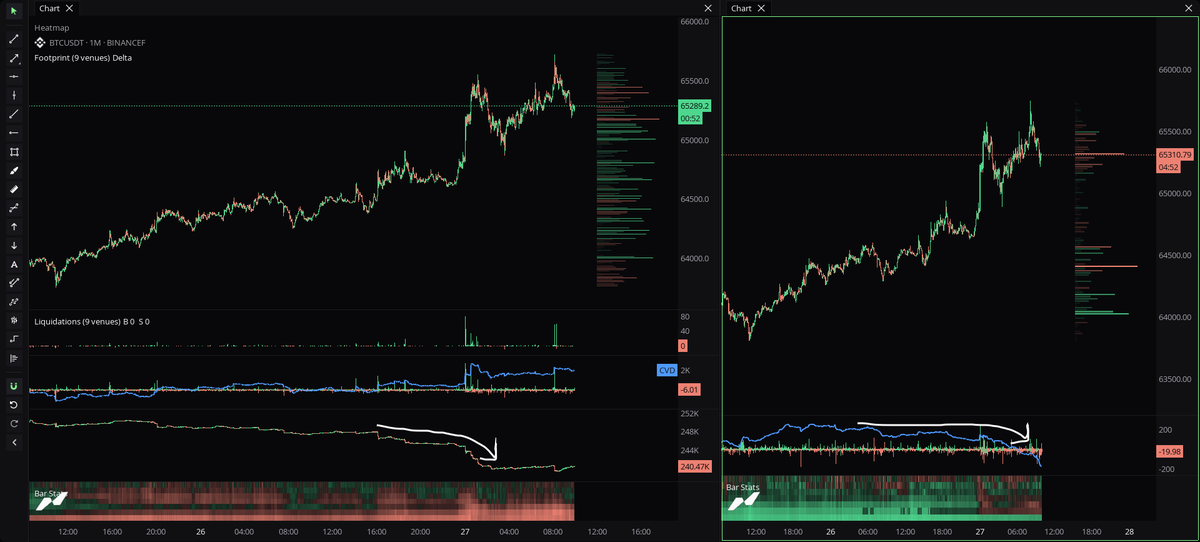
> As mentioned earlier today, the move higher was primarily amplified by short covering rather than genuine buying intent.
> Spot CVD kept trending lower while price pushed higher, we overextended into my correction target and reacted right at the Golden Pocket, where a 1H bearish divergence also formed.
> On the retest, perpetuals attempted to sustain the move higher (funding elevated and increasing with OI), but without meaningful spot participation and with very little passive bid support in the order book.
> That divergence was my trigger to open a short. The position is already protected and sitting in solid profit.
Order book depth remains ask-heavy, with pressure building overhead. Unless spot demand returns or we see stronger inflows, I favor downside from here.
-> my long is still open with small size covering in case flows shift
Monday’s opening impulse often sets the tone for the rest of the session, and historically, a strong early squeeze can frequently be followed by weakness later in the day.
$btc
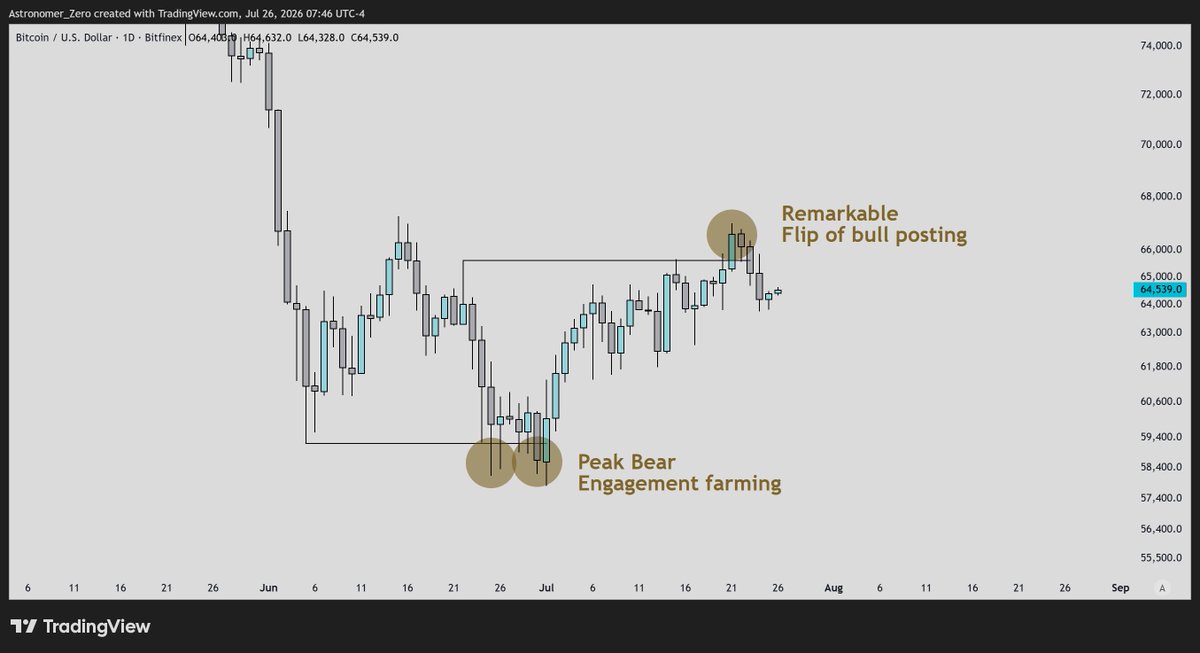
Why we countertrend shorted above 66k - confluence 5 - the sentiment.
The fifth confluence is quite simple, of how there was a remarkable sentiment shift from below 60k, loudly expressed, to above 66k, where it again became loudly expressed in the opposite direction.
How to find out? The ones who took note of the typical bear post engagement farming posts, both blatant and more encrypted in "smart analysis" form, know.
I told you below 60k to take note of those posts and who is behind it, and then see who shifts tone and when. Above 66k, it happened.
Why below 60k and why the shift above 66k?
Because at both ends, a significant low got taken out, so a lot of liquidity gets generated that way in form of panic selling, in lockstep with how their favourite influencer suddenly talks again about how the bear market "is here, told you so" below 60k, all for just a move of a couple % lower below 60k. And suddenly now about how a bottom has formed, or "rally in July".
So whatever the excuse may be each time, it's not about the content, but the overall tone and timing of the post.
We hinted to take track of those type of posts and frequency, and (most of) those same patterns of ports started repeatedly appearing above 66k how they told you July would rally, how the bottom is suddenly in now convincingly, and how their masterplan will play out.
Again, not the content that matters, but the tone and timing of the post.
When reading sentiment, always look at who, timing and tone, to gather a picture.
That's not to be directed at anyone, but just the sheer reality of this game, we like to use to confirm our trade entries.
A good trade is generally an unpopular trade, or, a more popular trade at a less popular time (leaving the popular opinion side lined).
That's sentiment reading in a nutshell.
And no, I'm not naming any names of accounts I track. That's confidential, and this is not directed at anyone. The idea is clear, the idea I use to make money more confidently. And that's more than enough to set you on your way.
bitcoin:native
My current market thesis...
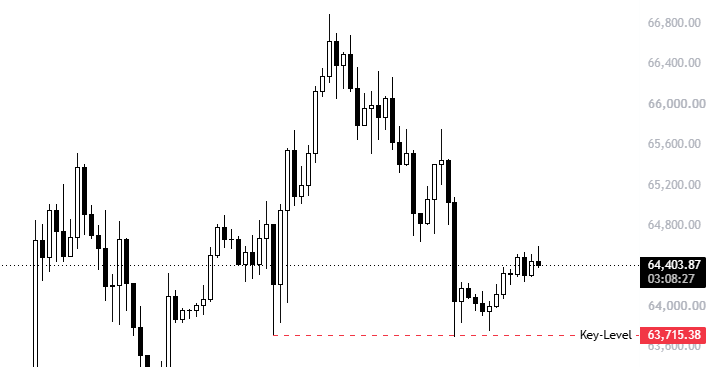
$63.7k is the critical level to watch heading into market open this week.
If price action holds this level and continues higher, we'll most likely sweep the liquidity above the previous high.
However, if we close a full 4h candle below this key level, it will confirm a break of structure and show that market sentiment has shifted from bullish to bearish.
In the short term, expect more sideways movement over the weekend.
$BTC
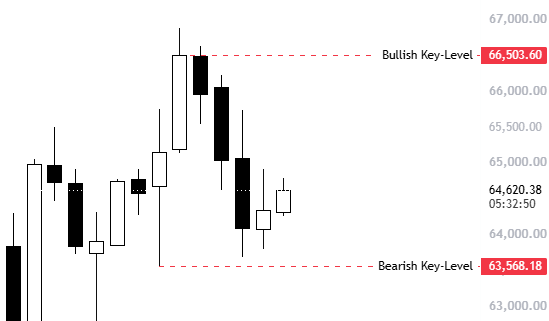
Going into market open, these are the two key levels I'll be watching...
If price holds above the bearish key level at $63.5k, we can expect a retest of the recent highs around $66.5k. Depending on how it reacts there, it may continue higher.
However, if we don't see continuation to the upside, I'm expecting price to lose $63.5k, break through the BOS and sweep the liquidity below.
bitcoin:native
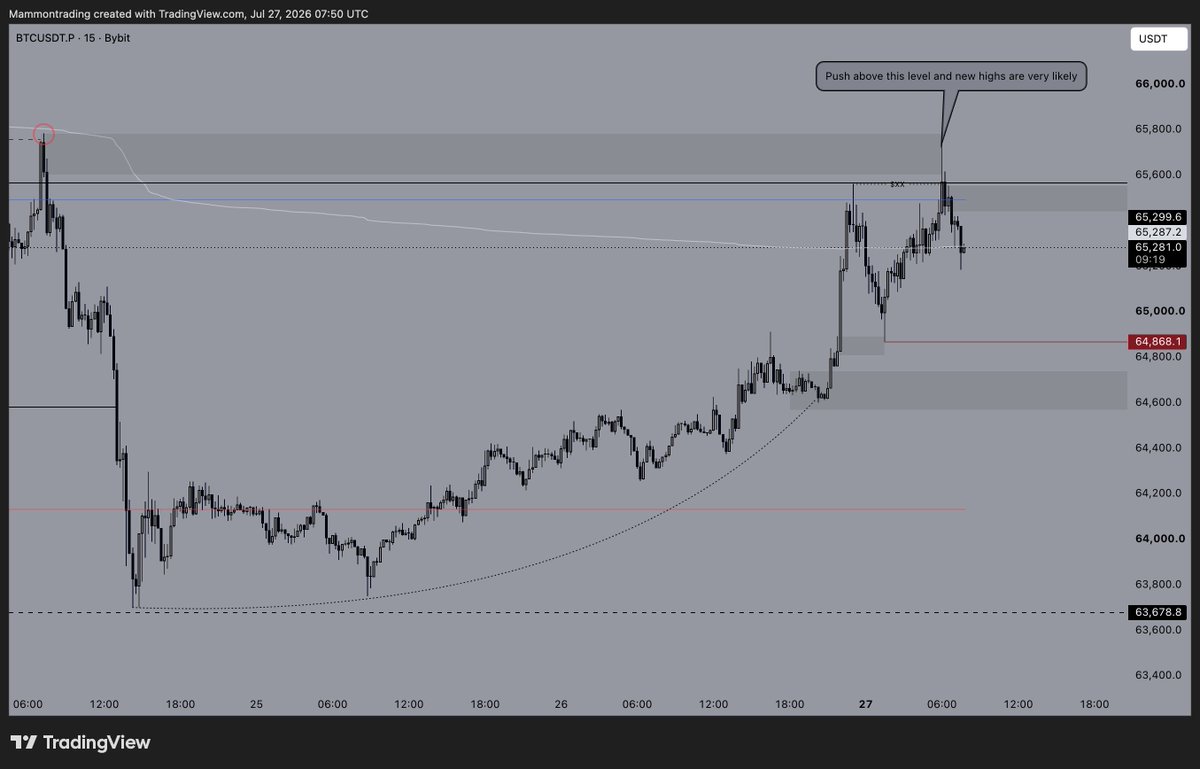
Price made another push higher directly into the key supply and range-high area mentioned earlier.
This is the main decision point on the chart.
Bears have no reason to allow a reclaim above $65.6K. Acceptance above that level would reclaim the range highs, invalidate the bearish Po3 and make further highs increasingly likely.
As long as price remains below the range highs, the bearish scenario stays valid. The current move could simply be another bearish retest before continuation lower, especially with plenty of weekend sell-side liquidity left behind and price still trading below the range VAH.
Simply put:
• Bears need to defend the current highs and keep price below $65.6K.
• Bulls need to reclaim the range highs and hold above $64.8K. Otherwise, a move back towards the weekend sell-side liquidity remains likely.
A highly decisive area that could determine the direction for the coming weeks. Both scenarios have clean invalidations, so this should provide solid opportunities once price confirms which side is in control.
bitcoin:native Weekly preparation: structure + volume
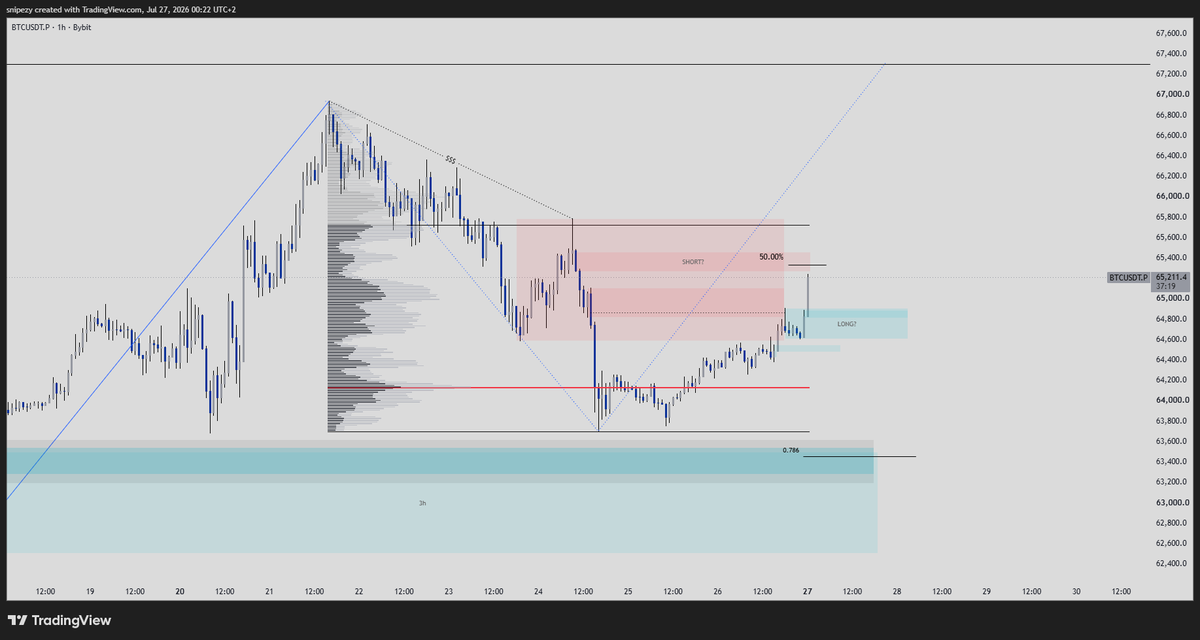
Structure-wise, we're still in an uptrend, but that trend hasn't been reconfirmed by a bullish break, instead we put in a naked low, just stacking sellside liquidity.
We're currently pushing through supply and creating demand, and it's looking relatively bullish as of now, to the point where we could even look for longs in the freshly created demand. But since weekends tend to be manipulative and the moves often get retraced, I'd rather wait to see what the weekly open does before jumping into any positions.
Another thing I wanted to talk about is the volume distribution. If I plot the daily volume profile, there are 2 really interesting things to see. First, the value area of the daily volume profile is closing above the previous POC + VAH, showing some bullish strength. On top of that, the entire volume is located at the current low, which is really unusual given this price action happened over the weekend (low volume).
If we don't end up distributing at this supply, which is the EQ of this downpull, there's a high chance we end up going for all the buyside liquidity above.
Going to sleep now, excited for this coming week with FOMC on Wednesday and the monthly close on Friday.
$BTC
We are in the short zone, but I am not taking any shorts until we get a confirmation on them.
Which is gonna be the stop/liquidity hunt of the early shorts and trapping of breakout longs.
We are gonna have our Asia session open in 1.5 hours and I am expecting it to take the early shorts out and then dump towards the downside liquidity.
$BTC
This doesn’t look good.
We finally got the breakout from the ascending triangle I was talking about a while ago.
In this case, the breakout was to the downside, and price is now moving back toward the trendline it previously broke below.
A retest of a triangle after the breakout is pretty common and often provides good entries.
Looking a bit closer, this retest would also form the right shoulder of a head and shoulders pattern, with a technical target around 61k.
From a pure technical perspective, this looks extremely bearish to me.
If we get rejected at the retest, I expect a retest of the 62k support zone.
This is the zone that has to hold. Otherwise, a lot of people will learn how quickly we can make new lows.
$BTC starts the week after another weekend pump.
Those weekend pumps get erased often, so the first play I'm seeing is a potential short towards the 63.7K lows.
The drop we seen last week pulled a lot of late sellers into the market, and a liquidity channel has been built since the 67K test.
So for a potential short, I want to clear some of those highs and take buy-side liquidity to erase late sellers.
If I see a nice reaction after the above, I'll look to scale-in a short to the lows.
The 68.1K highs are still on the radar, and I'm very interested to scale-in shorts if we get a nice reaction after the sweep.
For longs, the weekend pump is too low-probability to long from.
If I want to take longs, I need a strong foundation, and weekends don't generate that for me.
The first long-POI would be at the 60K region to catch a potential relief bounce.
First day of the week, let's get back at it.
🎯 BTC Decision Zone
$BTC has pushed higher overnight and is now approaching a region where sellers could start regaining control.
Two levels stand out to me:
Local range VAH
Fibonacci retracement of the recent downswing
This is where I’ll be paying close attention to the order flow.
📊 Early Warning Signs
While the rally has been impressive on the surface, I’m starting to see a few things that make me more cautious.
1. Short squeeze, not fresh demand.
Most of the move appears to have been driven by shorts closing their positions, rather than new buyers aggressively entering the market.
2. Spot CVD is diverging.
Price continues to push higher, while Spot CVD is lagging behind.
In some cases this can point towards absorption. However, given that the rally itself was largely fueled by short covering, I currently interpret it as a sign that spot buyers are still not participating enough.
⚖️ My Current View
I’m not calling for an immediate reversal.
However, with BTC approaching major resistance and order flow beginning to weaken, the risk/reward is slowly starting to shift in favor of the bears.
From here, I’ll be watching closely to see whether buyers can prove me wrong; or whether sellers finally begin to take back control.
Do you think this rally has enough genuine demand to break through the rVAH, or is it running out of fuel? 👇
Honestly, I don’t think this move up was super healthy.
Looks more like price was pushed higher by shorts getting squeezed out than real strong fresh demand.
OI down.
Liquidations on every high.
Shorts forced out.
On spot, we do have orderbook support.
OB imbalance is showing buyers still trying to hold it.
But the ugly part is spot CVD.
CVD going down hard, aggregated spot delta negative, so there is a lot of spot selling into this move.
Now this can be bullish or bearish.
Bullish if those spot sells keep getting absorbed.
Bearish if absorption stops, because then this can reverse very quickly.
#BTC
GM ☕️
$BTC OrderFlow delivered 🎯
...we got the weekend bounce driven by the trapped shorts we had been tracking.
But unless spot buyers and new longs step in soon, the higher-probability outcome is a quick move back toward the lows!
Quick recap:
1 - Bullish absorption: At the start of the weekend, aggressive shorts opened into passive buyers who kept absorbing the selling. Despite the increase in short exposure, price failed to move lower.
2 - Sellers became trapped: Spot buyers gave price a small push higher, putting those shorts underwater. Even then, more sellers continued stepping in, and still failed to produce downside only "adding fuel to the fire".
3 - Short covering fueled the bounce continuation: Once shorts started closing their losing positions, they had to buy back at market. That created the predictable buying pressure we discussed and drove the move higher. At the same time, spot began distributing into that forced buying.
What comes next?
The fuel from trapped shorts now looks mostly exhausted. Spot is selling into the bounce, and we are not seeing meaningful intent from new longs. Without fresh spot demand or aggressive long positioning, there are few genuine buyers supporting the move. This bounce is beginning to show signs of exhaustion. Unless spot buyers and new longs step in soon, the higher-probability outcome is a quick move back toward the lows ⚠️
https://t.co/p1tIb2XYPq
Short and precise $BTC trade breakdown. 👇
1. Strong Delta Bubble traded just short of 64250. It gets front-run initially, and the market trades above it with aggressive buyers and a strong positive candle delta. The market keeps gravitating toward 64250.
2. Sellers try to break the level of the Delta Bubble but fail multiple times. Liquidity above us on the ASK is increasing piece by piece. This raises the probability that the market will get pulled by the liquidity of those ASK limits.
3. Average Delta and volatility drop. Sellers are literally drying up while buyers show up consistently.
4. The price at 64250 is the daily strike price with the strongest Delta (a positive one in this case). Buyers are in control, but as we can see on the far left of the chart, they were absorbed at this price multiple times before.
5. After sellers get repeatedly absorbed (see point 2), the market holds above the negative Delta Bubble, and the Average Delta shows clear seller weakness. This triggers the entry, targeting the liquidity areas at 64500 and 64750.
@RHerman Thanks, i didnt see any Btc examples on your videos, also i joined ur discord and you said something like 'I will start working on BTC Probability Map after Gold' last year, what is this and whats the difference between intelligence balance probability map?