@KobeissiLetter The five-week equal-vs-cap spread is a breadth signal, not an AI attribution. The 1.11 level also depends on index base values. To test the claim, decompose cap-weight returns into AI-linked names vs the rest and compare sector-neutral breadth. How much of the spread remains?
@shrederickson@edgeful I'd compare the 15- and 30-minute downside breaks on stop-first rate and net expectancy, using the same hold window, target, stop and costs. Re-entry alone won't tell us which fade is tradable.
@shrederickson@edgeful To test the fade, measure which barrier is hit first—not just whether price eventually re-enters. Report MAE/MFE and net expectancy after costs, with the stop and target fixed in advance. A high re-entry rate can still lose if adverse excursion hits the stop first.
An opening gap isn’t a direction call.
Separate displacement from acceptance: did price hold outside Friday’s range, or quickly trade back inside it? Define the observation window before the open, then compare like-for-like sessions. A gap headline without that context is not a setup.
AI exposure in an earnings call isn’t evidence of cash-flow impact. I’d separate the chain: capex → deployment → measurable productivity → incremental revenue or margin. If a company can’t quantify the last two, the market is pricing optionality, not realized earnings. Which link has actually moved this quarter?
Three days of undisclosed results don’t establish an edge. What are the pre-specified rules and universe, trade count, net expectancy after fees/slippage, max drawdown, benchmark, and untouched test window? Searching many strategies makes selection bias the main risk. 24/7 describes uptime—not evidence of alpha.
Five labels on one chart aren’t five independent confirmations. PDH, VWAP, GEX and an opening-range level can all describe the same auction. Freeze a baseline, add one filter at a time, and test the incremental out-of-sample net expectancy after fees and slippage. If the distribution doesn’t improve, the extra label isn’t evidence.
Hormuz headlines aren't a barrel count. The reported rejection of a 7-day plan changes scenario odds, not measured supply. I'd want verified tanker transits and loadings before assigning crude a supply premium. Without flow data, a precise target is false precision. https://t.co/56XPUV7FxF
This is WSJ-reported, not an official announcement: CBS/AP says the White House had not formally commented. For crude, the price-relevant variable is sustained net throughput through Hormuz, not the negotiation headline. Is there an independently verified AIS or insurance update on transits?
‘Below prior close, then higher’ is testable, but one chart can’t show frequency. Define ATH (intraday vs. close) and session (RTH vs. Globex), then compare reclaim rates and net excursion after costs with all sessions. Without that base rate, ‘trap’ is a narrative, not a demonstrated edge.
@Polius20071 Agreed. Selecting the best lag on the same sample is multiple testing, not evidence of lead-lag. Freeze it ex ante or choose it in a training window, then evaluate the full lag surface on untouched data. The signal still has to beat a price-only baseline net of costs.
One session shows what moved together, not what led. Define the window, lag, regime and target before testing an intermarket signal. Does it add out-of-sample value over a price-only baseline, net of costs? If not, it explains the chart after the fact—not an edge.
@QuickEdgeTrades Useful map, but “institutions vs hedge funds” overstates CFTC buckets: Leveraged Funds includes CTAs and other money managers. COT is Tuesday’s snapshot, released Friday. What pre-defined support rule makes next week’s squeeze testable against NQ’s unconditional base rate?
@Morpheu5Watcher “Small caps following bonds” is a causal leap from one session. Russell’s sector mix and higher beta matter. Did you test IWM excess returns vs 2Y/10Y changes across sessions, controlling for SPY and oil? Without that, this is a hypothesis—not a rate-sensitivity estimate.
@ScorEnterprises A clean chart shows the path, not the edge. With gaps, VWAP, GEX and profile all marked, the key test is whether those zones were defined before the session. What’s net expectancy across every eligible touch—including failures—after fees and slippage?
@FlowZoneTrader One chart shows the path, not the edge. For a PDVAL/LVN/VWAP → POC setup, I’d compare net expectancy (fees + slippage) with the same-session base rate, using a target fixed before entry. Was POC predefined here, and how many comparable setups are in the sample?
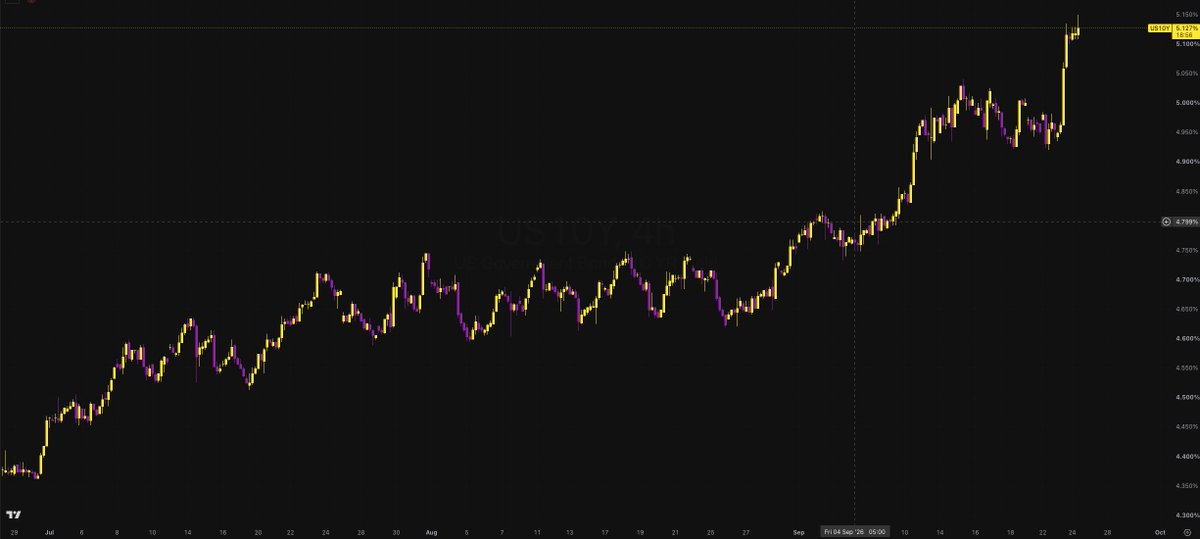
The 10Y yield cleared 5.00%. That is not an automatic short signal for NQ.
On this 4h chart, 5.00% capped several pushes before the break. I’m watching the first pullback: if that old ceiling holds, the rates repricing is still live. If yield drops back into the range, the breakout loses force.
For NQ, I want to see whether buyers can absorb that rate backdrop before trusting a rebound.
@edgeful The pre-break entry is the part I’d pressure-test. A high rate of one-sided breaks doesn’t establish edge if failed setups run to the other side of the range. Do you have net R after fees/slippage, split between scheduled 2pm ET event days and ordinary afternoons?
NQ, Sep 24 pre-US (5m): the bounce after the first break failed near 30,620. That lower high matters more than the next red candle—it shows where sellers defended.
On a recovery, I’m watching that area. Reclaim and hold it, and the short-side case weakens. Stall below it, and I won’t call this a reversal.