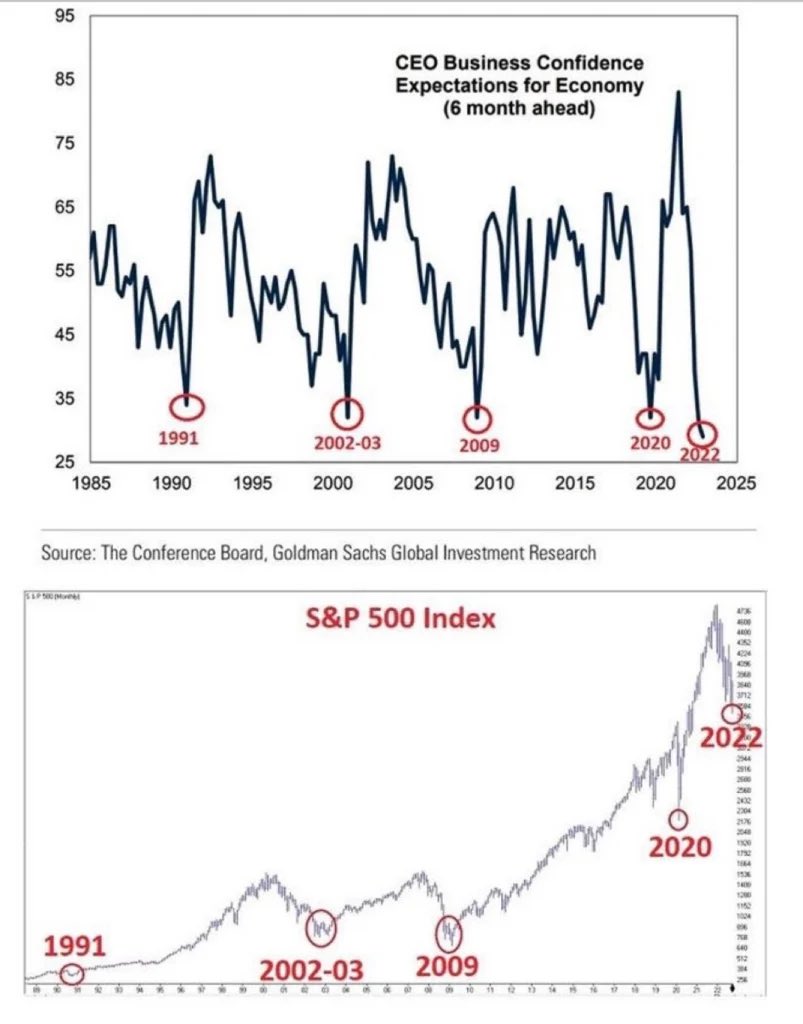
The best buy signal in markets isn't a chart pattern.
It's CEO confidence hitting rock bottom.
1991: CEOs most pessimistic → S&P 500 bottomed → massive rally
2002-03: CEOs most pessimistic → S&P 500 bottomed → massive rally
2009: CEOs most pessimistic → S&P 500 bottomed → massive rally
2020: CEOs most pessimistic → S&P 500 bottomed → massive rally
2022: CEOs most pessimistic → S&P 500 bottomed → massive rally
Every. Single. Time.
When the people running the world's biggest companies are most scared about the economy — the market is loading up for the next bull run.
Extreme pessimism is the contrarian investor's best friend.
$MSFT monthly bx is still red.
Not buying yet.
That said long term institutional support is holding up well. 80% of the time price bounces off this level.
This is a strong long term entry zone. ✅
When the monthly flips I will be ready to move.
🚨 I've been warning about this for weeks; a -20% drawdown. This is my last one.
I'm not a doom-poster. I don't do fear content.
This is just the most COMPLETE picture I can give you, and what I think the current situation means for the market.
This is my view. Not financial advice. Not a prediction.
Long-term? I'm still bullish.
Short-term? I see a legitimate path to a -20% drawdown from here. And I think most retail investors are not aware of the potential on-going RISKS.
Here's EVERYTHING you need to know:
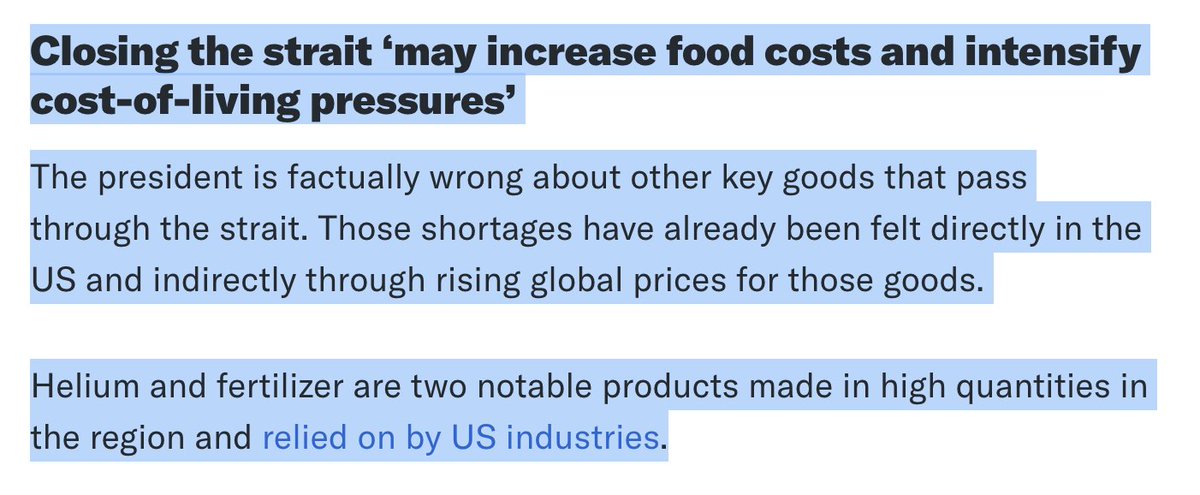
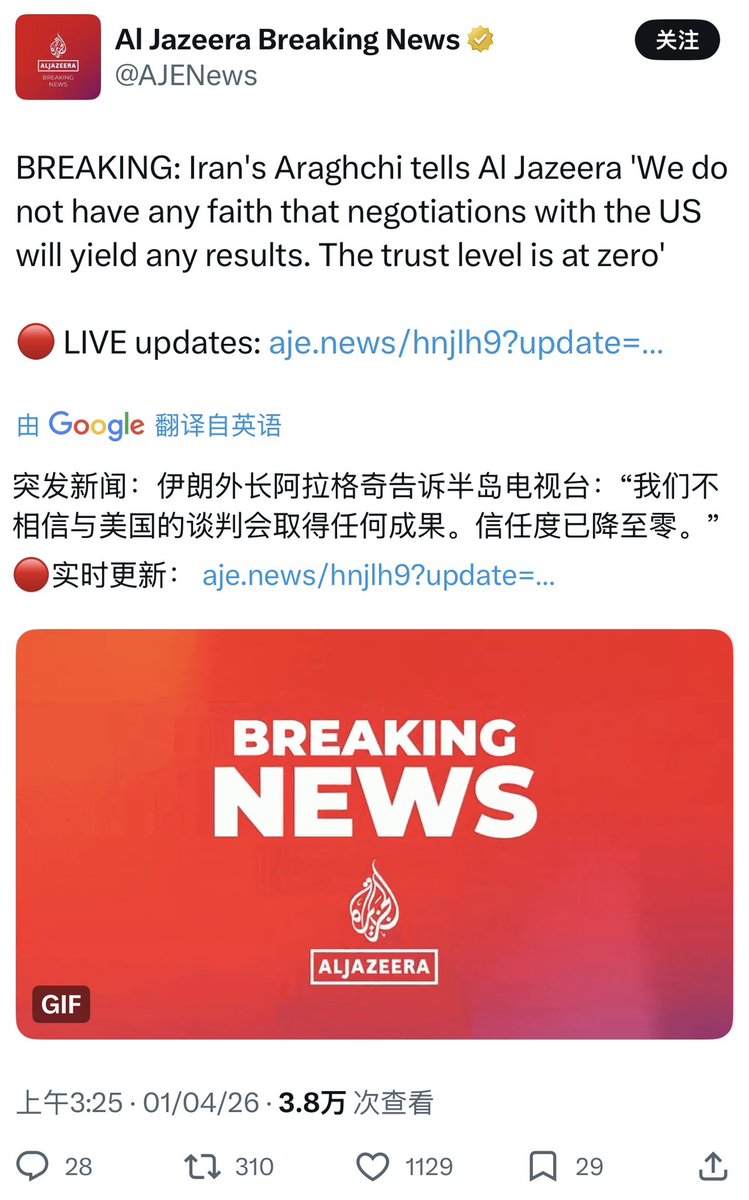
The Strait of Hormuz has been closed since February 28 and the majority of people have NO IDEA what that actually means for the global economy.
Let me walk you through the math nobody's doing.
The Strait is 21 miles wide at its narrowest point.
Through it flows:
→ 20M barrels/day of crude and refined products
→ 20% of ALL global petroleum consumption
→ 20% of the world's LNG, almost entirely Qatar/UAE
This isn't a regional disruption. This is a global circulatory system shutting down.
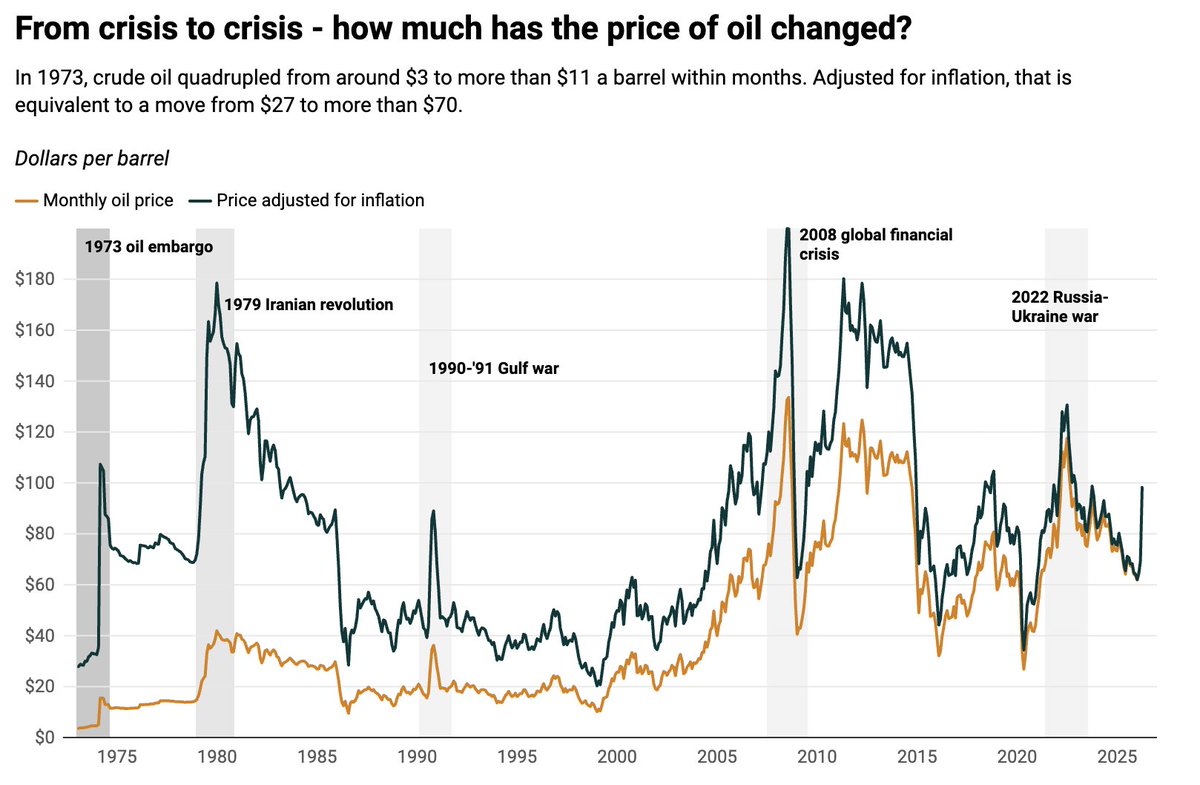
For context: the 1973 oil shock removed 4-6% of global supply from the market.
This one REMOVES nearly 20%.
Everyone says "Saudi Arabia has pipelines." True.
Here's what they don't tell you:
> Saudi Petroline: 3-5 mb/d spare capacity
> UAE ADCOP: 700k b/d spare capacity
> Total bypass capacity: 5.7 mb/d
Net shortfall: 14-16.5 MILLION barrels PER DAY.
There is NO REROUTING solution at this scale. None.
Brent was in the low $70s pre-conflict.
After February 28: +$20/bbl within a month. Briefly touched $120.
Current brokerage targets for Q2:
→ Goldman Sachs: $110
→ Morgan Stanley: $110 (rationing scenario)
→ Macquarie: $150+ if the Strait stays shut through April
WTI crossed $100 for the first time since July 2022.
If Brent stabilizes at $130-$150, the historical demand destruction level, headline CPI peaks near 3.8%.
At that point the Fed isn't cutting. It's hiking.
This is where it gets REALLY ugly.
Goldman Sachs has the numbers.
Here's what a 60-day closure does to US equities:
$SPX base case: 6,300 → 10% correction
$SPX severe case: 5,400 → 17-20% drawdown from RECENT peaks
The S&P already crossed below its 200-day moving average for the first time in 10 months.
That's not noise. That's a technical regime change.
And here's the historical precedent that should concern every tech holder:
Semis have experienced ~30% drawdowns during major oil price surges historically.
Several Magnificent 7 names are already down 10-20% from highs such as $MSFT $TSLA $META
Have in mind. I could be wrong. I'm only trying to provide the complete picture.
But in my opinion, we're not at the bottom, yet. We're at the technical inflection point.
IEA member countries released 400M barrels from emergency reserves to buffer the shock.
At a sustainable release rate of 4.4 mb/d, those buffers are projected to be exhausted by mid-April.
After that? No more cushion. Secondary price spike hits with NOTHING to absorb it.
Rate cuts are fully priced OUT of H1 2026. Morgan Stanley and Goldman both push the first cut to September or December at the earliest.
The Fed is frozen between an inflation spike and a deteriorating labor market.
That's the WORST possible backdrop for growth equities.
This isn't just an oil story.
The GCC exports:
→ 25% of global nitrogen fertilizers
→ 30% of the world's helium supply
→ 27% of global ammonia, 22% of phosphates, 45% of sulfur
Urea prices up 28% in three weeks. DAP/MAP above $700/MT.
Food inflation is coming, but it'll hit harvests in LATE 2026 and 2027. The market is not pricing this yet.
This is were inflation will begin to hike again, especially across the Eurozone.
Then there's helium. Qatar is a top global producer. Helium recovery is a byproduct of LNG processing.
No LNG throughput = helium shortage.
Helium is essential for advanced semiconductor lithography.
The entire AI buildout, from chip fabs like $NVDA to the infrastructure operators running on them like $IREN and $NBIS, has a Qatar helium dependency nobody mapped.
These cascading supply chain failures take 18+ months to resolve even if the Strait reopens tomorrow.
EVEN after this ends, the world that comes out the other side is different.
The Ras Laffan LNG complex lost 17% of Qatar's production capacity. Repair timeline: 3-5 years.
> Higher insurance premiums.
> Permanently elevated freight rates.
> Inventory buffers rebuilt everywhere.
> Semiconductor supply chains rerouted.
The Dallas Fed projects a sustained Q2 closure shaves at minimum 0.5 percentage points off US GDP, potentially pushing us toward stagnation.
This isn't a shock you trade through and forget.
Goldman's 5,400 scenario is live if we don't see resolution before the reserve buffer runs dry.
Mid-April is the deadline. Watch it closely.
I started investing in August 2024.
20 months in. Up 70% total.
YTD in one of the most brutal markets in years? -0.5%.
While a lot of portfolios are down 20-30% right now.
I'm not saying this to flex. I'm saying this because the whole point of this account is to think ahead of the market, not react to it.
Protecting capital in bad environments is just as important as finding the next 10-bagger.
If this thread gave you clarity, follow along. This is what I do every week.
-BP
Please note: This is not financial advice. Always do your own research.
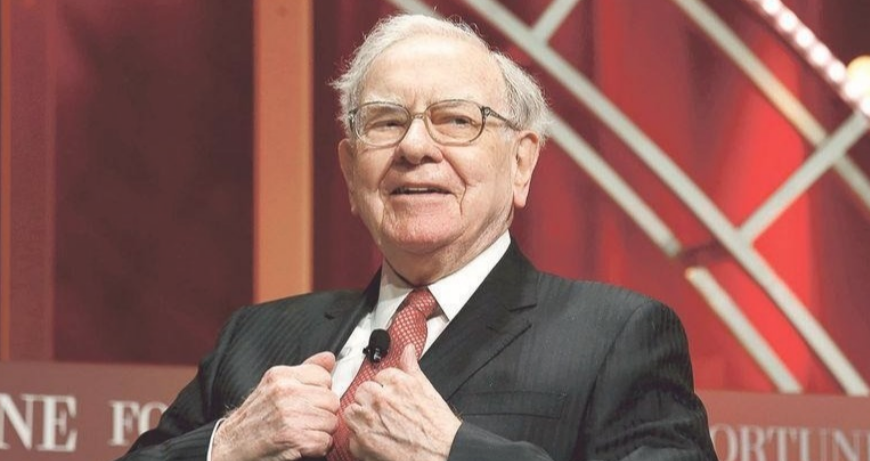
Warren Buffett said it best.
"Be fearful when others are greedy.
Be greedy when others are fearful."
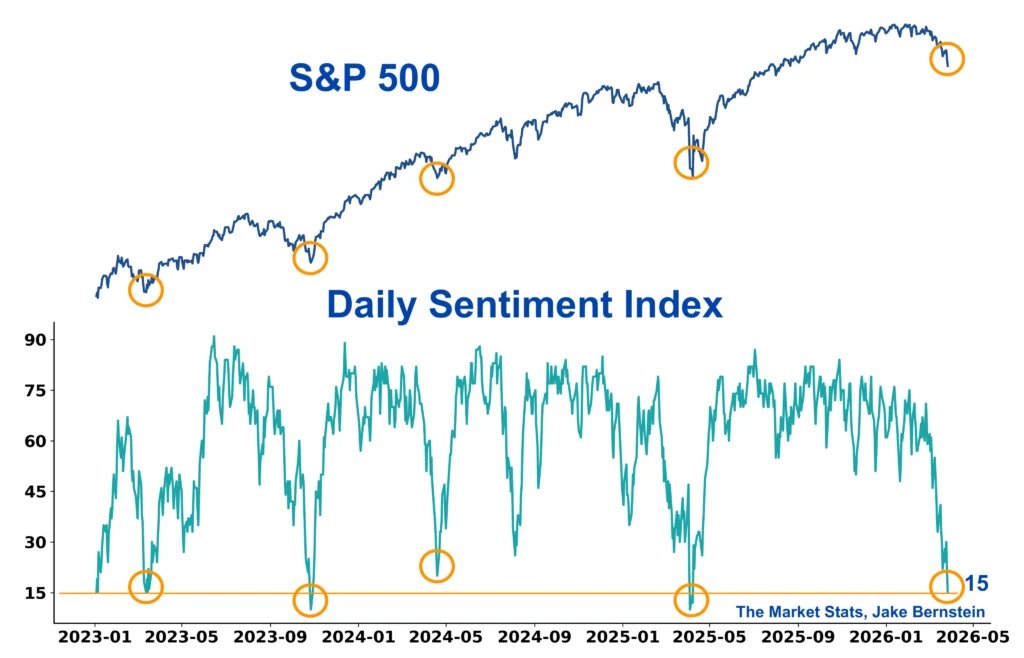
This chart shows exactly why.
Every orange circle = Daily Sentiment Index hits extreme fear (below 15)
Every orange circle = S&P 500 was at or near a local bottom
2023: Sentiment crashes → market bottoms → rips higher
2024: Sentiment crashes → market bottoms → rips higher
2025: Sentiment crashes → market bottoms → rips higher
2026: Sentiment just hit 15 again ✔️
Every. Single. Time.
Fear is not a reason to sell.
Fear IS the buying opportunity.
The most reliable signal in markets isn't an earnings report.
It isn't a Fed meeting.
It's the moment when everyone around you is convinced the world is ending.
That moment is now.
The Duopoly Portfolio
S&P Global & Moody’s $SPGI $MCO
Visa & Mastercard $V $MA
Eli Lilly & Novo Nordisk $LLY $NVO
Pepsi & Coca-Cola $PEP $KO
Thermo Fisher & Danaher $TMO $DHR
Cadence & Synopsys $CDNS $SNPS
Linde & Air Liquide $LIN $AI
L’Oreal & Estée Lauder $OR $EL
Why are duopolies so interesting?
1/ Wide moats.
They fend off competition, enjoy high margins, generate strong cash flows, and reinvest capital at high returns.
2/ Market share gains.
Companies can’t beat every competitor — so they target the weaker ones and avoid the stronger ones. Duopolies keep taking share from smaller rivals. The duopoly (or oligopoly) only gets stronger over time.
3/ Compounding — the biggest factor of all.
Because they’re high quality, quietly gaining share, and reinvesting at high returns, investors struggle to grasp the long-term power of compounding. They’re essentially cheap even when they don’t look it — because compounding does the heavy lifting over decades.
Example — 20-year ROIC comparison:
Company A @ 18% ROIC: $100 → $2,739
Company B @ 6% ROIC: $100 → $321
Quite a difference, right?