You should never take a big loss, no matter what.
It’s the golden rule of trading that any successful trader will tell you. Don’t take big losses.
I have taken so many small losses in my trading career and you know what? I don’t care because losers are an inevitable part of trading. What isn’t inevitable is big losses because we can ensure small losses don’t turn into big ones.
How? By selling at a small loss.
You should really only have four outcomes while trading:
Big win
Small win
Breakeven
Small loss
That’s it, big losses shouldn’t be an option. If you program yourself to not allow big losses your success will increase exponentially.
🚨 I'm launching an $OPEN podcast mini-series.
Goal is to do an episode a day over the next 2-3 wks with the people who matter most to the future of Opendoor.
Founders, leadership, investors, alumni.
I want to document what could go down as the greatest turnaround in business history:
- What's happening inside the company *right now*
- What the new CEO's first week has been like
- How long the turnaround will take
- Whether $OPEN can still disrupt the largest, undisrupted market in the U.S.
- Valuation going forward
First few interviews are booked.
Guest wish list: @nejatian@rabois@ericjackson@ericwu01@shrisha@yang_guo@APompliano@justindross @ihat @SebastianSzturo@Tyler_Okland_MD@jeffye888@gregw134
And yes, the bears are invited too: @MartinShkreli@gnoble79@CitronResearch
Depending on how FOMC is received here are a few nice small cap/high beta charts I’m seeing:
$LMND $SOUN $AAOI $RR $PONY $MP $EOSE $INOD $SEDG $BMNR
Ten names I’m focused on with great charts/themes. Even if we sell off a bit after FOMC, these big picture structures look great.
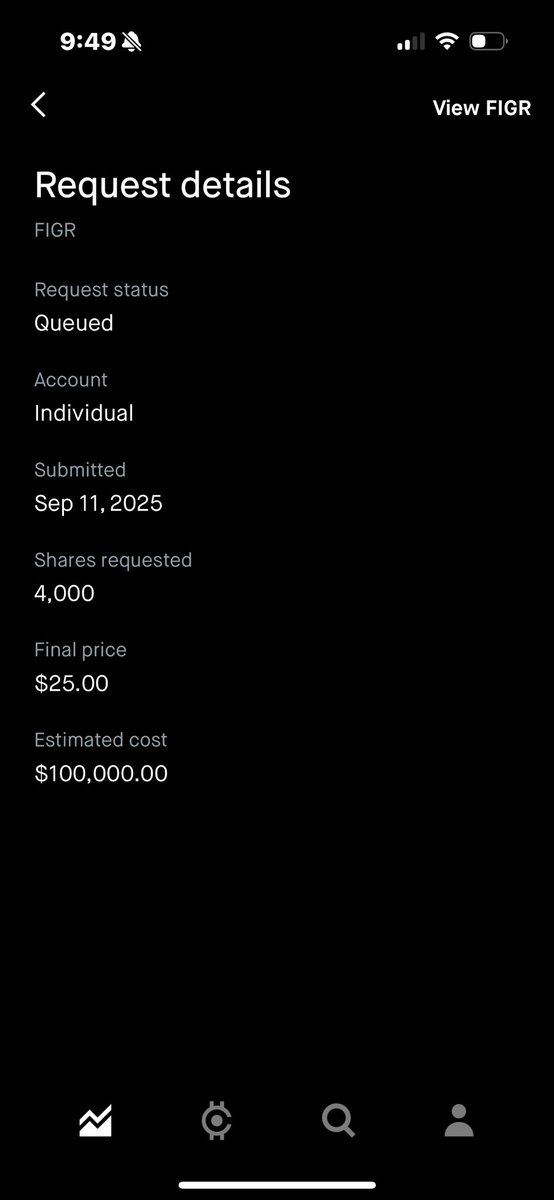
Did some research on $FIGR before going to bed.
Not too much potential upside from the IPO price. However, the capital efficiency and profitability is way better than $UPST. I’d choose FIGR over UPST for fintech trades.
I only requested 4k shares and will dump it tomorrow.
$SPY S&P500 index Day Trade principles
1. Forces Driving the Market
•Retail traders: Mostly option buyers in 0DTE, speculating on direction.
•Institutional big money: Sometimes sellers, sometimes buyers, depending on strategy and events.
•Market makers: Always the counterparty, their primary goal is to hedge risk.
Therefore, the daily SPX moves are the result of combined forces of all three groups, not dominated by one alone.
2. The Role of Market Makers
•In normal conditions (positive gamma environment)
•Market makers act as stabilizers.
•Their hedging activity (“sell high, buy low”) suppresses volatility and pins SPX near large OI strike levels.
•In extreme conditions (negative gamma environment)
•When price breaks through a key gamma level (e.g., put wall or call wall), the hedging logic flips.
•They are forced to “buy high, sell low,” which amplifies price movement.
3. The Nature of a Gamma Squeeze
•Price breaks key gamma level → market makers must chase the move with hedges.
•Volatility expands → the stabilizing force turns into an accelerating force.
•Result → rapid moves, known as a Gamma Squeeze.
This explains why:
•On normal days, SPX looks very stable, with suppressed volatility.
•But once gamma flips, SPX can experience sharp rallies or crashes intraday.
✅ Summary
•Institutional positioning (buy vs. sell 0DTE) is hard to judge daily.
•Market makers suppress volatility in most cases.
•If gamma is breached, market makers flip and amplify volatility → causing a Gamma Squeeze.
Safe Trading! 🤭
Buying the BreakOut (BO) After, or Before?
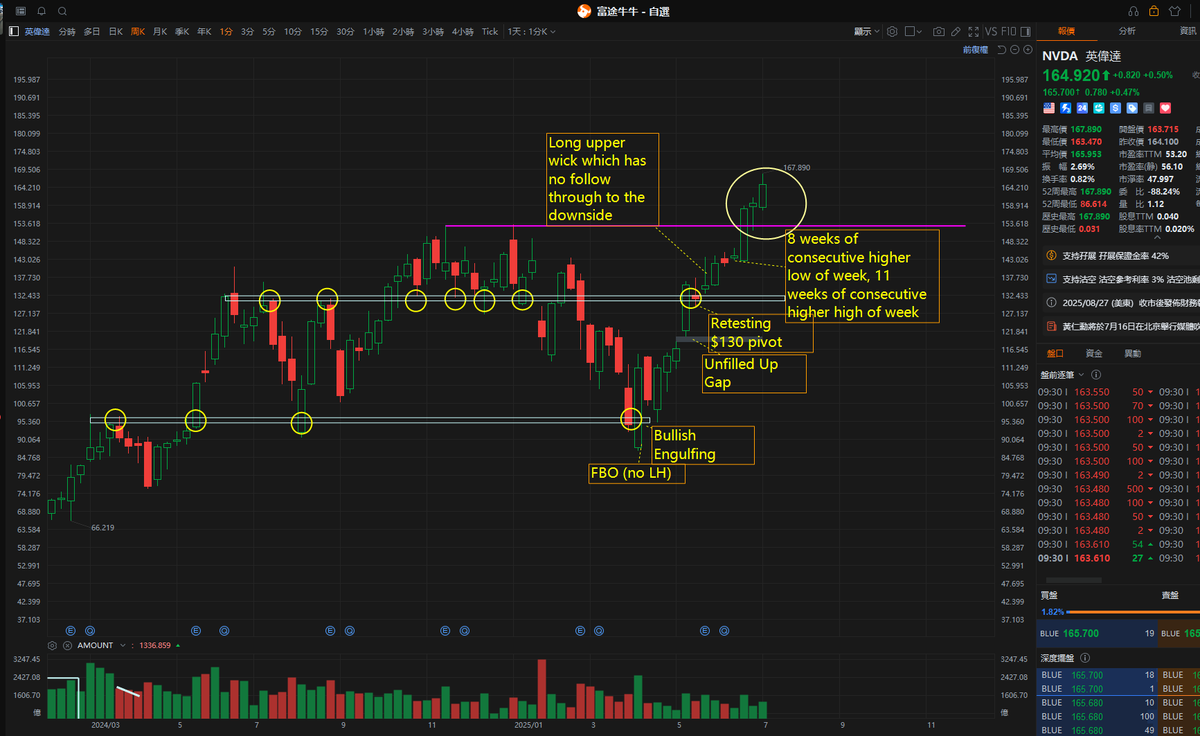
$NVDA as an example
A) 90% of BO fails (Fact or Myth?)
One of the great things I learned from @IamThomasWade is that 90% of the BreakOuts fail, and from then trading Failed BO (FBO) is now one of my strategies. And @TheMarketMemo once said the "correct" way to buy the BO is to buy it before it happens.
The combination of these becomes one of my many minor a-ha moments -> saved me a lot of dollars.
Definition of BO: I see BO as a BO from a range/ consolidation/ resistance. It could be a horizontal consolidation, triangle consolidation (with or without VCP.... how many times have you thought that it is a VCP then it just turned into another form of consolidation or digestion?), bullflag, wedge, or whatever.... does a circle pattern exist?
I don't trade patterns, I trade the context.
B) So, Before or After?
As usual I will conclude that there is no best strategy.
As usual there are many valid ways to make money from the market, the most important thing is to understand the strength and weakness in each of the method instead of blindly following it, and ultimately you have to know yourself and choose what you are comfortable with.
Personally, I do more of the Before BO, some on the BO and some on the PB from the After BO (on the same name, it could be split bets). This is due to both time zone and a longer investment timeframe (& of course my lowish technical competence). My actual real screen time is not more than the first 2 hours (usually just 30 minutes active screen time in total) of the market open, this makes the usual "buy on BO, then manage the position by trimming some into strength, setting SL on remaining, then re-enter if there is a trigger of SL but then reversal etc etc" a luxury for me.
C) How I buy Before BO
There is no Condition A + Condition B = Buy, as usual trading is an art. But in general, I buy on sensing that there is a shift in the balance of supply and demand to the upside. Some examples (still in general), which I don't think is exhaustive as I am just typing them out from personal memory:
1. The usual no volume and range getting tight
2. Final washout near range low with volume but no further price progression to the downside
3. Price trending up with HLs, or just visually in a big horizontal consolidation, you can see that on the right- hand side, the prices are now slanting towards the top right without giving back much. A change of character compared to the left-hand side. And prices start to "respect" more and more of the upward moving averages (but remember MA is a lagging indicator, just a tool to help you see what's happening).
4. Strength via unfilled gap(s) to the upside
5. Strength via immunity to bad news
6. Relative strength to the falling market
D) Example using $NVDA
Just thought of using my recent case with $NVDA, which I have been actively buying since 5/8/2025. Sometimes I just do my top up on strength and with a thesis that the money is coming back into the main AI theme. What other better validation you need for your thesis, other than price?
You can view the full one year of price movement say between $90ish to $150 as the horizontal consolidation. This is definitely a "big" case by time, and by size. For the other names, definitely not as "big" but the general concept of buying before BO is similar.
Most of the thoughts and bullish views on daily, weekly and monthly charts have been mentioned in the attached post, here in this post I am just putting in extra remarks on the charts for easy viewing.
1) Weekly Chart (sheer price action)
- FBO at low
- Bullish Engulfing in early April with volume
- unfilled up gap in early May
- a brief retest of an important $130 pivot
- long upper wick on weekly candle, which end up having no follow through to the downside but to the upside
- 8 weeks of consecutive higher low-of-the-week and now 11 weeks of consecutive higher high-of-the-week
Can you now see why I was bullish? How could I be bearish?
2) Daily Chart
1. 8ema is the white KMA to illustrate the strength.
2. Many unfilled gaps on daily chart before it has a BO from whether $130 pivot or the $150.
3. Breaking resistance without much retest e.g. 5/12 BO of an important DTL (drawn by connecting important bearish engulfing bars), only followed by another gap up the 2nd day
4. Earnings reaction - Despite the usual earnings volatility and amid the general market worries, ONLY TWO DAYS of bearish bars ABOVE 8ema. If you try to deduce 2 days of "normal" bearish bars as bearish I don't know what to say.
5. RS to the market
E) Final Words
Maybe this is a successful case which I cherry pick, but as usual in trading, there is nothing with 100% certainty. If it didn't work of course there will be many reasons that it didn't. But I hope this example helps you to understand my view.
Also remember that stock makes the chart, not the other way round. A quality name in the right theme, with great fundamental and macro behind it definitely has a higher success rate of a successful BO than a questionable small cap.
As usual, follow your process and do what you are comfortable with.