My model is predicting weakness in semiconductors throughout the month of July and a possible relief bounce in select oversold mega cap software names.
Hey $MU bulls, what is wrong with you guys? This is not the type of price action you want heading into an earnings report. All this "squeeze" is doing is raising the probability of earnings being a sell the news event regardless of if they beat or not.
A stock falls from 100 to 10. That's a 90% decline.
The investor buys in at 10 because it is indeed worth 30.
But it has fallen so much it has become detached from the underlying business and so falls to 5.. The value investor is down 50%.
Which isn't as bad as 90%, but is still 50 effing percent.
The value investor could have sold at 8, and limited the loss.
10 years later the stock is at $30. While said nvestor gies to medical school and finsihes residency to become a surgeon.
That's a six times return in 10 years. About 20% per year.
Wait, is it not only a triple?
No, because the investor could have sold at 5 like just about everyone else did, but did not.
What I describe here is almost exactly WBD. And it didn't take 10 years, because it usually doesn't.
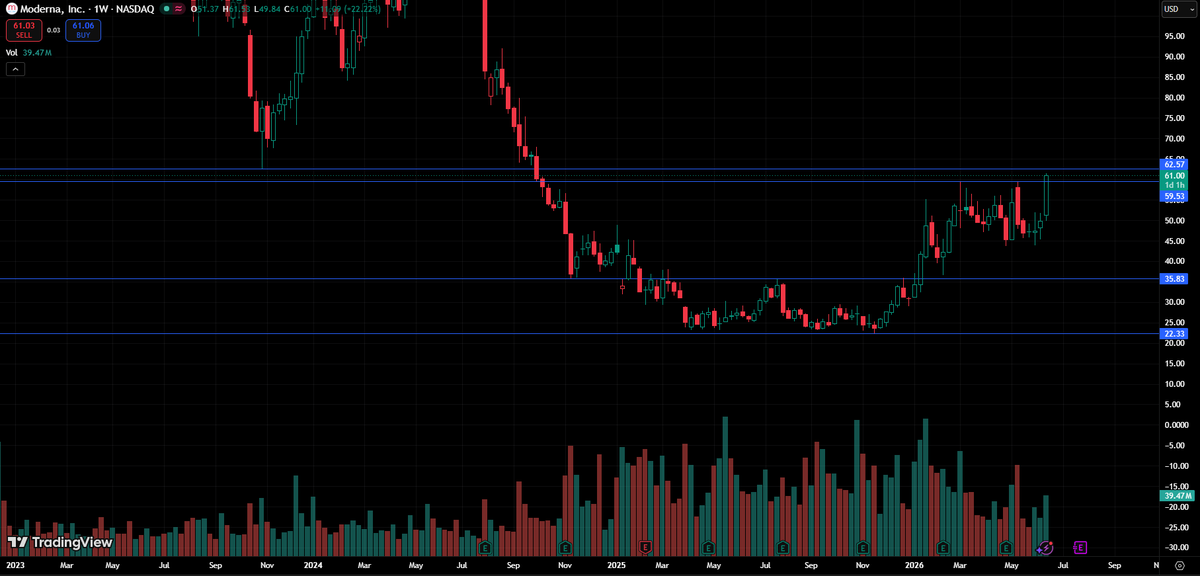
$MRNA is making new 52w highs with roughly 15% short interest.
From a technical perspective, there appears to be significant room above the $60–63 resistance area. If that level is cleared, the setup could become very interesting. Triple digits not out of question here.
Reaction to the "MOU":
1, it will be a sell-the-news event at open--and erase the gap within an hour.
2, the details of MOU won't be released after signing on Friday--that tells you how toxic the contents are.
3, Five days to sabortage the preconditions. A perfect bull trap.
Best case Warsh signals the end of the war shifts the FED policies to wait and see with a mid to long term focus on lowering rates.
Keep in mind Warsh asserted that artificial intelligence will act as a major disinflationary force in the long run.
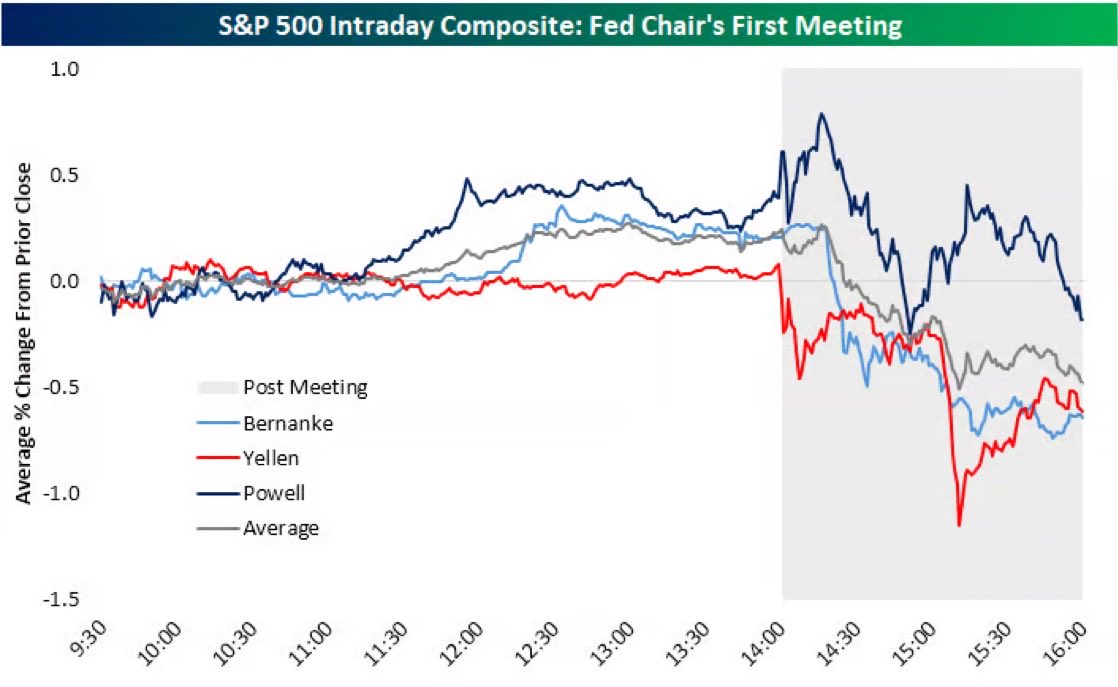
The first FED chair meeting is set for Tuesday.
Yields should drop sharply tomorrow due to the peace deal, it will be interesting to see how they continue into the week.
the real bottom signal was never going to be a quantum headline.
it's when three things line up: price hits realized price (the average on-chain cost basis), MVRV-Z collapses toward zero, and supply-in-loss spikes.
that combo marked 2011, 2015, 2018, 2022. nothing else has.
Fantastic. Finally an end to the mess of the Iran War. Hopefully it lasts this time. I'll believe it when I see it in action.
Market-wise, the market has already been soaring for a while now, so I wonder if much of it is priced in and we get an initial pump off the hype of the news, but maybe not lasting-- or it could even a "sell the news" local top on weekly or monthly charts once the dust settles.
Just spit-balling out loud.
My dear followers. We've had a very STRONG portfolio together.
Since the start of the June 5th decline until today:
- $SPY -2.03%
- Our portfolio -2.58%
- $QQQ (tech) -2.60%
- Other people/my friends are down -5% -20% since
Now, we need to STAY careful here.
The markets just CLOSED with a BEARISH engulfing candle AND a DOJI this week.
The last time this happened signaled a TOP back in 2022.
This is why we stay BALANCED right now until the markets can erase that bearish engulfing candle last week. This is VERY crucial. Bearish engulfing candles are very tough to deal with.
We hold:
1. AI 45%
2. Defensives 15%
3. Laggards 15%
4. Hedges 10%
5. Cash 15%
We stay STRONG during red days, and we OUTPERFORM during green days.
Next week's candle will give a lot of clues of what may come over the summer months.
As ALWAYS, I will update you every day so you are SAFE.
@ChartingBit Domanda offtopic: pensi sia meglio usare okx europe per i perpetual futures oppure hyperliquid? Leggevo su trustpilot che okx talvolta blocca i fondi ingiustamente, ma hyperliquid ho paura che non essendo mica compliant venga bloccato dalle autorità europee in futuro.
Using Realized Market Cap, I've created the simple bands, different from the Magic Bands, which use Volume and are more specific.
It's nice to have easy, effective price models, which this does well. A cycle bottom band, a top band, and a midline.
Price just broke below the mid-line, which is standard for halfway through the bear market. That's a common theme of current data.
The cycle bottom band is usually visited twice, and it's currently at 42k. A plausible cycle bottom price.
Metrics like this almost make it look too easy; it's the narratives (super cycle and super doom) that keep it running.
I've closed my short on $BTC on bybit, a bounce from here is possible, it's very oversold, instead if 60K are broken next stop should be $48k, however I decided to settle for this 225%.