v0.12.0 is live with major updates:
📚 Version History: Restore any document version with a single click.
💬 Inline Comments: Leave feedback directly on the page.
⏺️ AI Meeting Notes: Multilingual transcripts now support Spanish, German, French, Italian, and Portuguese.
🛠️ Loads of database improvements and 30+ bug fixes.
Find our complete new feature list here: https://t.co/uouQ4sIGiU
v0.10.0 is out!
🙋Person, a new database property
- Assign a task to one or more collaborators
- Toggle off notifications when you’re not ready to notify collaborators
📱 iOS and Android Widgets & Share to
- Choose from three types of widgets for your home screen: Recents, Favorites, and Page
- Quickly save a webpage with optional notes to a target AppFlowy page or database
Explaining 9 types of API testing. The method to download the high-resolution PDF is available at the end.
🔹 Smoke Testing
This is done after API development is complete. Simply validate if the APIs are working and nothing breaks.
🔹 Functional Testing
This creates a test plan based on the functional requirements and compares the results with the expected results.
🔹 Integration Testing
This test combines several API calls to perform end-to-end tests. The intra-service communications and data transmissions are tested.
🔹 Regression Testing
This test ensures that bug fixes or new features shouldn’t break the existing behaviors of APIs.
🔹 Load Testing
This tests applications’ performance by simulating different loads. Then we can calculate the capacity of the application.
🔹 Stress Testing
We deliberately create high loads to the APIs and test if the APIs are able to function normally.
🔹 Security Testing
This tests the APIs against all possible external threats.
🔹 UI Testing
This tests the UI interactions with the APIs to make sure the data can be displayed properly.
🔹 Fuzz Testing
This injects invalid or unexpected input data into the API and tries to crash the API. In this way, it identifies the API vulnerabilities.
Subscribe to our newsletter to download the 𝐡𝐢𝐠𝐡-𝐫𝐞𝐬𝐨𝐥𝐮𝐭𝐢𝐨𝐧 𝐜𝐡𝐞𝐚𝐭 𝐬𝐡𝐞𝐞𝐭. After signing up, find the download link on the success page: https://t.co/LZvUK3yNjV
Today I discovered a fancy tool for viewing log files!
🦀 tailspin: A log file highlighter - written in Rust.
🍰 No setup or config required.
⚙️ Highlights numbers, dates, IP-addresses, UUIDs, URLs and more
🧬 Customizable & easy to integrate.
⭐ GitHub: https://t.co/ZRw1399bqp
#rustlang #log #file #linux #commandline #tool
Logging, tracing and metrics are 3 pillars of system observability.
The diagram below shows their definitions and typical architectures.
🔹 Logging
Logging records discrete events in the system. For example, we can record an incoming request or a visit to databases as events. It has the highest volume. ELK (Elastic-Logstash-Kibana) stack is often used to build a log analysis platform. We often define a standardized logging format for different teams to implement, so that we can leverage keywords when searching among massive amounts of logs.
🔹 Tracing
Tracing is usually request-scoped. For example, a user request goes through the API gateway, load balancer, service A, service B, and database, which can be visualized in the tracing systems. This is useful when we are trying to identify the bottlenecks in the system. We use OpenTelemetry to showcase the typical architecture, which unifies the 3 pillars in a single framework.
🔹 Metrics
Metrics are usually aggregatable information from the system. For example, service QPS, API responsiveness, service latency, etc. The raw data is recorded in time-series databases like InfluxDB. Prometheus pulls the data and transforms the data based on pre-defined alerting rules. Then the data is sent to Grafana for display or to the alert manager which then sends out email, SMS, or Slack notifications or alerts.
🔹 Over to you: Which tools have you used for system monitoring?
--
Subscribe to our weekly newsletter to get a Free System Design PDF (158 pages): https://t.co/uc5M7CdXXC
Rust 1.75.0 is now available! 🦀✨
Traits now support `async fn` and `-> impl Trait` (with some limitations), the compiler got faster, `version =` in Cargo.toml is now optional, and many small functions have been stabilized!
Check out the announcement:
https://t.co/IDTdQm9jdZ
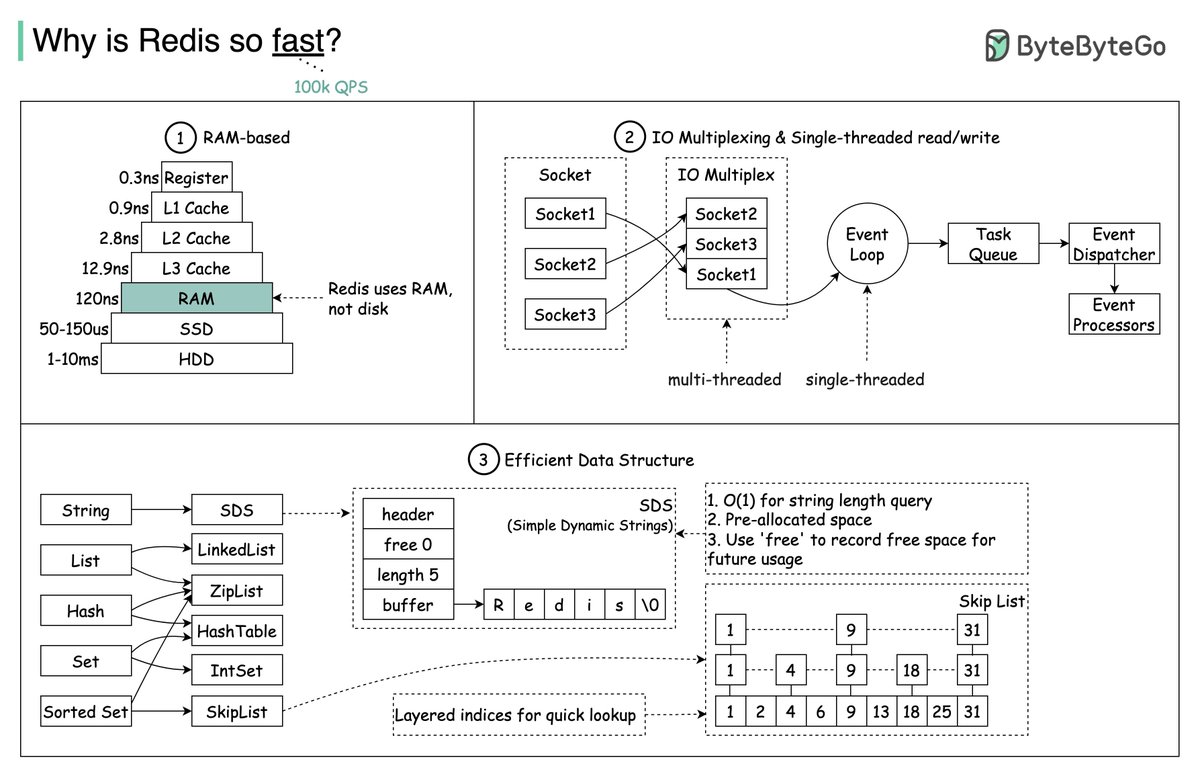
Why is Redis Fast?
Redis is fast for in-memory data storage. Its speed has made it popular for caching, session storage, and real-time analytics. But what gives Redis its blazing speed? Let's explore:
RAM-Based Storage
At its core, Redis primarily uses main memory for storing data. Accessing data from RAM is orders of magnitude faster than from disk. This is a major reason for Redis's speed.
However, RAM is volatile. To persist data, Redis supports disk snapshots and append-only file logging. This combines RAM's performance with disk's permanence.
There is a tradeoff though - recovery from disk is slow. If a Redis instance fails, restarting from disk can be slow compared to failing over to a replica instance fully in memory. So while Redis offers durability via disk, it comes at the cost of slower recovery.
A better solution is Redis replication. With a synchronized replica kept in memory, failover is instant with no rehydration. This maintains speed and near-instant recovery.
IO Multiplexing & Single-threaded Read/Write
Redis uses an event-driven, single-threaded model for its core operations. A main event loop handles all client requests and data operations sequentially. This single-threaded execution avoids context switching and synchronization overhead typical of multi-threaded systems.
Redis uses non-blocking I/O to handle multiple connections asynchronously. This allows it to support many client connections with very low overhead,
Redis does leverage threading in certain areas:
- Background tasks like taking snapshots.
- I/O threads are used for certain operations.
- Modules can use threads.
- Since Redis 6.0, it supports multi-threaded I/O for network communication, improving performance on multi-core systems.
Redis also uses pipelining for high throughput. Clients pipeline commands without waiting for each response. This allows more efficient network round trips, boosting overall performance.
Efficient Data Structures
Redis supports various optimized data structures, from linked lists, zip lists, and skip lists to sets, hashes, and sorted sets, among others. Each is carefully designed for specific use cases for quick and efficient data access.
Over to you: With Redis now supporting some multi-threading, how should we configure it to fully utilize all the CPU cores of modern hardware when deploying in production?
–
Subscribe to our weekly newsletter to get a Free System Design PDF (158 pages): https://t.co/kNfv0DVDdf
𝗪𝗵𝗮𝘁 𝗶𝘀 𝗖𝗿𝗼𝘀𝘀-𝗢𝗿𝗶𝗴𝗶𝗻 𝗥𝗲𝘀𝗼𝘂𝗿𝗰𝗲 𝗦𝗵𝗮𝗿𝗶𝗻𝗴 (𝗖𝗢𝗥𝗦)?
Browsers use CORS, a method, to prevent websites from requesting data from different URLs. A request from a browser includes an origin header in the request message. The browser allows it if it gets to the server of the exact origin; if not, the browser blocks it.
We can deal with CORS issues on the backend. Cross-origin requests require that the values for origin and 𝗔𝗰𝗰𝗲𝘀𝘀-𝗖𝗼𝗻𝘁𝗿𝗼𝗹-𝗔𝗹𝗹𝗼𝘄-𝗢𝗿𝗶𝗴𝗶𝗻 in the response headers match and it is set by the server. When you add an origin to the backend code, the CORS middleware only permits this URL to communicate with other origins and utilize it for cross-origin resource requests.
There are two ways to fix CORS issues:
𝟭. 𝗖𝗼𝗻𝗳𝗶𝗴𝘂𝗿𝗲 𝘁𝗵𝗲 𝗕𝗮𝗰𝗸𝗲𝗻𝗱 𝘁𝗼 𝗔𝗹𝗹𝗼𝘄 𝗖𝗢𝗥𝗦
Server can let all domains with 𝗔𝗰𝗰𝗲𝘀𝘀-𝗖𝗼𝗻𝘁𝗿𝗼𝗹-𝗔𝗹𝗹𝗼𝘄-𝗢𝗿𝗶𝗴𝗶𝗻: *. This actually turns off same-origin policy, which is not recommended. Another optin would be only to allow particular domain, which is better option, e.g., 𝗔𝗰𝗰𝗲𝘀𝘀-𝗖𝗼𝗻𝘁𝗿𝗼𝗹-𝗔𝗹𝗹𝗼𝘄-𝗢𝗿𝗶𝗴𝗶𝗻: 𝗵𝘁𝘁𝗽𝘀://𝘀𝗼𝗺𝗲𝗱𝗼𝗺𝗮𝗶𝗻.𝗰𝗼𝗺.
𝟮. 𝗨𝘀𝗲 𝗮 𝗣𝗿𝗼𝘅𝘆 𝗦𝗲𝗿𝘃𝗲𝗿
We can use a proxy server to call external API. It acts as a middleware between client and the server. If the server doesn't return proper headers defined by CORS, we can add them in the proxy.
Image credits: RapidAPI
#softwareengineering #programming #api #apidesign #techworldwithmilan
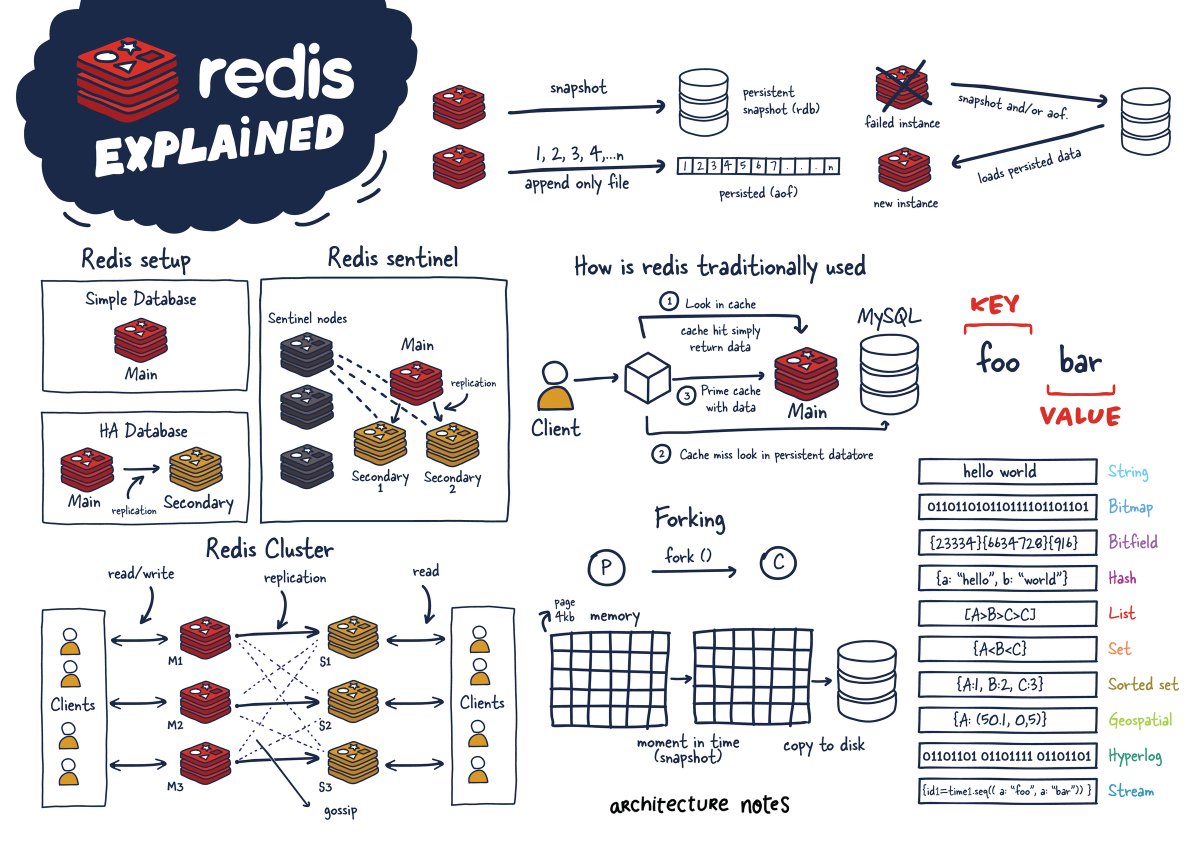
Some (really) good Redis stuff from Architecture Notes ❤️🔥
- What is Redis
- When to use Redis
- Redis Architecture(s)
- Redis Persistence Models
- ...and more!
Solid write-up with tons of visuals 👇
https://t.co/RI0sTryAOA
Explaining 9 types of API testing. The method to download the high-resolution PDF is available at the end.
🔹 Smoke Testing
This is done after API development is complete. Simply validate if the APIs are working and nothing breaks.
🔹 Functional Testing
This creates a test plan based on the functional requirements and compares the results with the expected results.
🔹 Integration Testing
This test combines several API calls to perform end-to-end tests. The intra-service communications and data transmissions are tested.
🔹 Regression Testing
This test ensures that bug fixes or new features shouldn’t break the existing behaviors of APIs.
🔹 Load Testing
This tests applications’ performance by simulating different loads. Then we can calculate the capacity of the application.
🔹 Stress Testing
We deliberately create high loads to the APIs and test if the APIs are able to function normally.
🔹 Security Testing
This tests the APIs against all possible external threats.
🔹 UI Testing
This tests the UI interactions with the APIs to make sure the data can be displayed properly.
🔹 Fuzz Testing
This injects invalid or unexpected input data into the API and tries to crash the API. In this way, it identifies the API vulnerabilities.
Subscribe to our newsletter to download the 𝐡𝐢𝐠𝐡-𝐫𝐞𝐬𝐨𝐥𝐮𝐭𝐢𝐨𝐧 𝐜𝐡𝐞𝐚𝐭 𝐬𝐡𝐞𝐞𝐭. After signing up, find the download link on the success page: https://t.co/Zx9BH4M3Qm
A handy cheat sheet for the most popular cloud services (2023 edition). The method to download the high-resolution PDF is available at the end.
What’s included?
- AWS, Azure, Google Cloud, Oracle Cloud, Alibaba Cloud
- Cloud servers
- Databases
- Message queues and streaming platforms
- Load balancing, DNS routing software
- Security
- Monitoring
Over to you - which company is the best at naming things?
Subscribe to our newsletter to download the 𝐡𝐢𝐠𝐡-𝐫𝐞𝐬𝐨𝐥𝐮𝐭𝐢𝐨𝐧 𝐜𝐡𝐞𝐚𝐭 𝐬𝐡𝐞𝐞𝐭. After signing up, find the download link on the success page: https://t.co/WTardhpI8I
Best ways to test system functionality
Testing system functionality is a crucial step in software development and engineering processes.
It ensures that a system or software application performs as expected, meets user requirements, and operates reliably.
Here we delve into the best ways:
1. Unit Testing: Ensures individual code components work correctly in isolation.
2. Integration Testing: Verifies that different system parts function seamlessly together.
3. System Testing: Assesses the entire system's compliance with user requirements and performance.
4. Load Testing: Tests a system's ability to handle high workloads and identifies performance issues.
5. Error Testing: Evaluates how the software handles invalid inputs and error conditions.
6. Test Automation: Automates test case execution for efficiency, repeatability, and error reduction.
Over to you: How do you approach testing system functionality in your software development or engineering projects?
–
Subscribe to our weekly newsletter to get a Free System Design PDF (158 pages): https://t.co/uc5M7CdXXC
API architectural styles are one of key factors behind seamless applications.
Tomorrow thousands of subscribers will learn about the most prominent API architectural styles.
Join us to get the issue: https://t.co/pVm7JLY5Rf