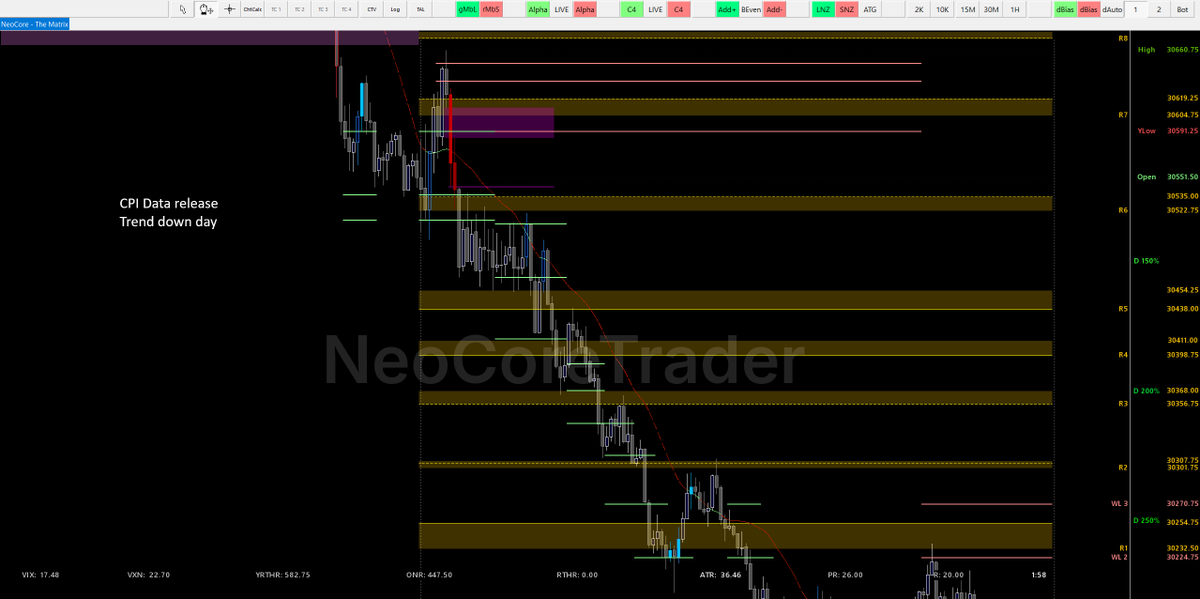
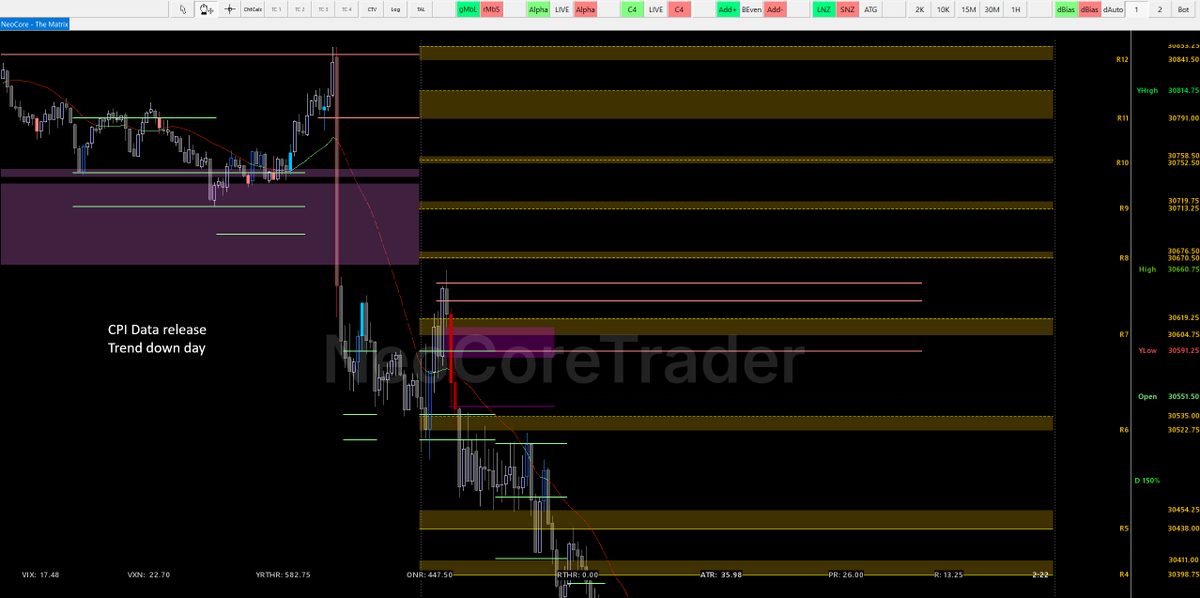
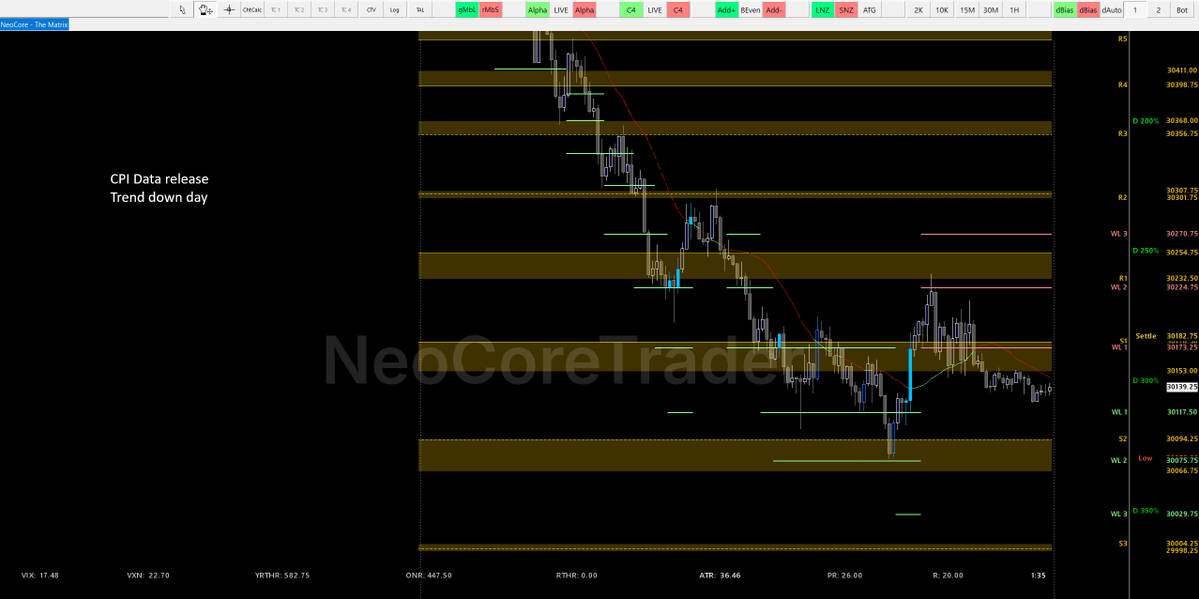
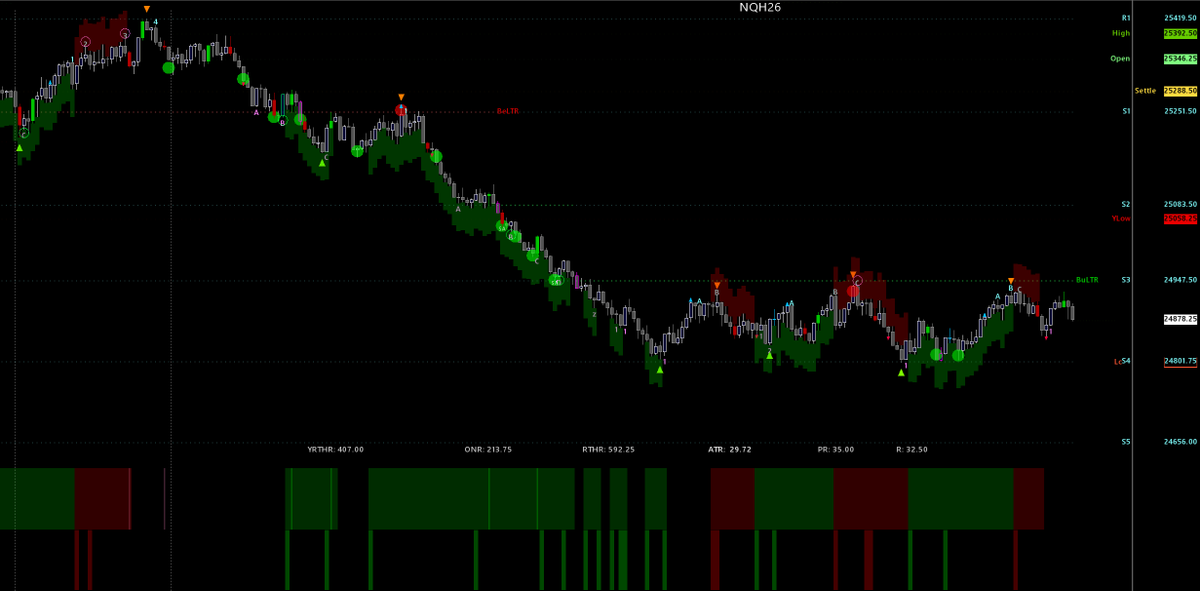
3+ years. Hundreds of layouts. Close to 100 custom indicators.
This is the best version I’ve built, and I’m only showing the essentials.
Yesterday: CPI day, trend down. Can you see where price reacts, zone to zone? 🧵
Educational only. Not advice.
$NQ_F $ES_F
I’m starting to see repeatable patterns. What I’m missing is context. Someone with better context may find this easier, especially next to a footprint chart (I run one side by side, not shown).
Would this help your trading?
Like/repost/follow if you want to see more.
3+ years. Hundreds of layouts. Close to 100 custom indicators.
This is the best version I’ve built, and I’m only showing the essentials.
Yesterday: CPI day, trend down. Can you see where price reacts, zone to zone? 🧵
Educational only. Not advice.
$NQ_F $ES_F
What I learned: it doesn’t matter how good a chart looks. What matters is how well it helps you execute. For me (N = 1), this layout does that best so far.
So I’m done building indicators. Time to focus on execution.
I post every trade I take in the Chart Fanatics Discord. Wins, losses and breakevens.
These 5 rules are behind all of them. None of them are exciting, and that's exactly why they last.
Bookmark this and read it again before your next trade.
A 1988 Chicago Trading Pit documentary accidentally described the exact reason 90 percent of modern retail traders will never stop until they blow up.
The film was shot in the peak years of open outcry, back when trading meant shouting yourself hoarse in a physical pit, taking speech therapy at Schwab Rehabilitation Center, and sometimes ending up in the medic's chair with a busted lip from a fistfight over a trade.
At 16:34 in the film above, one trader said this.
"When I first started I heard stories of other traders making 50 or 100 thousand a day. I said if I made that kind of money I would quit. I would take the summer off. When I had my first five-figure day, ten thousand plus, I found myself in the pit the next day."
He made his summer's worth of money in one session. He came back the next morning.
Every retail trader today who says "if I just double my account I'll cash out" is that trader. Every day-trader who promised themselves they would quit after their first six-figure year is that trader. Every options gambler who tells their spouse "one more good week and I stop" is that trader.
The 1988 documentary called it the game. The people who stayed in it called it being a gladiator. The paramedics on duty at the exchange called it a job.
Modern brokers call it engagement. Every Robinhood push notification is designed to reproduce the pit floor without the paramedics.
That single confession from a Chicago pit trader in 1988 has probably explained the last four decades of retail blowups better than every behavioral finance textbook combined.
Retail traders build spreadsheets tracking P&L in real time because they cannot look away from the score. Options traders open the app on the toilet because the pit is now in their pocket. Prop shop hires get told the money is what matters when the actual driver is the same dopamine that trapped the 1988 gladiator.
The full 19-minute documentary is above. Almost none of the viewers have actually asked themselves what number would make them walk.
The framework is free. The willingness to actually name the number that ends the game before you get there is the entire edge.
I often feel like a bit of an imposter commenting on Canadian politics as I am not Canadian myself. But I really do love the country, own a bunch of real estate there, have a lot of Canuck friends, and did send my four kids (who do have Canadian passports) to boarding school there… all this as a prelude to my take on the US-Canada trade war, that I fervently hope will be the start of something better for Canada?
Piece unlocked below:
https://t.co/CUQJhygqrG
The VIX and COR3M typically move together.
But every once in a while, that 20-day positive correlation breaks. The last few times it did, they turned out to be warning shots for a higher VIX shortly after.
Every red circle on this chart is one of those breaks. The blue arrows show what VIX did next.
Question is, will it have a similar effect this time around?
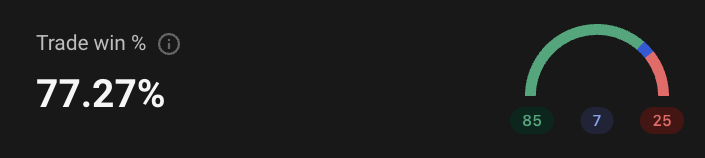
I have 77% win rate because of this simple and repeatable strategy.
I only trade $NQ
I trade inside the same window everyday (9:30 - 11:00am EST time)
I mark higher TF main key liquidity levels
Then I go to lower TF (1-5min) and wait for price to sweep key level
Once the level is swept I wait for price to form a FVG and enter long/short once that gap is inversed
Target is always either 1RR or 2RR
Repeat the same process over and over again...
Market delivers on a silver platter. This has been a staple for me the past 30 years. If no trade to pit session 15 minute EMA on a trend day , it WILL revert to the mean the next day.
Some random guy on the internet 4.5 years ago made an algorithm that automatically calculates levels. For example yesterday after close, these were today's levels. Worked out well.
He gave this indicator out for free and even teaches you how to use it for free too. Nice guy.
This 1-hour MIT lecture by Jim Simons is like getting a masterclass from Kasparov - except the board is financial market.
Quant King reveals more about quant trading than most Wall Street players pick up in an entire career.
Bookmark it. Watch it. Then read the article below.
Most people think preparing for a bounce in a bearish market is irresponsible. I think starting the process early is what separates you from the crowd that's always one step behind.
If you're short, you need to know when it might be time to cover. If you're getting very bearish, you need to understand it's usually a bad idea to short in the hole. And if you're trying to buy the bounce, you really need to check yourself. Do you actually think the market is just going to hand you an easy entry? It's not.
What usually happens before a bounce: the market shakes you out of your premature, oversized position, then leaves without you after you panic sell. That's by design. These aren't clean, comfortable entries.
If you're not a tactical trader, the simplest move is to sit on the sidelines and wait for the shorter term trend, something like the 5 day moving average
(purple line), to flatten out and start turning back up. That's your signal that the shorter term conditions are potentially shifting.
If you like to front run, you have to accept a few things. You're going to be starting a position when everyone tells you it's stupid. It's going to feel awful. Of course it's not going to be a comfortable transaction, that's the whole point. To make it manageable, you size down in elevated vol. You can always add when conditions improve.
The real pain isn't being early and wrong, that's manageable. The real pain is watching a lockout rally rip without you and feeling forced to chase. Fight that urge. If you miss it, who cares. The market is not going anywhere and It will setup again.
Not going to pretend that I've got this even though I've been working on it for over 3 years, but I am starting to see patterns I might be able to trade with.
There's still lots of work to be done with trade executions. Another 3 years? Shorter hopefully!
Thank you in advance!
BAD NFP numbers ahead. Coming out Wednesday.
Let's see if this is what will trigger Market Panic.
But likely also a reaction from FED - which sends stocks into the stratosphere - one last time.