708 sophisticated investor. 27 years investing & trading micro cap stocks . Die hard silver stacker. Zero carb carnivore. Entertainment content only! 日本語OK
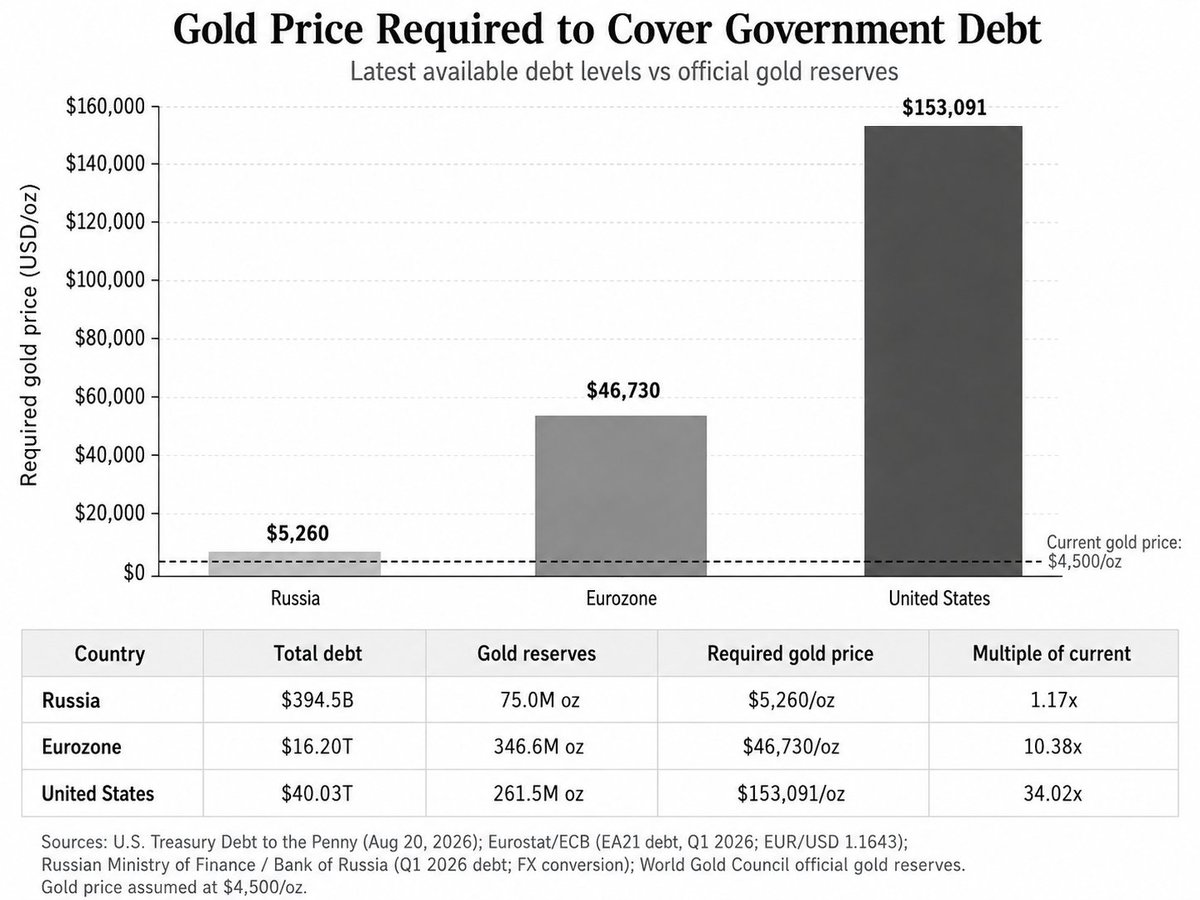
Gold prices needed to wipe out all federal debt:
- Russia: $5,3K
- Eurozone: $44.7K
- United States: $153K
Rising gold prices can solve global debt problems,
as a rise in prices doesn’t hurt any industry.
- No factories shut down because gold goes up.
- No inflation
- No crisis
Just gold prices rising significantly
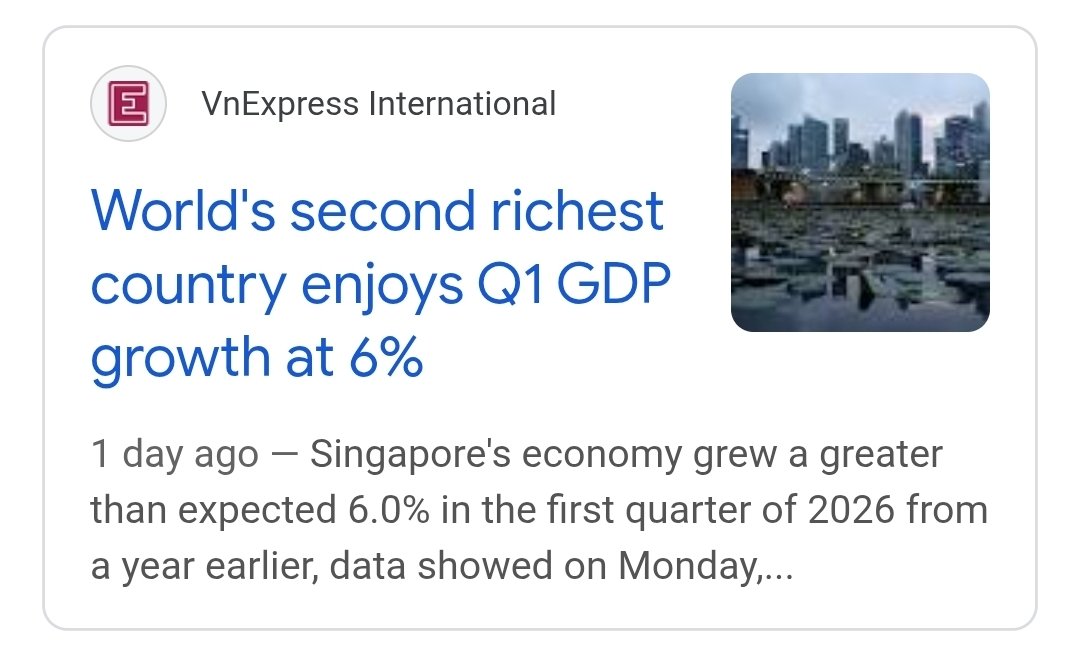
Singapore has no CGT. It was poorer than Australia per capita and now it is almost twice as rich. They didn't do it by taxing everyone harder. Jim Chalmers and Albo take note.
Commodities follow a 30 year cycle - 15 years up, 15 years down. The previous top was in 2011. This means the bottom happened recently (which is obvious now). More importantly, this means commodity prices will rise for the next 15 years. Dan Krupka
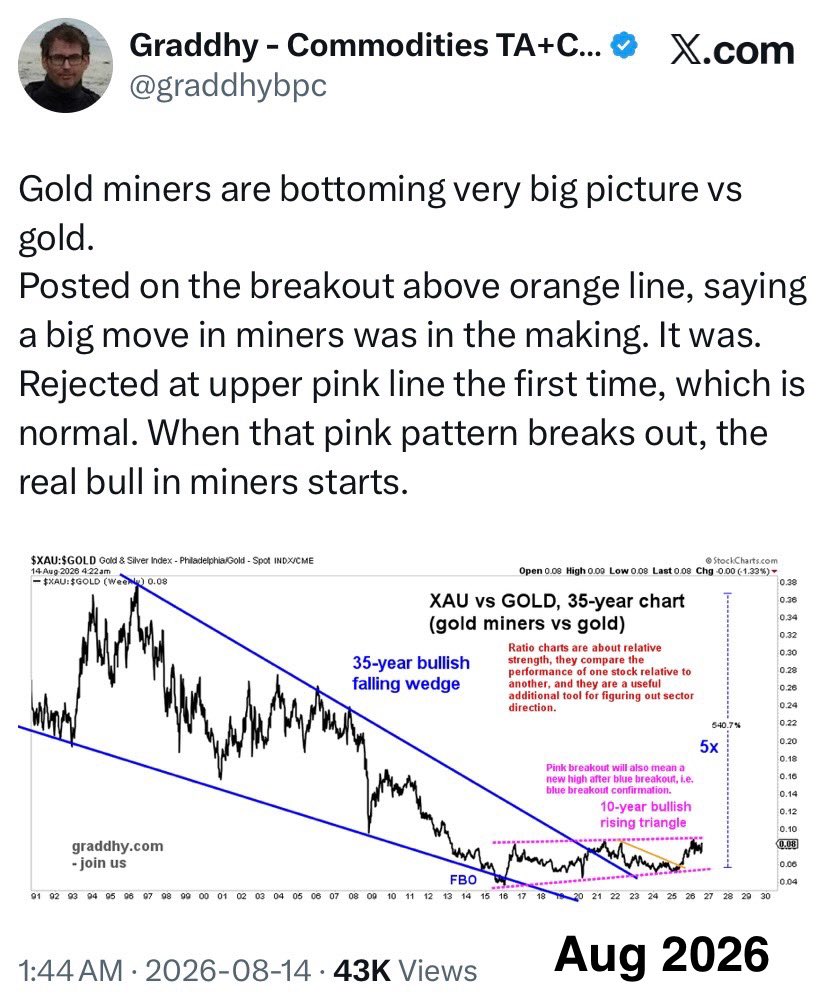
Gold vs. Stocks may be entering a regime change.
The $Gold / $SPX ratio has spent decades below a secular resistance line that connects the 1980 and 2011 peaks.
Now, for the first time in years, the ratio is pressing against it again.
A breakout could mark the beginning of a major capital shift toward hard assets.
If this resistance breaks, are your portfolios prepared for that kind of shift?
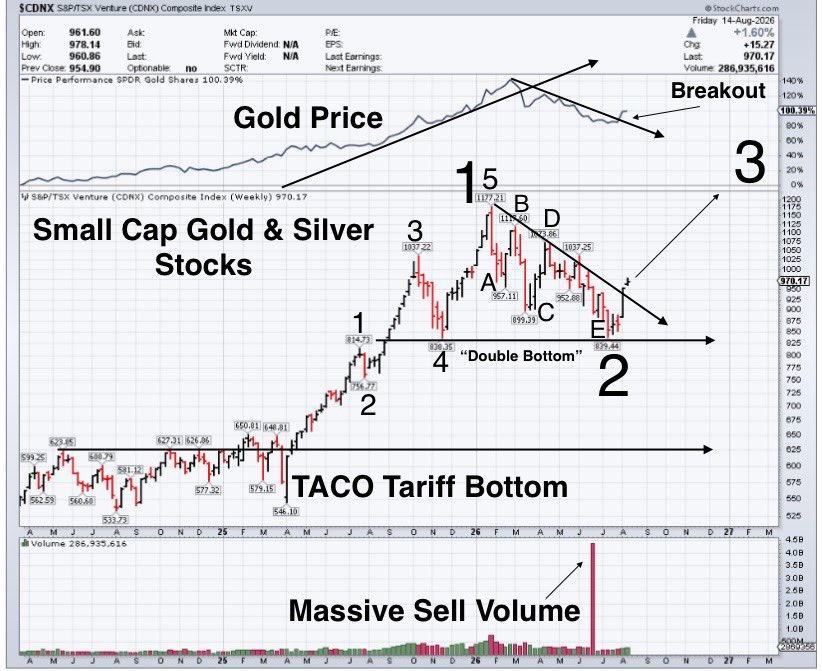
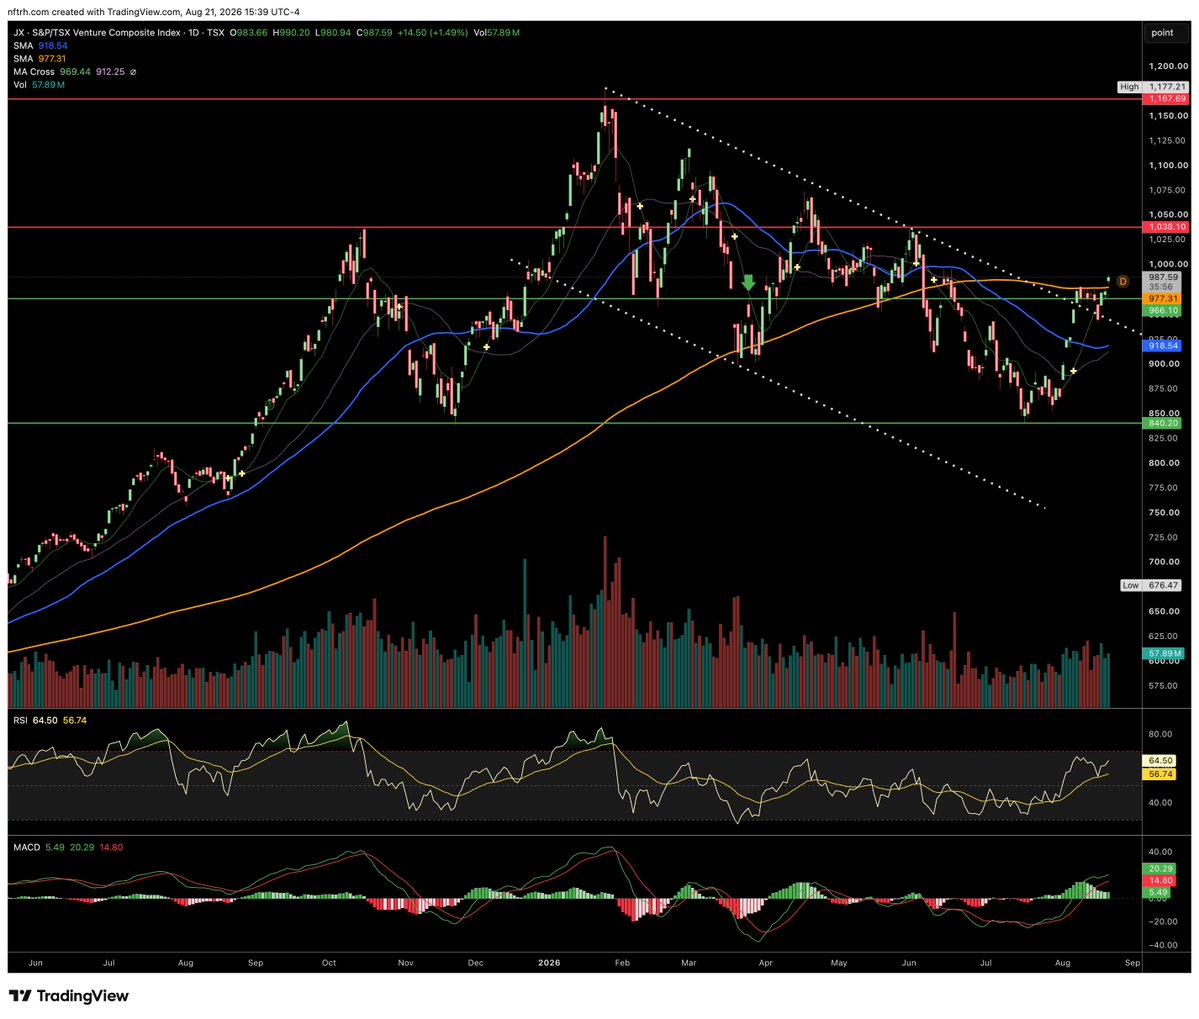
$CDNX ~ Small Cap #Gold & #Silver stocks index. Weekly Close. Up 1.60% last week. Looks like the longer (abcde) Major (Wave 2) bottom is in. Notice the textbook (Double Bottom) at the 830 level. I’ve started accumulating 2029 calls in $SLV $GLD $GDX at various strike prices $SILJ
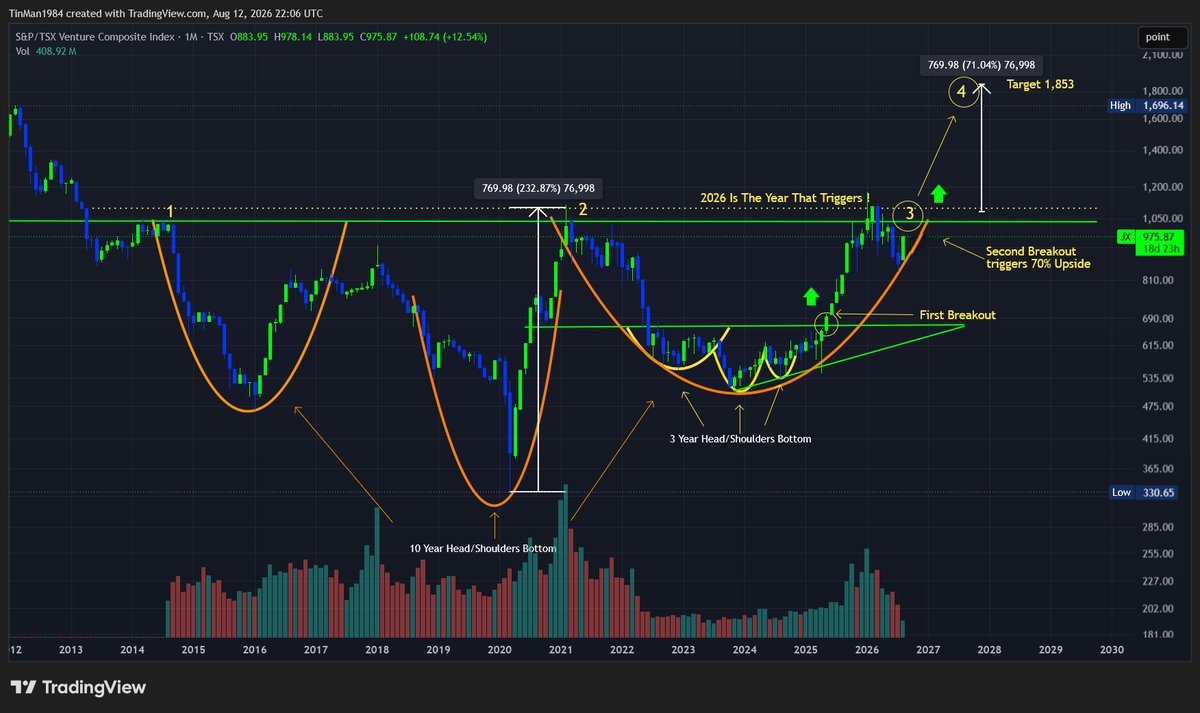
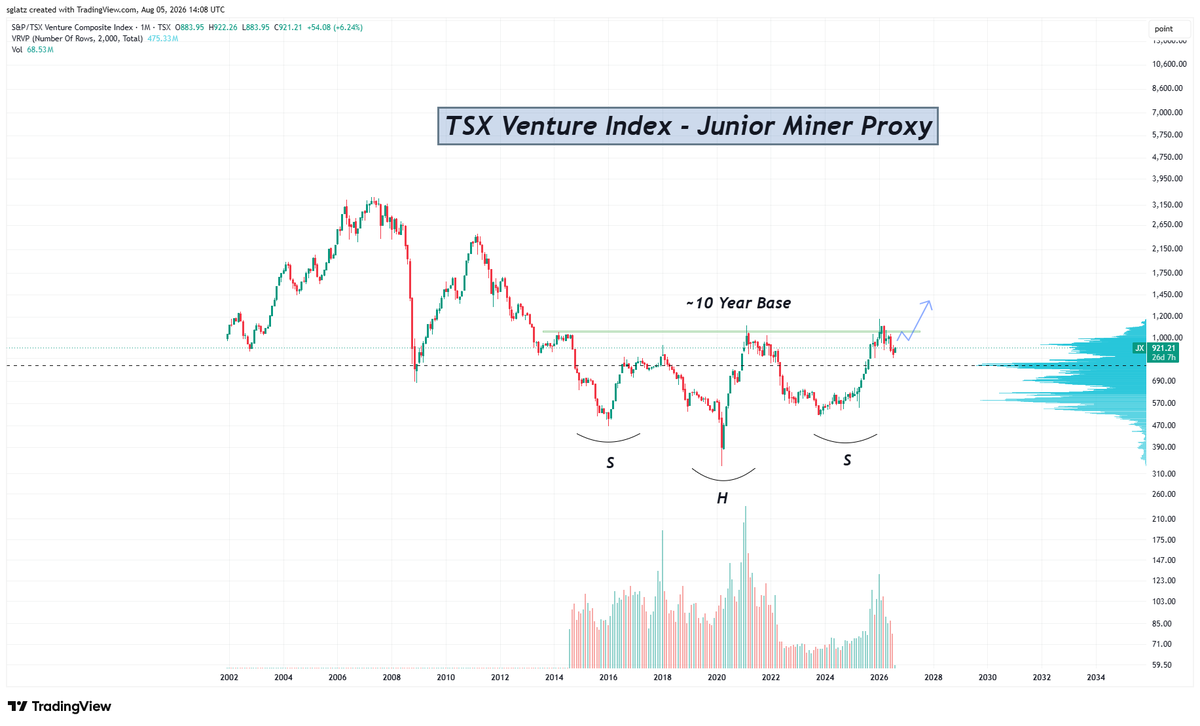
You have no idea what fortunes you will make in gold, silver, and mining when the Canadian Venture Exchange breaks out of this 12 year base. The ramifications are staggering.
FREE ANALYSIS in our new podcast ⤵️
https://t.co/vHklzfktAx
Canadian Venture Exchange $TSXV Building for a final test and breakout into a generational bull move. #Gold#Silver#Copper#Commodity Juniors will return staggering gains for investors 💪. 5, 8, 10x will not be unusual.
When Hitler invaded Poland, John Templeton borrowed money and told his broker to buy $100 of every stock trading below $1.
There were 104 of them.
The broker called back with a problem: 37 were already bankrupt.
Templeton told him to buy those too.
He believed that if America entered a major war, even companies considered nearly worthless could return to production. One of the positions was Missouri Pacific preferred stock. It had fallen from $7 to 12 cents and had not paid a dividend in years.
Templeton bought roughly 800 shares for $100.
When the position reached 40 times his purchase price, he sold. The stock later climbed to $105.
That trade became an early version of the philosophy behind the Templeton Growth Fund, where $10,000 invested at its 1954 launch reportedly grew to roughly $2 million by the time he sold the business in 1992.
In this rare Charlie Rose interview, Templeton explains that bargains do not appear because the market calmly calculates fair value. They appear because frightened owners are desperate to sell.
His job was to determine whether the pessimism had pushed the price below what the business could eventually earn.
He compared earnings, growth, dividends, book value, and competitors. If similar companies traded at 25 times earnings while one credible business traded at five, that was where the research began.
Templeton became a billionaire by buying assets other investors were emotionally unable to hold.
This interview explains the arithmetic beneath the contrarian mythology.
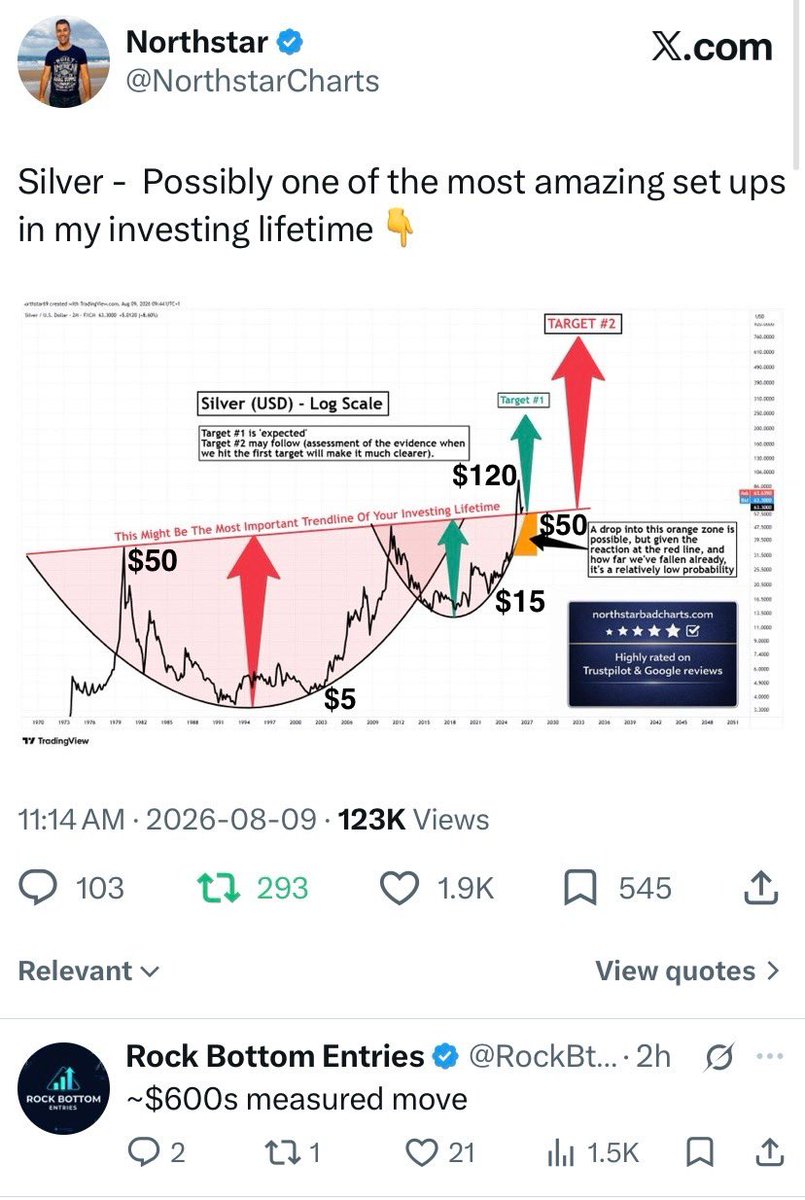
The widening spread between #Gold and #Silver, is reflected in the #GSR, which appears to indicate another bullish setup for Little Sis Silver. Overnight, it hit 68:1 - it was 73:1 back on 6 Feb and 17 July 2026. Silver is beginning to show signs of bottoming out at $56.59 area (Measured Move).
Silver's decline has been steeper than Big Bro Gold's, reflecting its dual role as both a precious and an industrial metal.
Good news, is that Wave 3 is extending and that only wave i of 3 ended at the $121.65 high...This would suggest that silver is heading well above the $300 level in wave iii of 3.
H2/26 Target is $78.47
https://t.co/robyniAtuH
#BREAKING An Iranian national who drugged and raped a 13 year old girl in her bedroom will not be deported or jailed - and will keep receiving taxpayer funded NDIS support while living freely in the community.
Arash Farzad spiked a mother and her daughter with benzodiazepines during a fake job interview, then raped the 13 year
old while threatening to cut her throat.
He told psychiatrists he had a sexual interest in girls of 13 because “Ozzy Osbourne was with a 13 year old” and he “wanted to try it out.”
The NSW Supreme Court just renewed his supervision order - but removed his ankle bracelet because it “identified him as a pedophile” and got him abuse.
They even cleared him to attend “NDIS barbecues.”
Farzad complained that his NDIS provider sent him only male support workers and expressed a desire for female support workers.
He now gets female support workers to “wash him” and “shampoo his hair.”
He has called them “wife material,” commented on women’s bodies in public, and said “I like them young.”
Taxpayers are funding this.
A convicted child rapist remains in the community on the NDIS.
How is this acceptable?
What if I told you I think precious metals may have just put in a major bottom?
Would you agree? Think I'm crazy? Or do you believe there's still much more downside?
Here's why I'm paying attention...
This is the Gold to DOW Ratio.
Back in April 2024 it broke out, right around the time I started writing mainstream articles for News Corp saying I believed precious metals and commodities were about to begin a major bull run.
At the time:
• Silver was around $27.
• Platinum was around $1,000.
• BHP was trading in the high $30s.
We all know what happened next.
Then came the excess phase of the wave. Everyone became bullish. Sentiment exploded. That's usually what happens near a major swing high.
Fast forward to today.
That entire excess move has now been wiped out. The Gold to DOW has retraced back to the 0.618 Fibonacci level and is sitting on a major support zone that dates all the way back to 2014.
When I look across gold, silver and many commodity charts, I'm seeing the same thing over and over.
Bullish divergences.
Momentum starting to improve.
And perhaps most importantly, sentiment has completely flipped. The excitement has disappeared. Many investors are now bearish and throwing in the towel on commodities.
Now, all I'm seeing at the moment are some very big technical signals. That's all they are. I still need those signals to turn into confirmation before I'd confidently call a major bottom.
But I thought it was worth sharing because this is a key area to keep a very close eye on.
If the market confirms these signals, this could prove to be a very important turning point.
Time will tell.
So... are you in the bull camp or the bear camp for precious metals?