The $NVDA breakdown I mentioned is out:
the CEO exit, what was already broken, and three paths from here.
All three run through 86–112. Tonight’s weekly close vs 161.77 decides which one starts. https://t.co/Z8kpSvceJx
$NVDA reported. The short version: a clear beat, a guide that’s about in line, and a chart that hasn’t decided anything yet.
The numbers:
Revenue $115.8B vs. a $108B ±2% guide, data center $107.6B
EPS $2.68 vs. $2.47 expected
Q4 guide $130B ±3%. Roughly what the Street wanted, but Q4 has an extra week, and gross margin is guided down to 71–72% from 74.9%
Still no China data center revenue assumed
The “$150B buyback” making the rounds was added in September. New this quarter: $28.1B returned
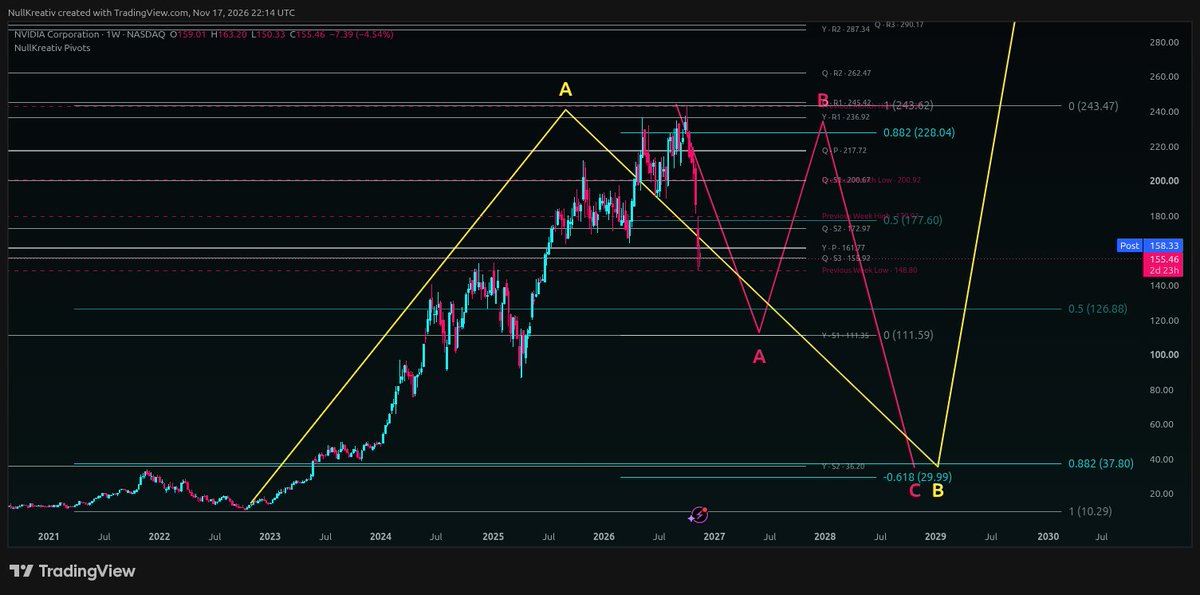
The chart: today closed at 155.46, the first daily close under the quarterly S3 at 155.92. After hours it spiked to about 161.5 and stalled right under the yearly pivot at 161.77. Now 158.33.
That’s the same line as in my article. A weekly close above 161.77 puts the relief path in play. Below it, the road leads to the 105–112 zone.
The chart shows the Match from the article, the path I lean towards. A: down to 111.59, right at the yearly S1 (111.35). B: the bounce that convinces everyone, up to the 0.882 at 228.04. C: down to the −0.618 at 29.99, right where the 0.882 of the whole 2022–26 run sits at 37.80, with the yearly S2 at 36.20. That’s years, not weeks.
A good quarter doesn’t change the line. Friday’s weekly close decides.
Disclosure: I’m long $SOXS (3x short semis), no $NVDA position.
$NVDA closed at 156.14 today, about 5.60 under the yearly pivot at 161.77. Friday was a dollar above it. That’s why I didn’t call a path on Friday.
It’s still a weekly question, and earnings land tomorrow after the close. Below: last week’s low at 148.80, then the monthly S3 at 146.80. Above: 161.77 is the first thing to win back.
$SPX daily close: 7,340.53, −1.0%. The low went to 7,288, but the close held 7 points above 7,333.76, the line where the bounce idea dies. I count closes, not wicks, so it’s still alive. Barely.
It did close under the quarterly S1 at 7,371, and Monday already closed under October’s low at 7,527.56. Below 7,333.76 the next stops are the monthly S3 at 7,140 and the quarterly S2 at 7,091, right above the −0.618 at 7,044.
Retail sales came in as expected at +0.2%, no help there. Nvidia reported after the bell. Tomorrow’s open shows whether that changes anything for the index.
$SPX weekly close: 7,561.67, +2.5% on the week, but under the 7,582–7,594 zone (yearly R1 / quarterly pivot). That’s the close I was watching for.
The bounce hit the monthly pivot on Thursday and couldn’t hold the 0.5 at 7,598. The 0.882 at 7,787 never came. That leans toward the early fail: down toward the −0.618 at 7,044, with the quarterly S2 at 7,091 just above it.
Still open: November needs to close under 7,582.50, ideally under October’s low at 7,527.56. Two weeks to go.
Unchanged: the bounce idea dies on a daily close below 7,333.76, the whole scenario on a close above 7,874.19.
Zoomed out to the monthly: the run from 3,494 in 2022 to 7,842 has its 0.882 at 4,007, right next to the yearly S2 at 4,098. That’s where the long-term chart points once the trendline from 2022 breaks and gets a clean retest from below. That can take a month, a week or a year. Dead on a monthly close above the yearly R2 at 8,319.50.
Not a call for next week. A map for the next few years.
@BullTheoryio Small thing: $130B isn't a raise, it's the first guide for Q4, and Q4 has an extra week in it.
After hours $NVDA is sitting right at the yearly pivot, 161.77. That's where the relief gets tested.
@CryptoMichNL Revenue and EPS beat, yes. "All levels" skips one:
Q4 gross margin is guided to 71–72%, down from 74.9% this quarter, and Q4 has an extra week in it.
Not a disaster, just not a beat.
@unusual_whales Big number, old news. Per the release, the board added that $150B to the buyback authorization in September.
New this quarter: $28.1B returned through buybacks and dividends, $227.3B still authorized.
@KobeissiLetter Record quarter, and after hours $NVDA is back to roughly where it closed last Friday (162.85).
That's right at the yearly pivot, 161.77. The beat buys the retest. Friday's weekly close decides whether it holds.
$SOXS TP1 hit: 62.28, the 0.5 of the run. 35% off, about +39.5% from my 44.63 entry.
The plan said stop to entry at this point. I put it at 41.21 instead, just under last week’s low at 41.84. This is a perp on a crypto exchange: it trades 24/7, the ETF behind it doesn’t. When the real market is closed, liquidity gets thin, and one quick wick back into the entry zone shouldn’t take me out. Even if the stop hits, the trade closes about +8.9% on the original size. That’s price move, not account return.
$NVDA reports tonight. For a 3x short on semis, that’s either the next leg or the test of that stop.
Next up: TP2 at 85.32. Invalidation unchanged: daily close below 34.90.
$SOXS update. Plot twist: Nvidia lost its CEO today and gapped down 13% at the open, and my inverse chip ETF is still red on the day. The rest of the sector didn’t follow, and SOXS tracks the basket, not one name.
The position is fine though: 45.67 now, above my 44.63 entry. Price broke the trendline and the monthly pivot at 45.48 intraday, got pushed back, and is reclaiming the pivot again as I type. Neutral leaning positive. Positive counts only on a daily close above 45.48.
Nothing changes: stop 32.98, invalidation a daily close below 34.90, TP1 62.28. Nvidia reports on Nov 17. That’s the next real test.
$NVDA $SOXX $SMH
bittensor:native daily, Bybit perp.
The push from 213.21 to 342.23 retraced all the way into the 0.882 at 228.43. The wicks went deeper, into last week's and last month's low around 219, and today price is back above the zone.
If it holds: the monthly pivot at 257.4 and last week's high at 262.4 first, then the 275–278 cluster where the quarterly pivot meets the 0.5. Above that, the monthly R1 at 295.9 and last month's high at 316.5 before the 342 high. The −0.618 extension sits at 422.
A daily close below 208.94, the quarterly S1 behind the 100%, and the idea is dead.
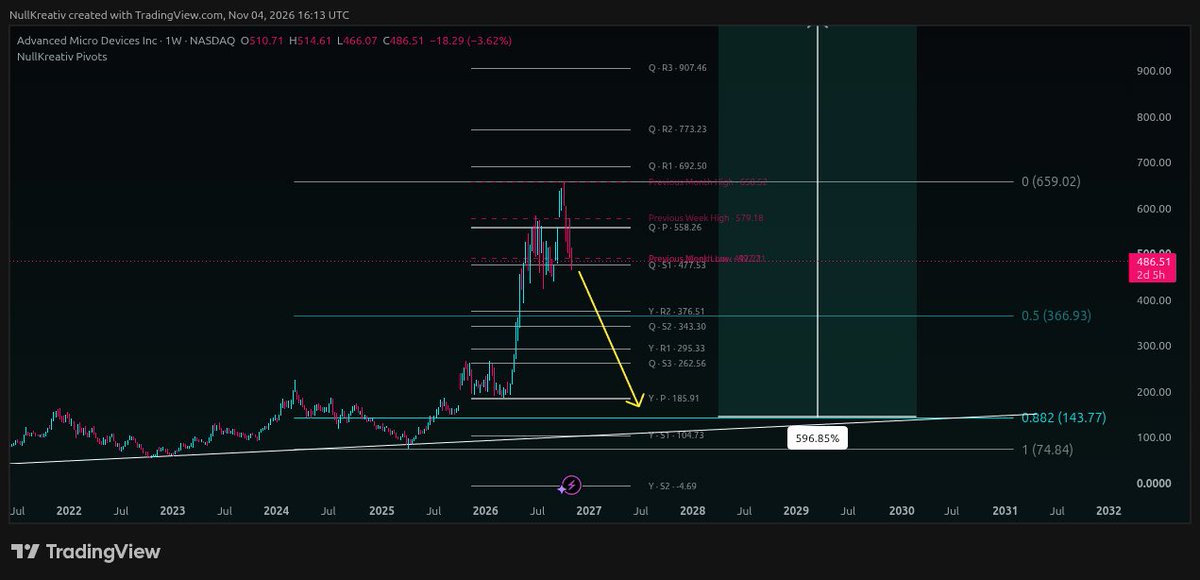
$AMD resolution, and a late one. By the rule I posted, this idea is dead: Thursday Nov 12 closed around 585, above the 578.67 where the drop started.
Before that, the path ran almost exactly as drawn: from 486 through 477.5 and 445 down to 402, about 1.5% short of the −0.618 at 396. Then it reversed and took the whole drop back.
Right direction, target missed by a hair, invalidated anyway. I should have closed this loop last week.
$AMD
Q3 beat: revenue $13.4B (+45% y/y), data center +97%, Q4 guided to ~$17B vs ~$16.2B expected.
After hours it ran straight into the 0.5 of the last drop at 522. At the open it lost it: now 486.5, the whole after-hours pop gone.
That's scenario 1 from my article: strong numbers, and the market doesn't pay for them.
The drop from 578.67 to 466.10 is still the structure. Below, the path runs through 477.5 and 445 toward the −0.618 at 396, next to the monthly S2 at 385.5.
Invalidation: a daily close above 578.67, where the drop started.
No position. I'm out of stocks completely right now.
$AMD
beat on the headline numbers: revenue +45%, data center +97%, Q4 guided above estimates.
After hours it ran straight into the 0.5 of the last drop at 522. Recovery or just a halfway point? The open decides.
Full read with levels tomorrow after the bell.
$NVDA closed at 156.14 today, about 5.60 under the yearly pivot at 161.77. Friday was a dollar above it. That’s why I didn’t call a path on Friday.
It’s still a weekly question, and earnings land tomorrow after the close. Below: last week’s low at 148.80, then the monthly S3 at 146.80. Above: 161.77 is the first thing to win back.
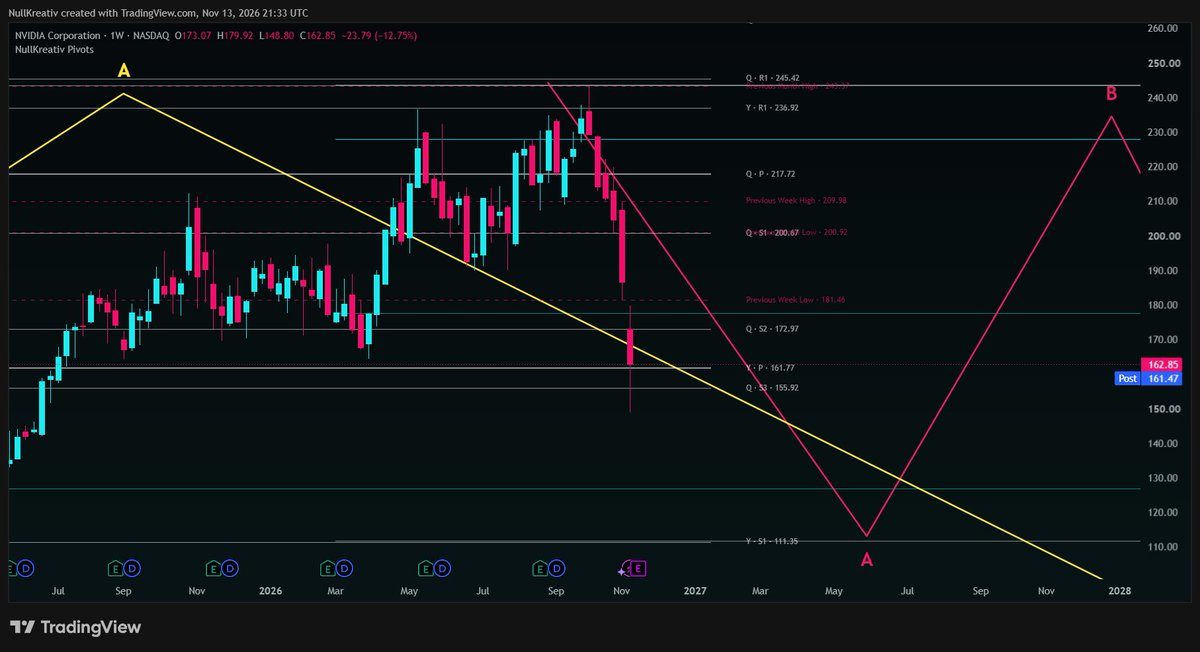
$NVDA weekly close: 162.85. The yearly pivot at 161.77 held, by a dollar. After hours it’s already back under it at 161.47.
Technically that’s the “pivot holds” case from my article. Practically, one dollar isn’t a decision. The week still closed −12.75%, in the lower half of its range.
So: neutral. No path picked, nothing invalidated. With earnings on Tuesday, the next real signal comes from the market, not from me squinting at a weekly close.
$IREN daily close: 16.39, −9.8%. Last week’s low at 17.39 gave way, and so did the monthly S1 at 16.70, the last level before my zone.
Next is the 0.882 at 13.37, on the 2023 trendline. That’s about 18% lower. The zone isn’t reached yet, so nothing to do but watch.
Invalidation unchanged: a monthly close below 2.97.
$IREN weekly close: 18.17. −16% on the week, −24% in November so far, more than 75% below the 76.80 high.
@pekutovsky45098 called it the most brutally repriced stock lately. Here’s the map I promised.
This week the quarterly S2 at 19.29 broke, and the weekly close stayed under it. Last week’s low at 17.16 held, barely: the low was 17.39. The monthly S1 at 16.70 is the last level before my zone.
The zone: the 0.882 of the whole run from 4.88 to 76.80 sits at 13.37, right where the trendline from 2023 runs into it. From here that’s another −26%.
Why it could get there: revenue is growing fast, the funding isn’t keeping up. After the Q1 numbers, about $6B of the remaining $15B capex for this fiscal year was still unfinanced, and the $4B run-rate target moved from year-end to January. The market doesn’t wait for the financing to get sorted.
If 13.37 holds, the way back runs through the yearly and quarterly pivot at 39.73–39.92, with the 0.5 at 40.84 right above, then the 76.80 high. The full leg ends at the −0.618, 121.24. That’s what the chart shows, not a promise.
Invalidation unchanged: a monthly close below the yearly S1 at 2.97.
Brutally repriced, yes. Finished, not yet.
@MrZapax Where does the floor sit for you in numbers?
On mine the line that matters is 57,709, the start of the run to 87,383. Above it this is still a retracement.
Below it your Gulag ticket gets printed.
I’ve got a long limit at 61,210 on the 0.882, stop at 53,244.
Your 3,830 lines up with my weekly: the yearly pivot and the quarterly S1 sit at 3,829–3,846, and today’s low at 3,832 tagged it. Below that I don’t have much until the quarterly S2 at 3,534, and my actual zone is lower, 3,364–3,417. So on my chart 3,650 is a stop on the way down, not a floor. What makes it major on yours?
$HYPE weekly close: around 68.10, after a low near 60.02. Road A is still the live one: no weekly close below 51.09, and the 56.63 zone hasn’t been reached yet. The quarterly S1 at 62.04 got tested on the way.
Note: I redrew road B from the 20.62 low (was 22.81), so its zone moves to 29.76 (yearly pivot 31.41 just above) and the target to 145.93. The trigger stays the same: a weekly close below 51.09.
My lean is road A, mostly because it lines up with my $BTC order at 61,210: if Bitcoin dips into that and gets bought cleanly, HYPE’s 56.63 zone is the natural place for the same flush to end. That’s a lean, not a call.
hyperliquid:native weekly. Two roads, one decision point.
Price sits right on the 0.5 of the run from 51.09 to 98.07, at 74.58. The quarterly pivot and yearly R2 at 80.03–81.52 are the first ceiling above.
Road A: down into 56.63, the 0.882, with last year's highs and the yearly R1 at 53.48 right under it. If that zone holds, the −0.618 sits at 127.10, almost exactly on the quarterly R2 at 126.93.
Road B: a weekly close below 51.09 kills road A. Then the bigger run from 22.81 takes over: its 0.882 sits at 31.69, with the yearly pivot at 31.41 right there. From there, the −0.618 of that run is 144.58.
Invalidation for road B: a weekly close below the quarterly S3 at 15.14.
Same coin, two zones. The weekly close decides which one I get to buy.
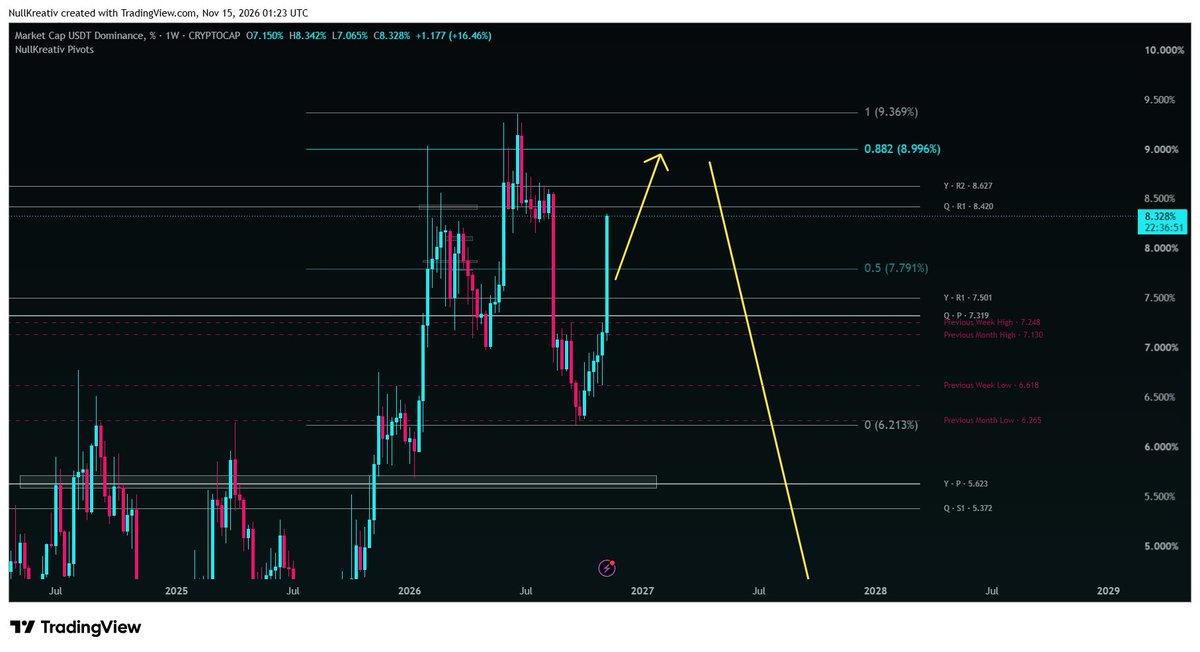
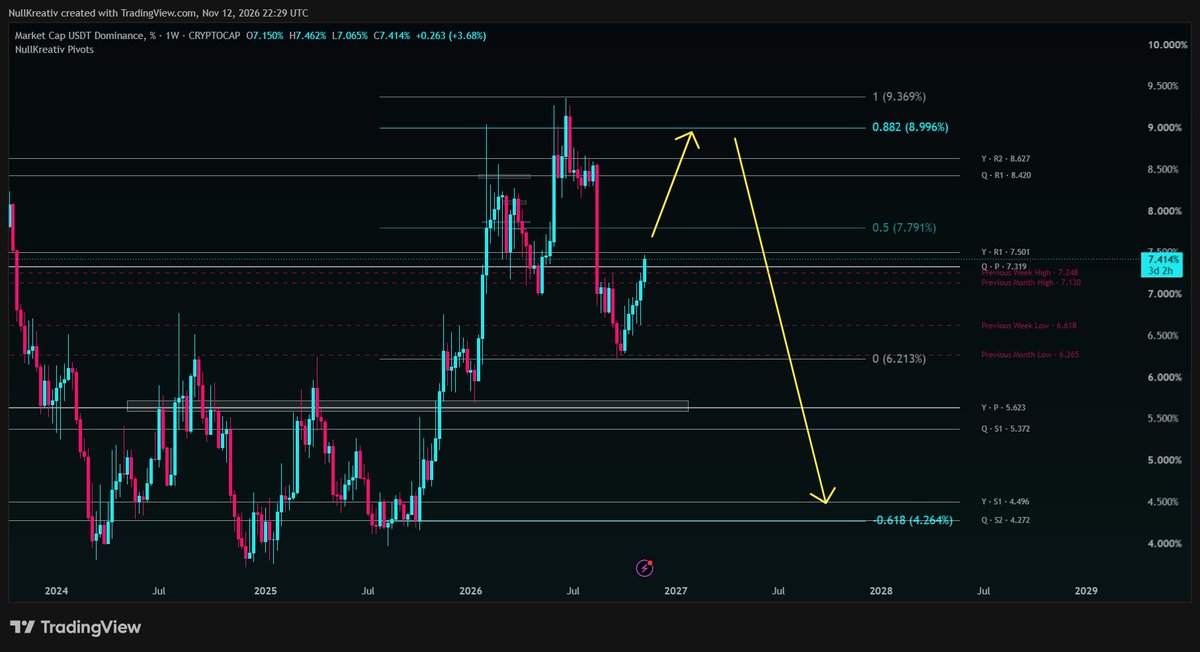
$USDT.D dominance weekly close: about 7.99%, up roughly 12% on the week. That’s above the 0.5 at 7.791% from this map, and the wick tagged 8.39%, just under the 8.42–8.63% zone (quarterly R1, yearly R2).
So far it’s playing out step by step. Next is that zone, then the 0.882 at 8.996%. That’s still where I’d expect the turn, and where crypto would look its worst. Dead on a weekly close above 9.369%.
Disclosure: long $AERO, and a $BTC limit order sitting at 61,210. So this chart climbing further is the risk I’m carrying.
$USDT.D USD dominance, weekly. New map, because the old one died this week.
Quick reminder how to read it: USDT dominance up means money hiding in stablecoins, so the rest of crypto goes down. This chart rising is bad news for everything else.
Reference move: the drop from 9.369% to 6.213%. Price just reclaimed the quarterly pivot at 7.319% and is pushing into the yearly R1 at 7.501%.
Above that: the 0.5 at 7.791%, then 8.42–8.63% (quarterly R1, yearly R2), then the 0.882 at 8.996%. That’s where I’d look for the turn, and where crypto would look its worst.
From there, the big leg: the −0.618 at 4.264%, right on the quarterly S2 and yearly S1 (4.27–4.50%). Dominance that low means money flowing back into crypto.
Dead on a weekly close above 9.369%.
Long $AKE, so the next few weeks of this chart aren’t my favorite part.
$USDT $BTC $ETH
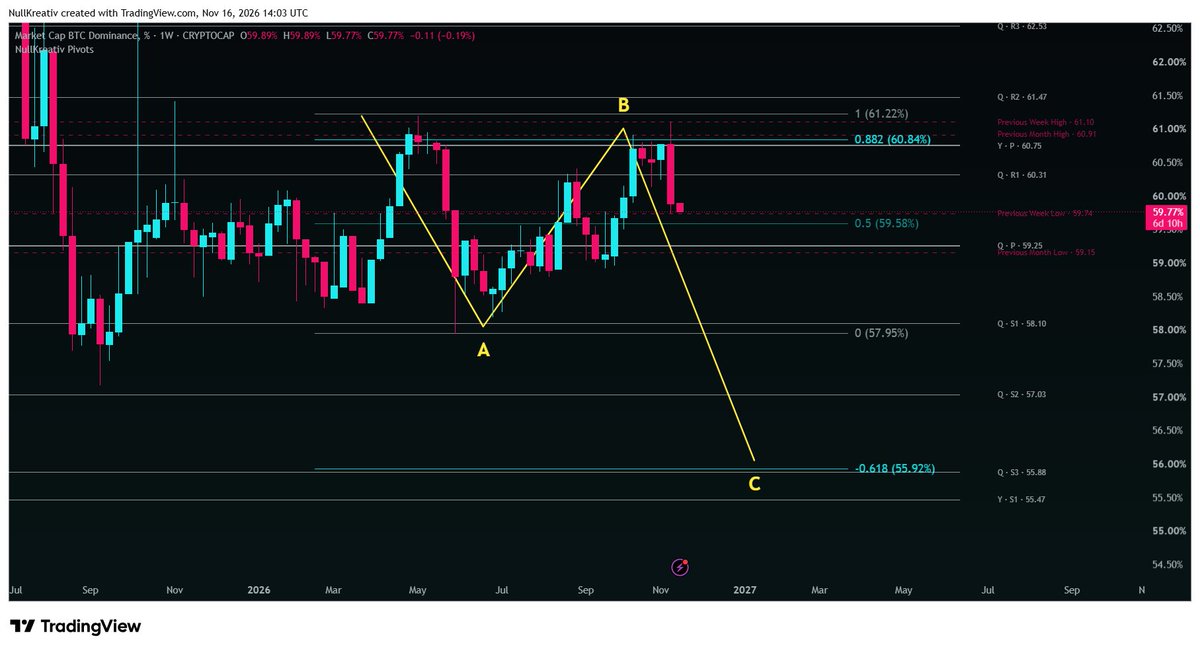
Last piece of this one, the BTC dominance part: weekly close around 59.89%. It wicked to 61.10%, above the 0.882 at 60.84%, and closed well below it. Far from the 61.47% invalidation, so this part is alive and on track. Next: the 0.5 at 59.58%, then the quarterly pivot at 59.25%.
The catch: Bitcoin is losing share as planned, but not to alts. USDT dominance ran from 7.15% to over 8% in the same week. The share went into stablecoins. Right direction, wrong reason. That’s why the alt part died while this one works.
So the dominance idea stays, the “alts hold” idea is gone.
$BTC
$TOTAL2 $TOTAL3
ethereum:0xdac17f958d2ee523a2206206994597c13d831ec7
$BTC.D
Rule check on this one: both alt charts closed the day below the start of their leg. Total ex-BTC at around 858B against 866.43B, ex-BTC and ETH at around 641B against 647.04B. By what I wrote, those two legs are dead.
What I’m still watching: $TOTAL hasn’t reached its 0.882 at 2.10T yet, and BTC dominance keeps dropping as planned. Weekend liquidity is thin. If both alt charts get back above 866B and 647B on daily closes once Monday’s volume is back, I’ll treat that as a new setup, not a rescue of this one.
My $ETH long got stopped on the same move.
@pekutovsky45098 Fair, point to you 😄
Scheduling a post about rest and actually being asleep when it goes out is next-level discipline. Then again, trading Saturday night for screen time because the chart says so is discipline too. My day off will probably be Monday 😁
$TOTAL tagged the zone this week: the low was 2.10T, exactly the 0.882, with the yearly S1 at 2.07T right under it. That’s the area I said I’d want to be a buyer again.
So here’s my order: bitcoin:native long limit at 61,210.4, on the 0.882 of the run from 57,709 to 87,383. Stop and invalidation at 53,244.6, below the start of that run. Targets: 72,546, 87,383, 105,865, the last one on the quarterly R2.
Not filled yet. Price is at 62,654, about 2% above.
The catch hasn’t gone away: USDT dominance is at 8.33%, just under the 8.42–8.99% zone where I expect it to turn. If it gets there first, this order fills. If it pushes on toward 9.37%, the stop gets tested.
$TOTAL update on the monthly scenario above, weekly chart this time.
The 0.5 at 2.47T was the line. This week opened right on it and dropped to 2.26T. Now at 2.30T, −7.1% on the week so far.
It only counts on a monthly close, and November still has two weeks to go. But price is already on its way to the zone: the quarterly S1 at 2.24T next, then the 0.882 at 2.10T with the yearly S1 at 2.07T.
From there the target is unchanged: 3.55T, which now lines up with the quarterly R2 as well. On the way up: the yearly pivot and quarterly R1 at 3.17–3.20T.
Dead on a monthly close below 1.99T.
Disclosure: long $ETH and $AKE. Why that doesn’t contradict this chart: separate post.
$TOTAL monthly.
The daily idea died yesterday below 2.53T, so I zoomed out.
The structure: total crypto market cap ran from 1.99T in the summer to 2.95T in October. That whole leg is now being retraced. November so far: high 2.69T, low 2.49T, and price is sitting right on October's low at 2.53T.
Next is the 0.5 at 2.47T. A monthly close below it opens the way down to the zone I actually care about: the 0.882 at 2.10T, with the yearly S1 at 2.07T right underneath.
Two levels within 30 billion. That's where I'd want to be a buyer again.
If that zone holds, the extension of the same leg sits at 3.55T, above the yearly pivot at 3.17T.
Invalidation: a monthly close below 1.99T, the start of the leg.
$TOTAL tagged the zone this week: the low was 2.10T, exactly the 0.882, with the yearly S1 at 2.07T right under it. That’s the area I said I’d want to be a buyer again.
So here’s my order: bitcoin:native long limit at 61,210.4, on the 0.882 of the run from 57,709 to 87,383. Stop and invalidation at 53,244.6, below the start of that run. Targets: 72,546, 87,383, 105,865, the last one on the quarterly R2.
Not filled yet. Price is at 62,654, about 2% above.
The catch hasn’t gone away: USDT dominance is at 8.33%, just under the 8.42–8.99% zone where I expect it to turn. If it gets there first, this order fills. If it pushes on toward 9.37%, the stop gets tested.