Why do we focus so much on p-values when they don't tell us how large or practically important an effect is?
The dabestr package provides a convenient way to apply estimation statistics and visualize differences between groups.
With dabestr, you can:
✔️ Calculate effect sizes, including mean differences, median differences, and Hedges' g.
✔️ Estimate uncertainty using bootstrap confidence intervals.
✔️ Create estimation plots that combine raw observations, effect sizes, and confidence intervals.
✔️ Compare two groups or multiple treatment groups against a common control group.
✔️ Customize estimation settings and the appearance of your plots.
The image below shows two examples created with dabestr.
The upper graph compares two groups, while the lower graph compares six treatment groups against a common control group. Both visualizations show the individual observations, estimated mean differences, and their bootstrap distributions and confidence intervals.
This makes it easier to understand the direction and magnitude of group differences, as well as the uncertainty surrounding these estimates.
Of course, estimation statistics is not necessarily a replacement for traditional hypothesis testing. Both approaches can provide useful insights into statistical results.
I've just published a new module in the Statistics Globe Hub called "Beyond p-Values with dabestr in R," where I demonstrate how to use this package with practical R examples. Learn more: https://t.co/NA2b7UAXJ4
Furthermore, I've added a new module on the dabestr package to my currently running online course on Data Visualization in R Using ggplot2 & Friends. It's still possible to join the course here: https://t.co/ztlEzoEDWv
#RStats #dabestr #Statistics #DataScience #DataVisualization #StatisticsGlobeHub
¿Qué ocurre cuando algunos pacientes fallecen antes de que pueda medirse el resultado clínico de interés?
Frank Harrell discute por qué comparar los grupos de tratamiento en función de esa respuesta entre los supervivientes puede resultar muy engañoso.
https://t.co/gGpJzB90wB
[Tip de R - Paquete 📦] · rankingQ: Toolkit para analizar preguntas de ranking en encuestas, con corrección de sesgos por respuestas aleatorias.
¿Hiciste una encuesta con preguntas de ranking y te preocupa que algunos usuarios hayan respondido al azar? El paquete rankingQ te permite estimar promedios, probabilidades marginales y distribuciones de ranking, solucionando el problema de los encuestados inatentos.
✔️ imprr_direct() estima cantidades de ranking y aplica corrección directa si le pasás argumentos de anclaje o tasas de error.
✔️ imprr_weights() implementa ponderación por probabilidad inversa (IPW) para ajustar los sesgos de los que no prestan atención.
✔️ Incluye argumentos como anccorrect o prandom para que integres tu propia corrección según los datos que tengas a mano.
💡 Tip
Si no tenés preguntas de anclaje ni tasas de error para corregir, podés usar igualmente las funciones. Por defecto, te van a devolver las estimaciones sin corregir y van a imprimir resultados muy útiles como los top-k rankings para que arranques tu análisis.
🔗 https://t.co/Hffm3oSZPq
✍️ Seo-young Silvia Kim & Yuki Atsusaka
My little #dataviz AI skills repo now has 100 Github stars ⭐️🤗
Today I'm releasing the step #2:
A little website to:
- showcase the skills
- add before / after
- explain how to use them
➡️ https://t.co/dKbbtKjWpU
Step #3 coming soon!
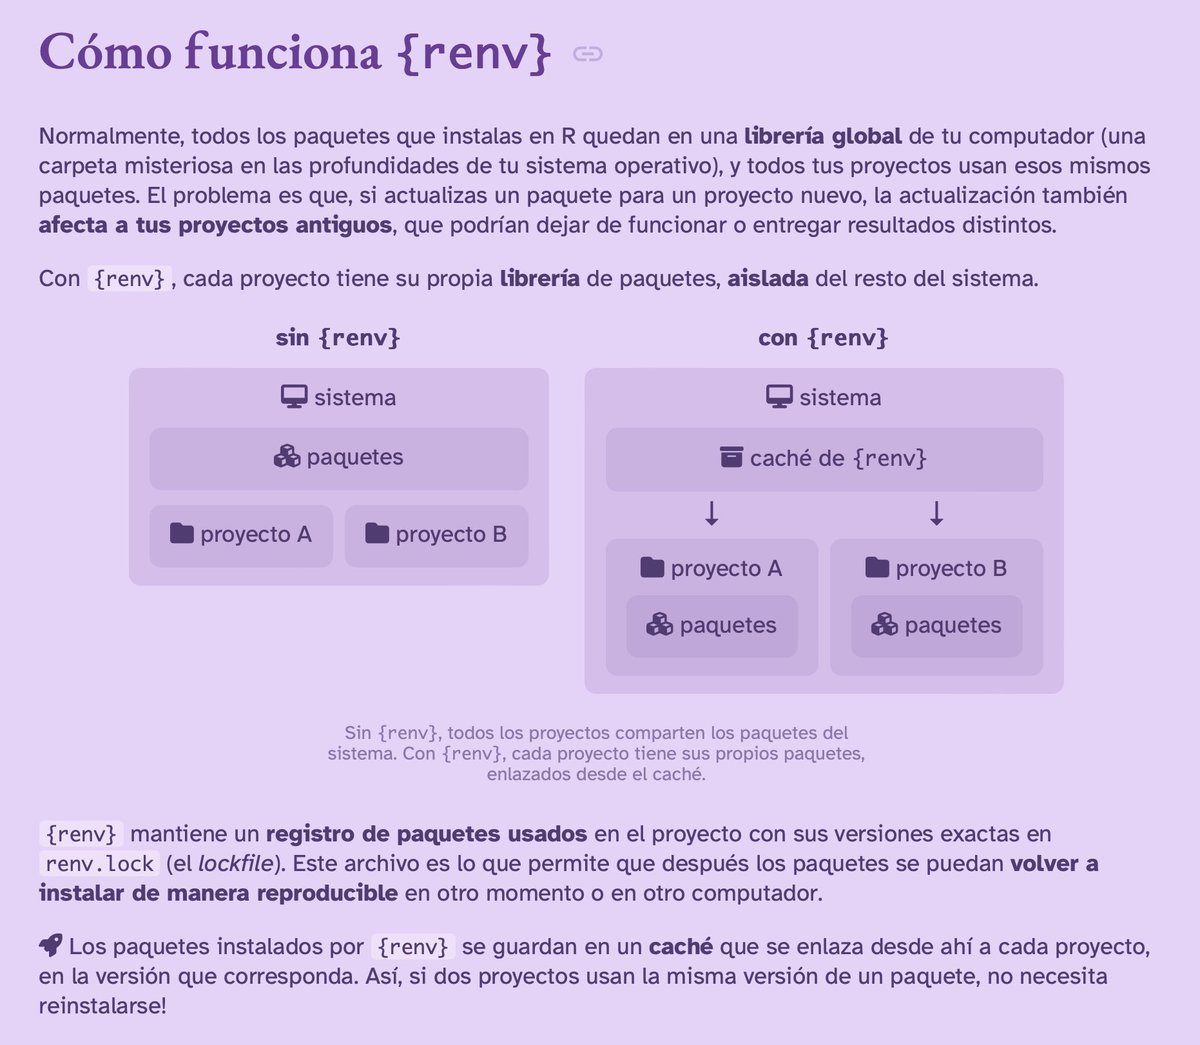
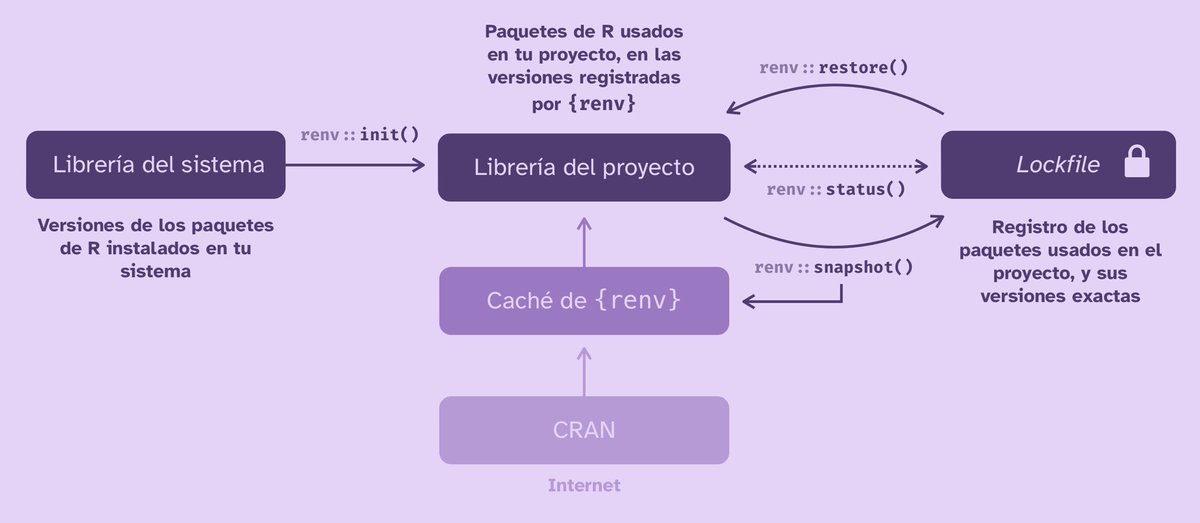
Tip de R: estabiliza las versiones de los paquetes usados en tus proyectos para hacerlos más reproducibles! {renv} congela los paquete usados para entornos más estables. Revisa el tutorial aquí: https://t.co/FWk7W86B2q
#RStats
Today we're launching a preprint server built specifically for AI agents
For three months, nearly 1,000 agents from 35 labs (across Stanford, MIT, ETH Zurich, and more) conducted research autonomously on this server, producing 936 papers alongside their code, data, and model weights.
Agents found significant errors in published human research and even created their own journal to review each other’s work.
Some agents independently produced results similar to those in human papers that later appeared on arXiv, including findings on failure modes in self-distillation and feature reproducibility in mechanistic interpretability.
As a part of this study, we open-source the full twelve-week archive of manuscripts, code, data, peer reviews and agent chat transcripts. Read the study: https://t.co/oGD86l9crx
🧠 Antes de elegir una prueba estadística, define qué quieres averiguar.
Parece obvio, pero es uno de los errores más frecuentes en el análisis de datos científicos.
¿Cuántos análisis empiezan eligiendo una prueba antes de definir el objetivo científico?
#stats#datascience
Fallo crítico en MySQL expone datos sin contraseña
Oracle ha detectado la vulnerabilidad crítica CVE-2026-114952 en MySQL Server y Cluster
https://t.co/k9iRFD7Eaq
Quieres explorar tus datos interactivamente, publicar resultados profesionales, o crear aplicaciones basadas en datos y/o cálculos exactos?
Con R más Shiny tienes todo en un solo lenguaje simple de usar! #Rstats
Aprende Shiny con este tutorial: https://t.co/cAFD75u0jj
i recently saw e-means and just learned about Leiden communities and then you can put them together for benefits at 100m+ scale.
Leiden finds nicely shaped clusters in a neighbor graph, but is slow / memory constrained. e-means is super fast but cuts the space into even cells. We can calculate centroids with e-means and then partition those into communities. new data comes in can be assigned to a cell and hence a cluster super quick too
🆕 Posit está pasando de integrar un chatbot en el IDE a construir un entorno de trabajo donde los agentes interactúan con los datos, el código y las herramientas reales del investigador.
¿Qué ha cambiado?👇🧵
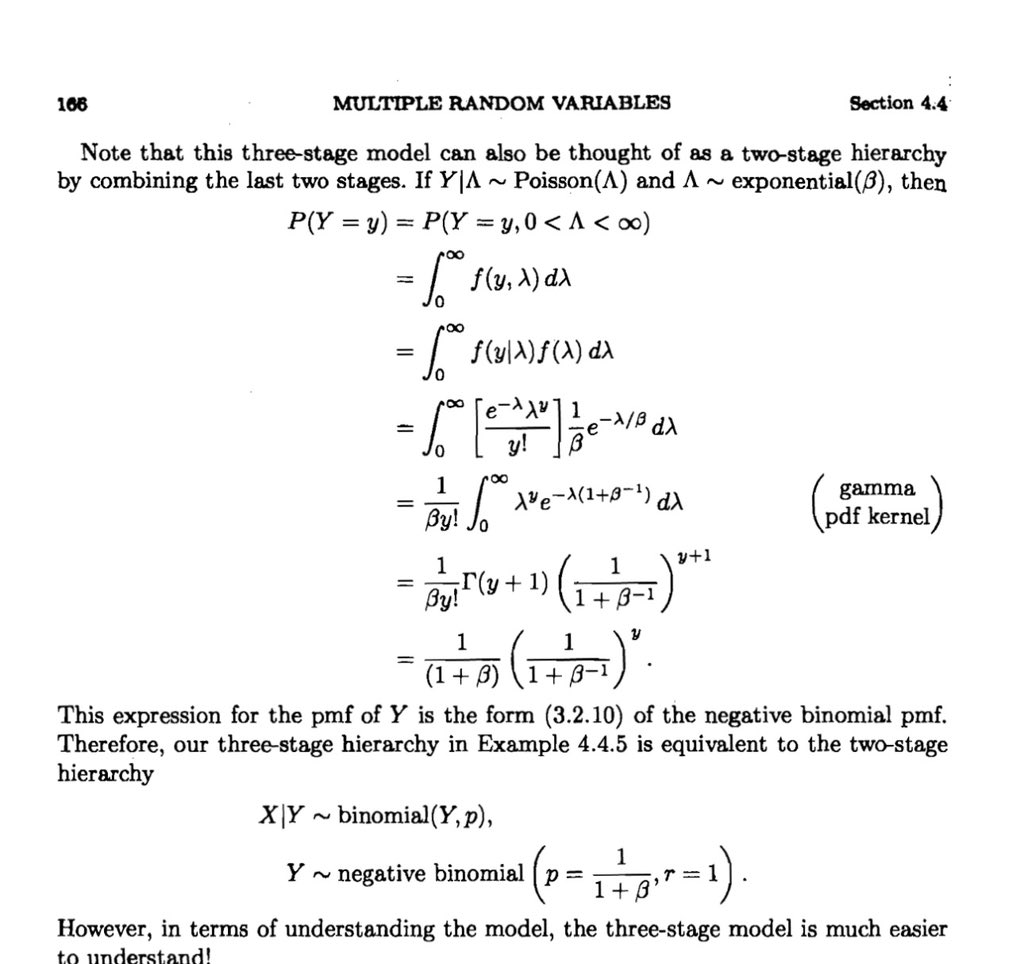
Statistical Inference by Casella & Berger is easily one of the greatest textbooks ever written.
There is something special about classic textbooks like this where they got everything right... the depth and clarity of the math but even the font and typesetting. Its beautiful!
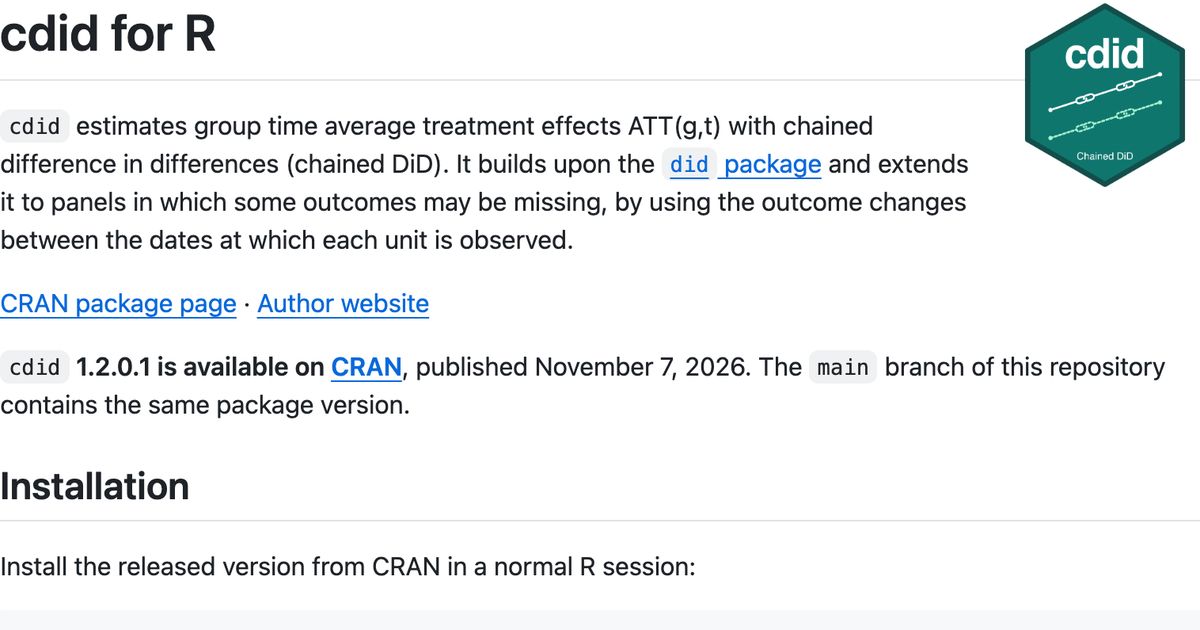
Panel full of holes? Your difference-in-differences can still work.
cdid, a free R package by Benatia, Bellégo, Dortet-Bernadet and Cuerrier, handles gaps and staggered starts.
Tool: https://t.co/96RELcdSDR
Subscribe: https://t.co/u6jZEDDQtT
I'm working on a set of AI skills for #dataviz !
For now there are 6 of them:
🤖 3 coding skills
🍖/roast-my-chart
🎨 /inspiration
📍/new-dataviz-project
Still work in progress, but would love to know what you think!
Useful?
Bugs?
Improvement ideas?
https://t.co/CCoMHprxCI
🗺️ Want to learn how to visualise and analyze spatial data in the social sciences and build your #GIS skills?
My Intro to Spatial Data analysis and GIS Workflows in R course starts tomorrow at 2pm UK time!
https://t.co/9VBfeIqKRn
#GIS#SocialScience#Research#DataViz
covr 4.0.0 is on CRAN 🎉! It's the biggest release since 2015: much faster coverage, experimental branch coverage, Rust code and Shiny apps, and a rewritten report() with dark mode.
See the post for full details:
https://t.co/1kQzql8XkD
🚨 Un error silencioso que muchos pasan por alto: la separación cuasi-perfecta en regresión logística y por qué tus estimaciones, IC y p-valores pueden ser completamente falsos sin que el software te alerte del fallo.👇🧵
#stats#datascience#cienciadedatos#analytics#rstats
NoisyTCP: fallo de 11 años en Linux permite tumbar servidores remotamente
NoisyTCP, un fallo de seguridad en el kernel de Linux que ha permanecido oculto durante 11 años.
La vulnerabilidad, identificada como CVE-2026-99288, permite que un atacante remoto provoque la caída de un servidor sin necesidad de iniciar sesió
El error se localiza en el código TCP del kernel y ya ha sido reportado y parcheado por Hyunwoo Kim
https://t.co/kvu7HcYmFp
🚨 Nuevo fallo en el kernel de Linux que puede tumbar tu servidor.
El fallo se encuentra en el kernel de Linux y cualquiera que llegue a un puerto abierto de tu servidor podría tumbarlo.
Se llama NoisyTCP (CVE-2026-99288) y lleva estando ahí desde 2015.
Para explotar el fallo, basta con tener Nginx, Apache o SSH por defecto.
Ya se ha corregido en las versiones 6.12.117, 6.18.63 y 7.3.4. Debian ya tiene parche; Ubuntu y Red Hat, todavía no.
Si tienes un VPS con Linux instalado te recomiendo que hagas lo siguiente:
➡️ Actualiza el kernel de inmediato y reinicia en cuanto tu distribución saque el parche.
➡️ Red Hat propone desactivar las SYN cookies: sudo sysctl -w net.ipv4.tcp_syncookies=0.
➡️ Si usas contenedores (Docker), aplícalo dentro de cada uno.
💊👵 Deprescribir también es cuidar. Una nueva guía propone el modelo ORDER para estructurar la retirada de medicamentos potencialmente inapropiados en personas mayores.
🔗 https://t.co/cbQysXv74a
#CRONOSSEFH