In missing data imputation, it is crucial to compare the distributions of imputed values against the observed data to to better understand the structure of the imputed values. The densityplot() function in the mice package provides an effective visualization for this purpose.
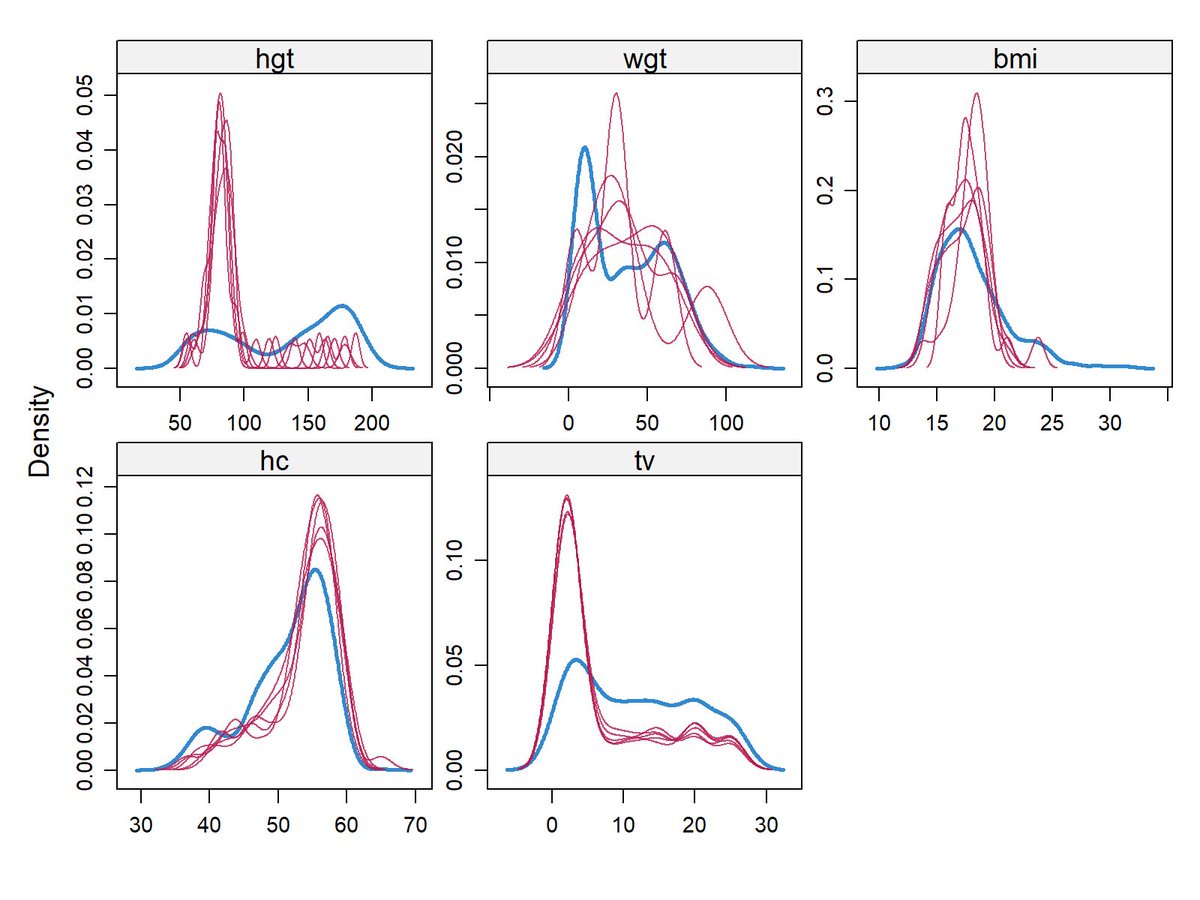
The attached density plot illustrates the observed (blue lines) and imputed (pink lines) distributions for various multiply imputed variables in the boys data set. Each panel represents a specific variable, offering a detailed view of imputation performance across multiple variables. Here are some key takeaways!
🔹 Alignment Between Observed and Imputed Data: The blue curves represent the observed data's density, while the pink curves reflect the densities of the imputed values across multiple imputations. Variables such as hgt and bmi demonstrate strong alignment between observed and imputed distributions.
🔹 Spotting Differences in Densities: Discrepancies between observed and imputed distributions may indicate areas requiring further refinement. However, such differences could also reflect systematic missingness patterns accurately captured by the imputation algorithm. Expert domain knowledge is essential to interpret these differences and determine whether they signal an issue with the imputation process or correctly reflect the underlying data structure.
🔹 Variable-Specific Insights: By visualizing densities for each variable, the plot allows analysts to determine whether specific variables need additional scrutiny or adjustments to the imputation process.
The visualization below can be generated using the following R code:
library(mice)
my_imp <- mice(boys)
densityplot(my_imp)
Looking for a focused way to learn imputation techniques? My online course Missing Data Imputation in R can guide you step by step.
More information: https://t.co/i99PuXw3TZ
#DataViz #RStats #Statistical #DataVisualization
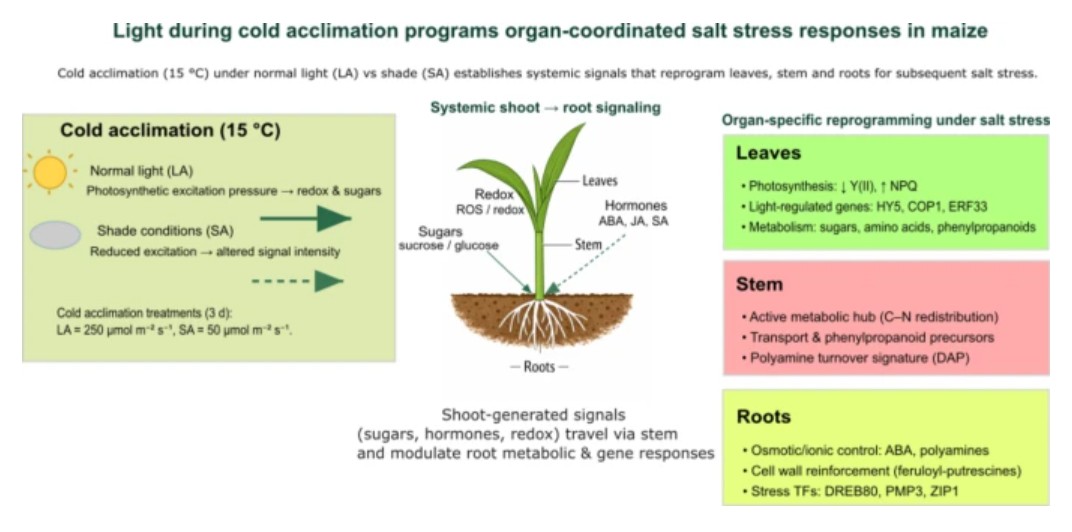
NEW ONLINE: Light-defined cold acclimation reprograms organ-specific metabolic and transcriptional landscapes for salt stress responses in maize https://t.co/dYqC4q4YVF
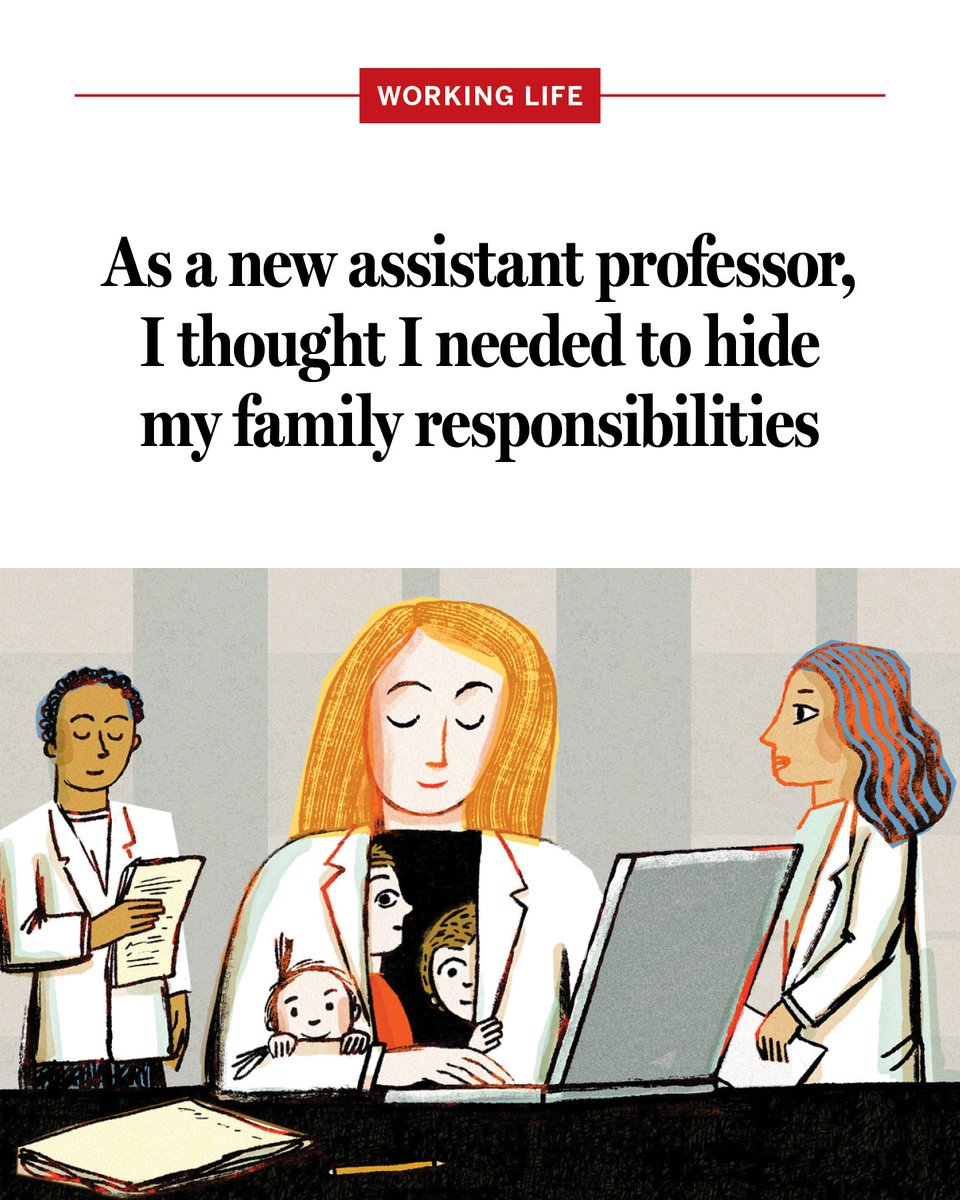
"I did not need to disguise the constraints of my career to prove I was a devoted mother, just as I do not need to disguise the demands of motherhood to prove I am a serious scientist." #ScienceWorkingLife https://t.co/eLseTagvVk
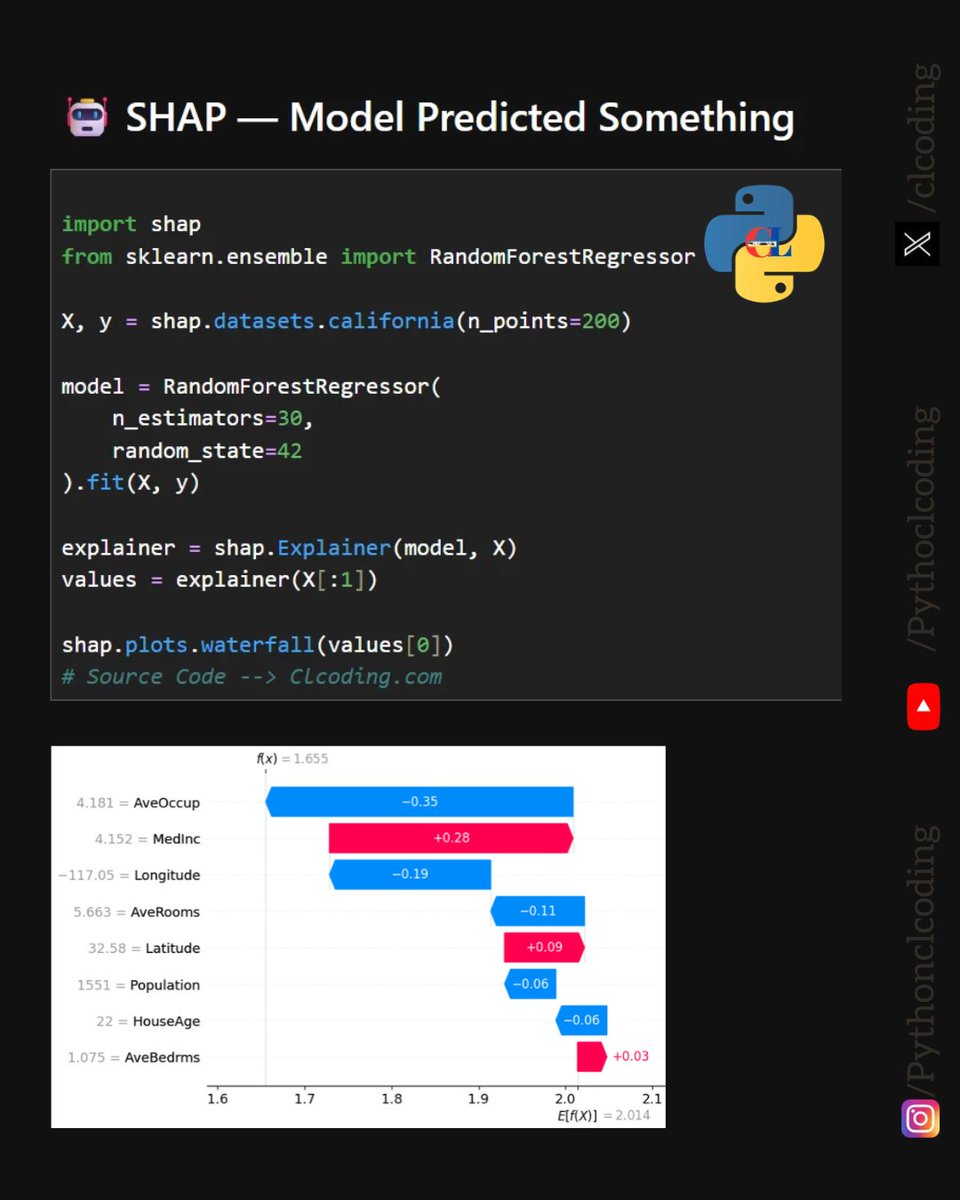
SHAP makes machine learning models easier to understand.
Instead of just getting a prediction, you can see why the model made that prediction and which features pushed the result higher or lower.
In this example, a Random Forest model predicts a value from the California housing dataset, while a SHAP waterfall plot breaks down the individual contribution of each feature.
For example:
- AveOccup pushes the prediction down
- MedInc pushes it up
- Other features such as Longitude, Latitude, Population, and HouseAge also influence the final prediction
This is the power of Explainable AI (XAI) — moving from “What did the model predict?” to “Why did the model predict it?”
Projects: https://t.co/wOZrzadBqH
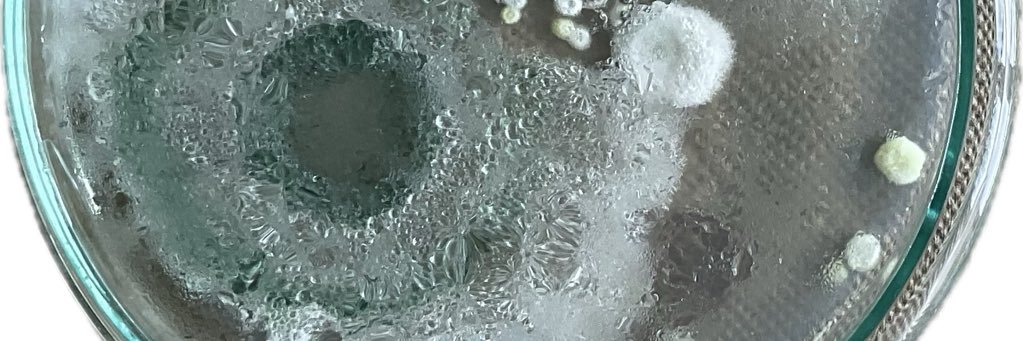
Long-read RNA sequencing improves isoform discovery, but how biological replicates are combined can shape transcript reconstruction and which novel transcripts are detected. @bio_bam@i2sysbio@CSIC https://t.co/Dfl1jdCCDH
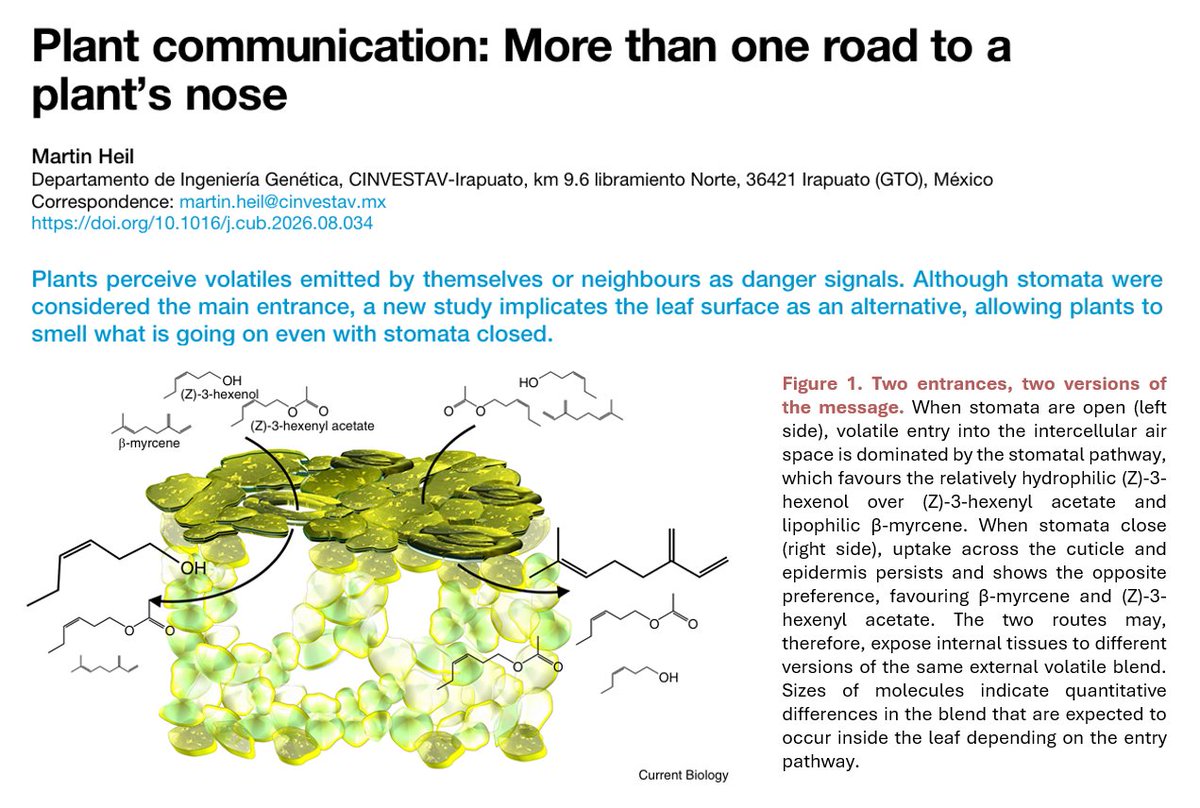
Just out in @CurrentBiology
My thoughts on the excellent work by the group of @Matthias__Erb
on the non-stomatal uptake of volatiles by Kalanchoe leaves
https://t.co/ljDry7P8Uu
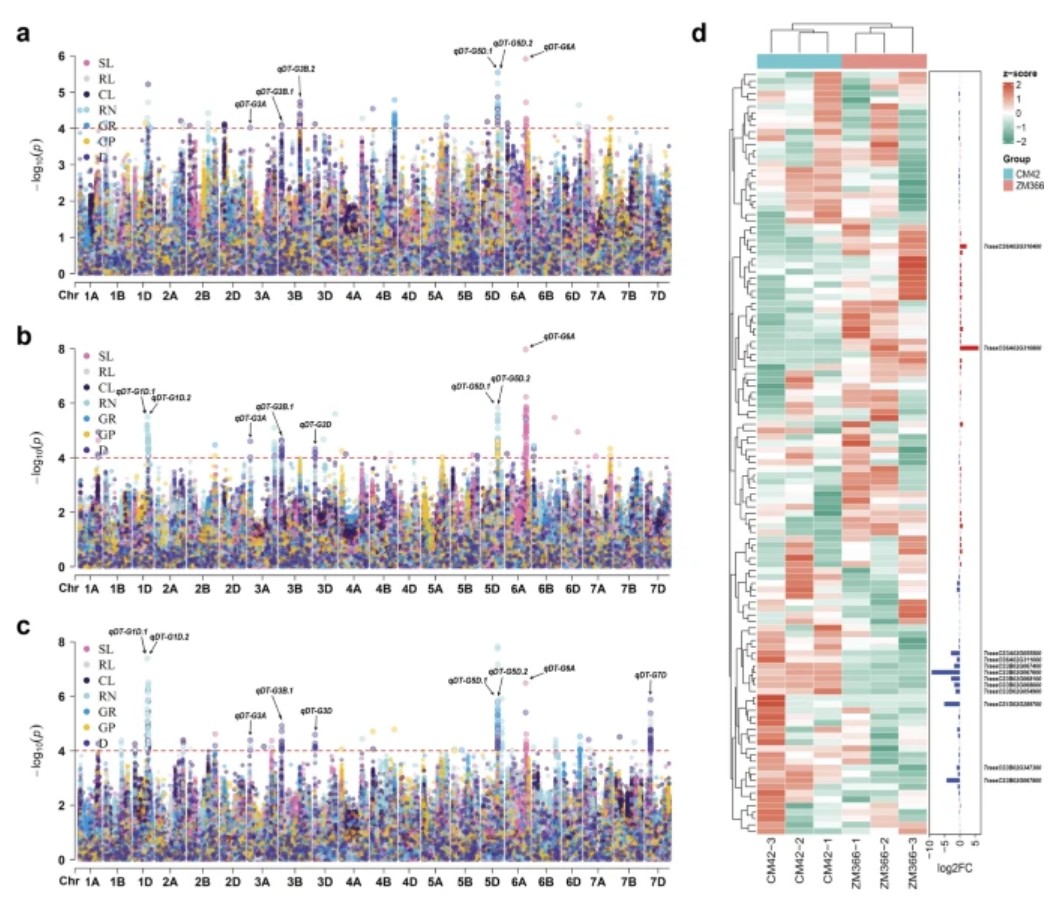
NEW ONLINE: Multi-environment genome-wide association study reveals genetic loci associated with drought tolerance during wheat germination https://t.co/TCYpHk8Xw5
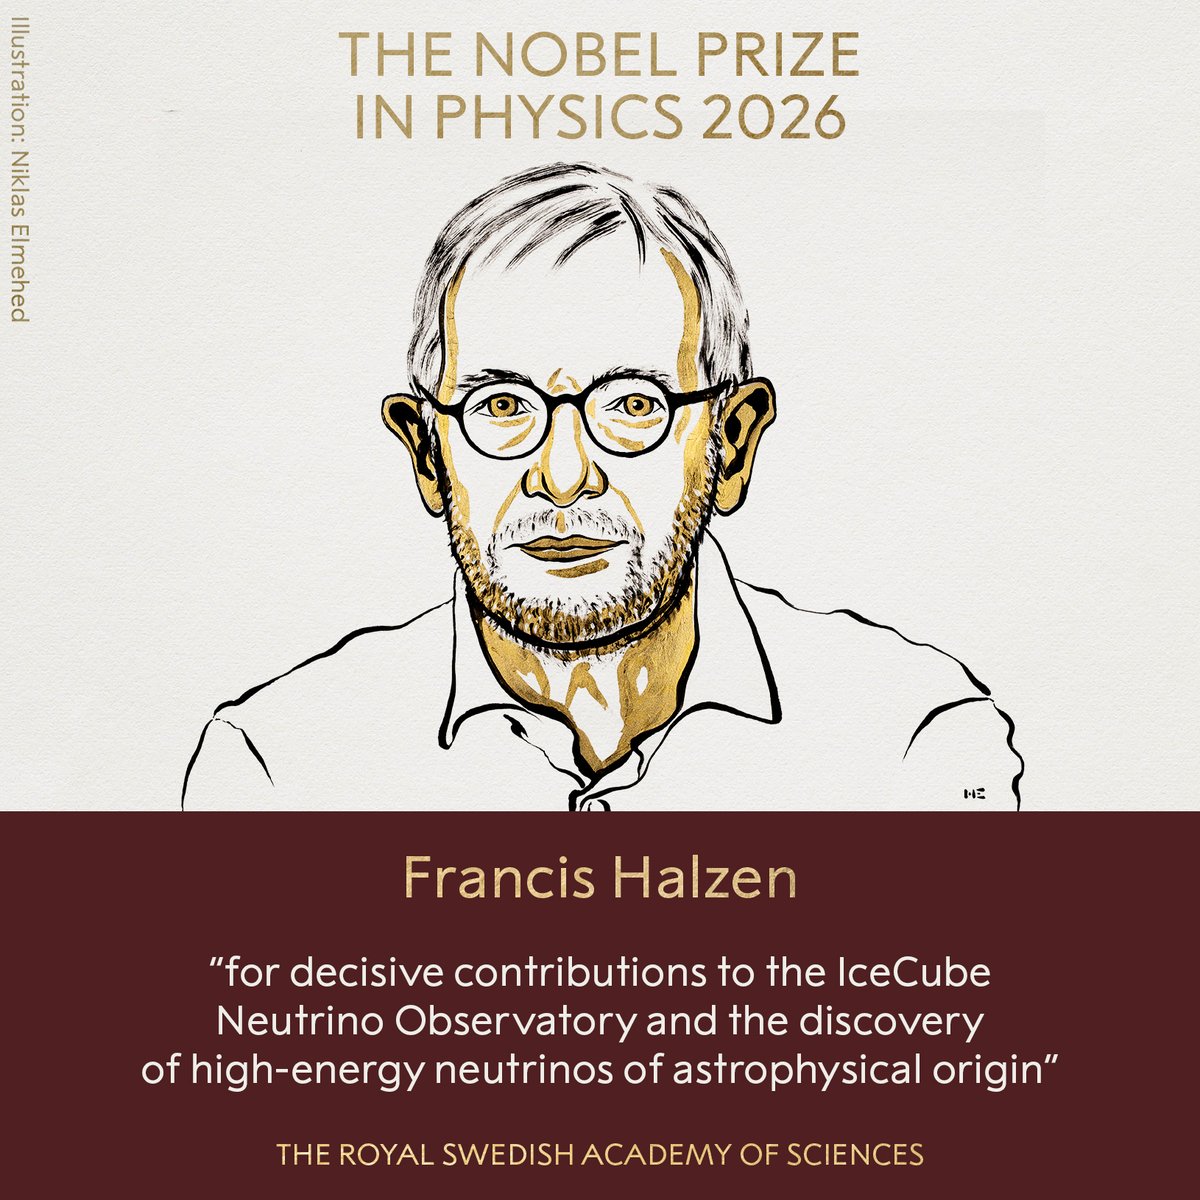
BREAKING NEWS
The Royal Swedish Academy of Sciences has decided to award the 2026 #NobelPrize in Physics to Francis Halzen “for decisive contributions to the IceCube Neutrino Observatory and the discovery of high-energy neutrinos of astrophysical origin.”
Many #PhD students & researchers feel guilty all the time.
Have I done enough?
I'm wasting time?
I should be doing more.
#7PhDSecrets.
Secret 5: Treat it like a job. If you know when to work, you know when to not work. Reduces guilt. #PhDchat#PhDForum#postdoc
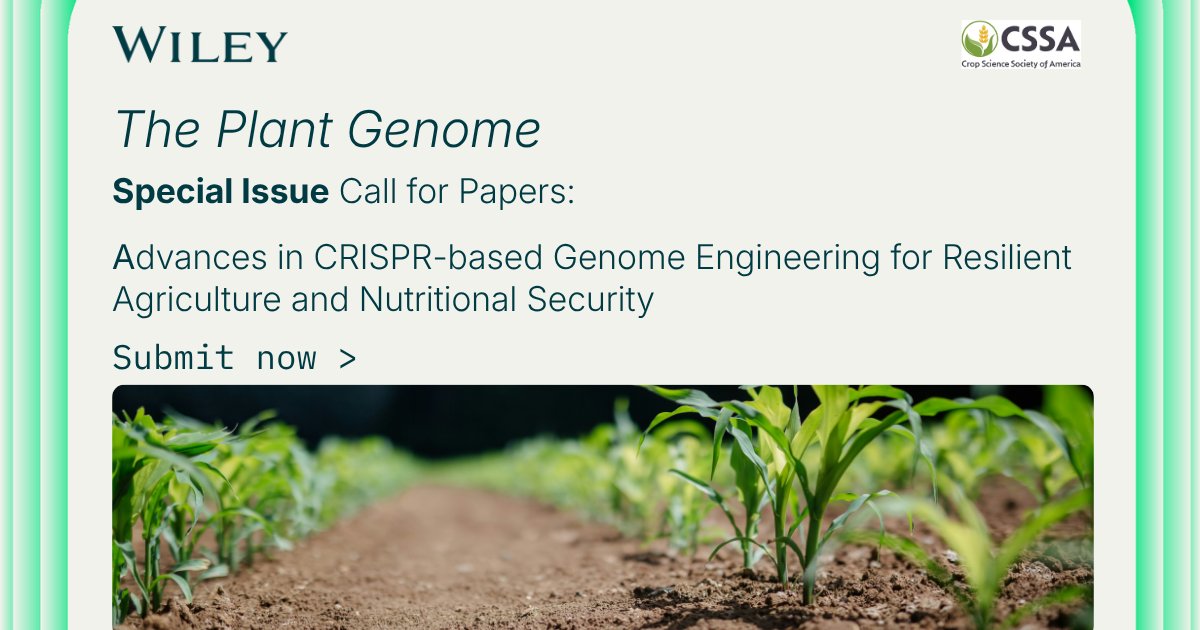
We're seeking cutting-edge research exploring #CRISPR applications in agriculture, nutrition and #foodsecurity. Share your discoveries, reviews or perspectives and help shape the future of sustainable food production.
🔗 https://t.co/aVpOeeyuNa
@plantgenome#Genomeengineering
Write more.
Write more.
Write more.
Write more.
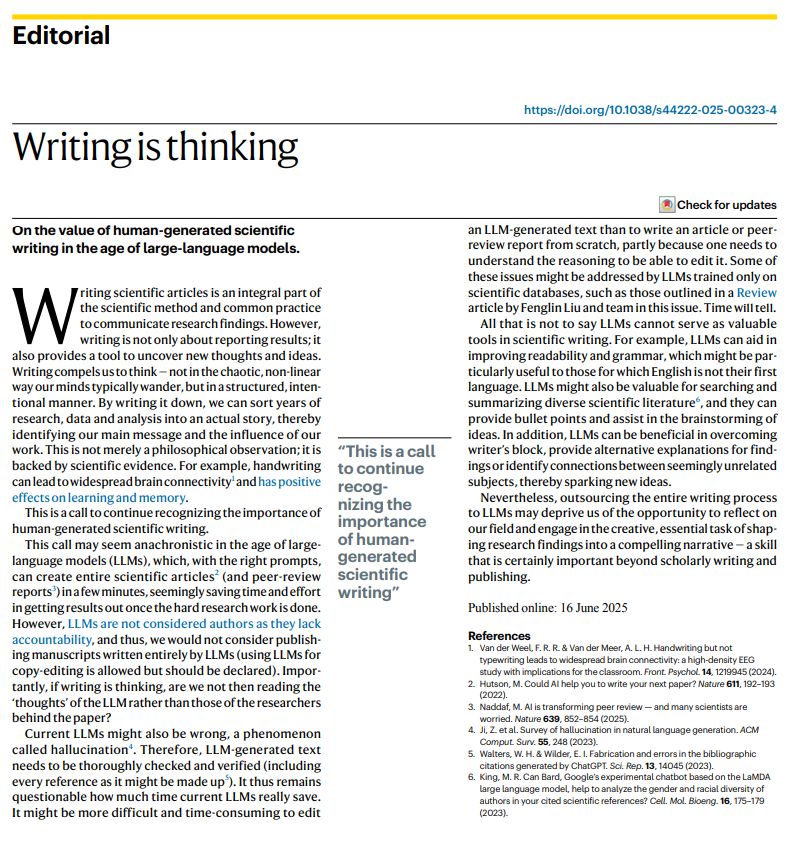
Because writing is thinking.
A 2025 Nature editorial argues that human-generated scientific writing is not only about reporting results.
“I will miss the creativity of teaching.”
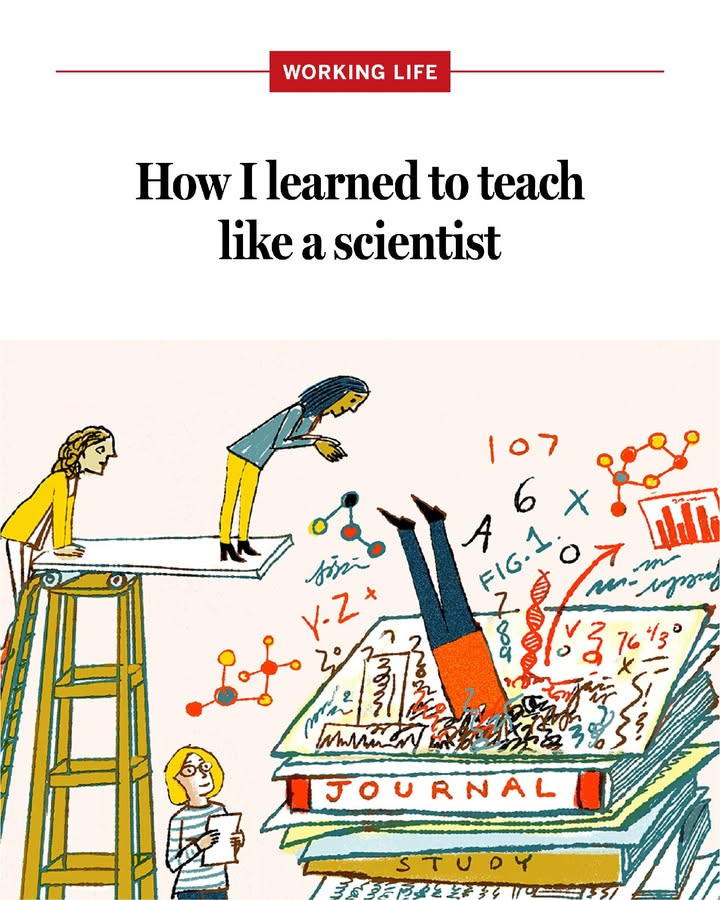
On #WorldTeachersDay, check out this Working Life from a retired professor emeritus on how she challenged students to think beyond facts—and how she learned to teach like a scientist. https://t.co/ln8M62PN2V
A Csi-miR3954b-CsCE70/CsPLA1
regulatory module
enhances citrus fruit resistance to Penicillium digitatum
by promoting phenolic acid and flavonoid biosynthesis: https://t.co/yUns7n2M94