@climon@merci The timeline, automated reporting, and the ability to write SQL with AI - or query your warehouse directly and simply - are all things folks like. And of course, everyone loves drag-and-drop project cards.
If you're more of a @ProductHunt person, we're live on there today as well. We thrive on candid feedback and would love to know what you think! https://t.co/Cx5Fq5Cpqr
Don’t leave half the info about your users on the table.
Experiments can tell you what people are doing, but not about why. For that, you have to speak to real people.
Check out our favorite tips on gleaning insights from real people: https://t.co/bgSSbx6A1Z
Don’t lose sleep over scheduling and experiment power.
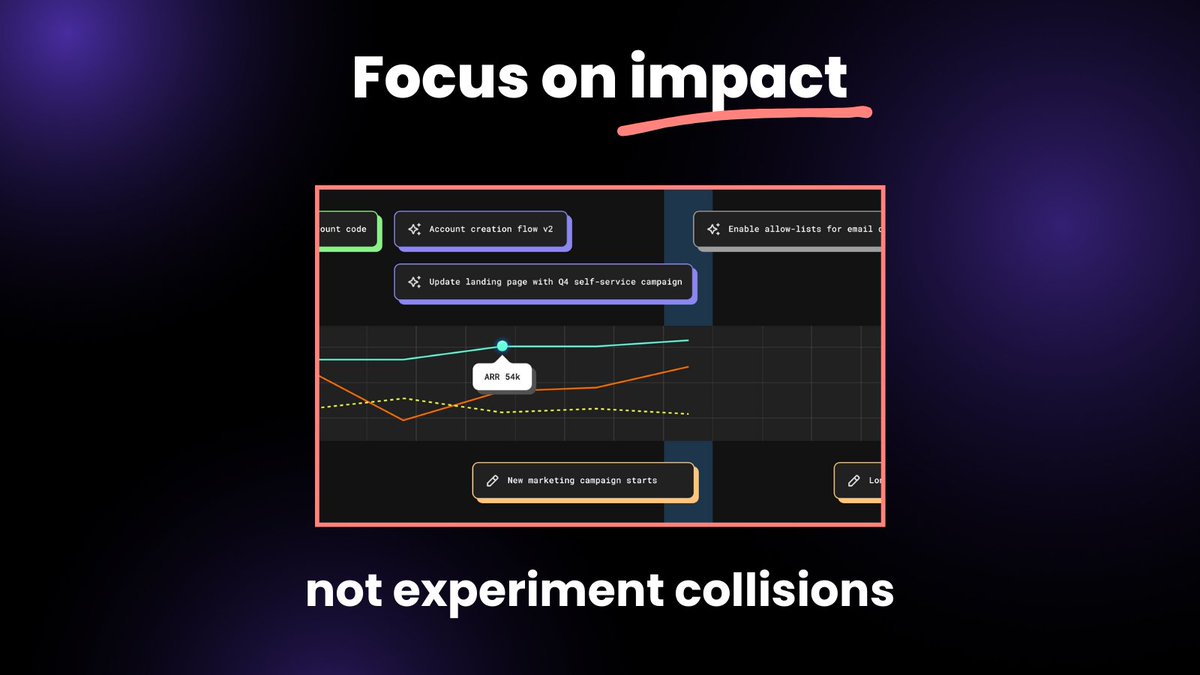
Panobi’s Timeline lets you see the big picture, both for planning and analyzing.
Get ahead of collisions, and finally understand all of the influences impacting your data. 🧠
Today we're releasing more chart types so that your team can add any type of analysis or metric once and then reference it later with a keystroke.
We support @awscloud@googlecloud@SnowflakeDB and we provide an SDK. ✨📈
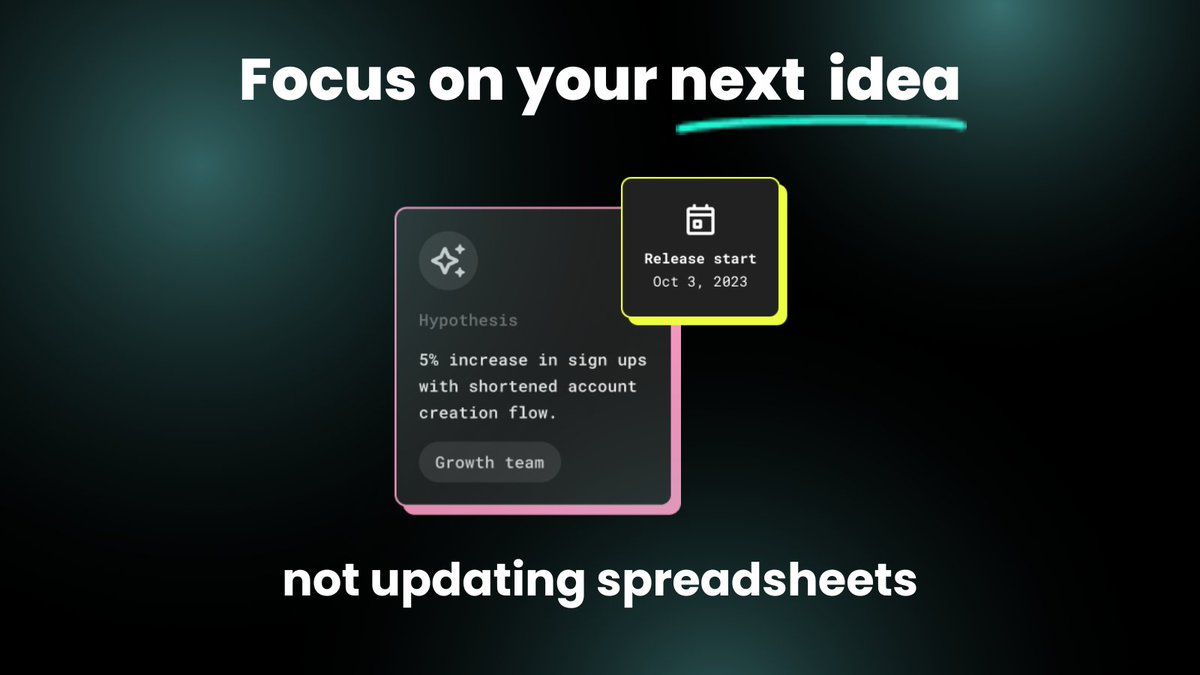
Don’t let high-potential ideas get lost in the shuffle!
Streamline your growth work in Panobi with Releases: your organized, prioritized backlog of experiments, with smart scheduling and feature flag integrations to keep everything up-to-date and in order. 🗓
👻Is that a ghostly chill or is it just roadmapping season? 😰
If you dread creating (yet another) spreadsheet, step out of the darkness and into the warm light of https://t.co/QKp3N2zgej 🏡🍵 where you can query your data and manage your experiments in one place. 👉
Growth teams can shoulder a disproportionate amount of responsibility.
So how do the most effective growth teams balance (and justify) figuring out what has an impact with actually producing that impact? 🤔
Here’s what we’ve found that works:
https://t.co/ORrthxVYgd
Photos from recent community meetups in Amsterdam, Berlin, Lisbon, and Poland.
All meetups are self-organized by the community, with a monthly sponsor covering drinks and food (thanks @panobihq for coving this month!).
You don’t need to lose a day each week to updating your stakeholders.
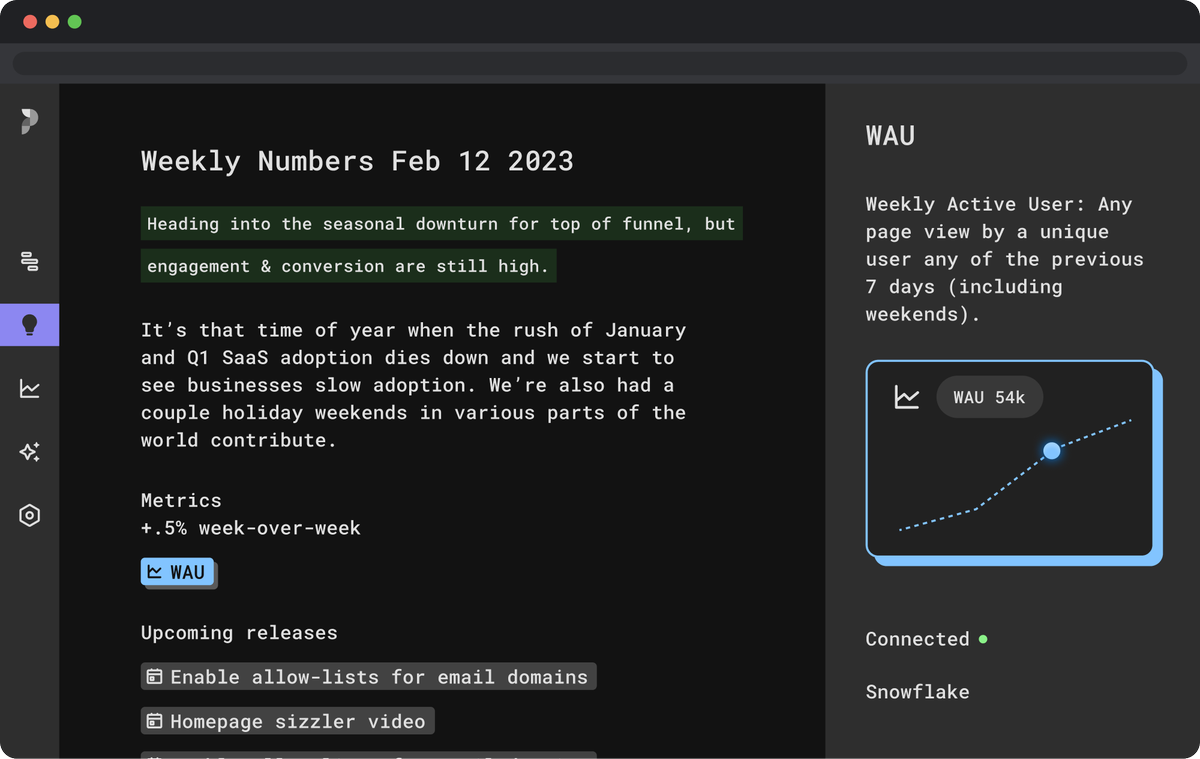
Automated reports keep everyone in the loop: Panobi gathers your experiment updates and calculates week-over-week changes to metrics, while you just polish and publish. ✨
Will an angry customer automatically churn? 😤😠
Nope. Strong feelings — positive or negative — are more closely related than total apathy.
Read our case for paying attention to customer anger: https://t.co/v3Uvv0OVgs
Stop competing for your data analyst’s time.
Panobi syncs with your data warehouse — so you can monitor key metrics alongside experiments you’re running. 📈 😎
Pull from Snowflake, BigQuery, Redshift, or your in-house data source.
There are 3 top product areas for growth experimentation:
🐣 the new user experience
💌 invites & referrals
🗺️ your app navigation!
https://t.co/U9ZHeDsDYZ
Enjoy your Friday morning cup of coffee and let us do the work. ☕️ 🌅
A freshly automated weekly update will arrive in your draft folder at 9am. We calculate the week-over-week change in your metrics and sort your releases. You add details, and publish. ✨