History didn't begin in 1980.
It is true that tropical cyclone (TC) activity (including the frequency of category five major hurricanes) has increased in the Atlantic since the 1980s, but that increase is 𝒂𝒍𝒎𝒐𝒔𝒕 𝒆𝒏𝒕𝒊𝒓𝒆𝒍𝒚 due to Atlantic Multidecadal Variability (AMV), which has been well-documented in the scientific literature if you bothered to read it instead of rehashing talking points you got from WFLA-TV's @WeatherProf or UPenn's Dr. @MichaelEMann.
Atlantic Multidecadal Variability (AMV), also known as the Atlantic Multidecadal Oscillation (AMO), operates on a 65-70-year cycle oscillating between positive (or warm) modes and negative (cool) modes with respect to North Atlantic sea surface temperature (SST) temporal variability (Schlesinger & Ramankutty, 1994). Positive modes correspond to high TC activity and negative modes correspond conversely to low activity.
🔗https://t.co/6MreWQteVo
The AMV / AMO has been in its positive phase since 1995, and that is when Atlantic TC activity suddenly increased. It is likely that the Atlantic Meridional Mode (AMM), which operates on interannual and decadal time scales, is linked to this multidecadal variability since, it too, has predominantly been in its positive phase since the mid-1990s.
🔗https://t.co/mrxtUKgwa1
Positive modes of AMV /AMO and AMM correspond to higher-than-average tropical North Atlantic SSTs and reduced vertical wind shear (i.e., the change in wind speed and/or direction with increasing height). On the other hand, negative modes correspond to lower SSTs and high vertical shear. You can see this in the image I attached on the left, which is adapted from Vimont & Kossin (2007).
🔗https://t.co/x76ptmOjDE
The effect of AMV on Atlantic TC activity has been explored in a number of studies, such as Goldenberg et al. (2001); Klotzbach & Gray (2008); Zhang et al. (2019); and Li et al. (2022).
🔗https://t.co/NIhhOmUWEc / open-access here: https://t.co/kG26v6L3Cn
🔗https://t.co/2BPv0PaEqC
🔗https://t.co/3Ia4BdCSyU
🔗https://t.co/6GDOzcoc6V
Thus, the increase in Atlantic TC activity since 1980 (but, really after 1995) is mostly an artifact of AMV, not the gradual creep upward in ocean temperature caused by global warming.
What about the “unprecedented” number of category five hurricanes in recent years? 🤔
Well, that statistic is true if you take the raw numbers at face value. But it is irresponsible to do that. 🙅♂️
Prior to 1966, there were no operational weather satellites in low-earth orbit allowing meteorologists to monitor TCs out over the open ocean. So, unless a tropical storm (TS), hurricane (HU) or major hurricane (MH) made landfall on a densely populated coastline or passed by a ship, it is impossible to know exactly how many storms there were back then. 🛰️
Only in 1966, with the launch of NASA's Environmental Science Services Administration (ESSA) Satellites, ESSA-1 and ESSA-2, that visible imagery was achieved so that TCs could be continuously tracked from space.
🔗https://t.co/Yixt9XhpS7
And, only since the 1980s has satellite coverage been good at a global scale. Since the early-to-mid-1990s the technology (e.g., microwave sounding units) finally became good enough for meteorologists to get a good picture of storm structure and intensity, especially out over open water far removed from land, in the absence of dropsonde data from aircraft reconnaissance missions.
Prior to the 1980s, TS, HU and MH counts are likely underestimated and that range of uncertainty widens significantly the further back in time we go. As such, for a fair apples to oranges comparison, we must estimate the number of “missing” storms and correct for that in the raw data. This was first done in Vecchi & Knutson (2008) and updated in Vecchi et al. (2021) to include MHs.
🔗https://t.co/Evrg8lsl5R
🔗https://t.co/YrzF0SNPwx
In the image on the top right, I attached Fig. 2 from Vecchi et al. (2021). The red line shows the estimated number of “missed” HUs (left panel) and MHs (right panel) per year between 1851 and 2019 (study period). The red shading shows the uncertainty in those estimates. The blue line shows the total number of HUs (left panel) and MHs (right panel) over that same time interval with the blue shading representing the uncertainty. The top two panels show annual counts while the bottom two panels smooth those out into 15-year centered averages.
As can be seen from the smoothed plots, there is no century-scale upward trend in either HUs or MHs in the Atlantic once the data is homogenized to correct for “missing” storms. The increase since the 1970s is a recovery from a deep minimum in TC activity from the 1970s to the early 1990s. And, of course, a sinusoidal pattern oscillating between high TC activity (e.g., the late 19th century, mid-20th century and 1990s-present) and comparatively low activity (e.g., the early and late 20th century) is exhibited.
One more thing that needs to be considered here is that the way in which TC intensities are assigned has changed in recent decades, and these changes have not been accounted for when doing climate analyses spanning more than 50 years.
TCs are rated according to the Saffir-Simpson wind scale, which assigns storms a category based on maximum sustained wind speed of the storm and the damage incurred by it if it made landfall. Maximum sustained wind speed is defined as,
🗨️ “[𝑇]ℎ𝑒 ℎ𝑖𝑔ℎ𝑒𝑠𝑡 𝑎𝑣𝑒𝑟𝑎𝑔𝑒 𝑤𝑖𝑛𝑑 𝑠𝑝𝑒𝑒𝑑 𝑚𝑒𝑎𝑠𝑢𝑟𝑒𝑑 𝑎𝑡 𝑎𝑛 𝑢𝑛𝑜𝑏𝑠𝑡𝑟𝑢𝑐𝑡𝑒𝑑 𝑝𝑜𝑖𝑛𝑡 𝑎𝑛𝑑 𝑡𝑖𝑚𝑒 𝑎𝑡 10-𝑚 𝑎𝑙𝑡𝑖𝑡𝑢����𝑒 𝑑𝑢𝑟𝑖𝑛𝑔 𝑒𝑖𝑡ℎ𝑒𝑟 𝑎 1-𝑚𝑖𝑛 𝑡𝑖𝑚𝑒 𝑠𝑝𝑎𝑛 (𝑎𝑠 𝑑𝑒𝑓𝑖𝑛𝑒𝑑 𝑏𝑦 𝑡ℎ𝑒 𝑈𝑛𝑖𝑡𝑒𝑑 𝑆𝑡𝑎𝑡𝑒𝑠 𝑁𝑎𝑡𝑖𝑜𝑛𝑎𝑙 𝑊𝑒𝑎𝑡ℎ𝑒𝑟 𝑆𝑒𝑟𝑣𝑖𝑐𝑒 𝑎𝑛𝑑 𝑡ℎ𝑒 𝐽𝑜𝑖𝑛𝑡 𝑇𝑦𝑝ℎ𝑜𝑜𝑛 𝑊𝑎𝑟𝑛𝑖𝑛𝑔 𝐶𝑒𝑛𝑡𝑒𝑟) 𝑜𝑟 𝑎 10-𝑚𝑖𝑛 𝑡𝑖𝑚𝑒 𝑠𝑝𝑎𝑛 (𝑎𝑠 𝑑𝑒𝑓𝑖𝑛𝑒𝑑 𝑏𝑦 𝑡ℎ𝑒 𝑊𝑜𝑟𝑙𝑑 𝑀𝑒𝑡𝑒𝑜𝑟𝑜𝑙𝑜𝑔𝑖𝑐𝑎𝑙 𝑂𝑟𝑔𝑎𝑛𝑖𝑧𝑎𝑡𝑖𝑜𝑛).”
🔗https://t.co/cPq0Hx2iRr
Prior to the mid-1940s, TCs were rated according to this strict definition. Wind speeds were measured by an anemometer placed 10 meters above the ground at an unobstructed point. So, when a TS and HU made landfall or passed by a ship, the wind speed and gusts measured in-situ were used to rate its overall intensity at that point, and damage was also used in a similar way that the Enhanced Fujita (EF) scale is used to rate tornadoes.
That is no longer the case.
Beginning in the 1940s, aircraft began flying into TC eyewalls to gather wind speed, temperature, pressure and humidity data to give meteorologists a true picture of storm structure. Since the 1990s, the NOAA National Hurricane Center (NHC) has used the aircraft recon data at flight level (~10,000 feet / 700 hPa) to 𝑒𝑠𝑡𝑖𝑚𝑎𝑡𝑒 the maximum sustained wind speed at 10 meters above the surface by applying a 10% reduction to account for increased friction near the surface (e.g., Franklin et al., 2003).
🔗https://t.co/4D28AFlV3W
The problem with this methodology is that when we get some near-surface wind speed observations as a storm nears landfall (or passes near an island), there seldom are in-situ measurements corroborating the flight-level wind speeds with a 10% reduction, which means that the frictional accelerations at the surface are higher than the NHC estimates it to be. And, it is higher over land than it is over water, and that is not taken into consideration.
During Hurricane Ian in 2022, for example, there were no near-surface wind speed measurements that could corroborate a category four-strength hurricane except for a few gusts (gusts are not wind speed). While the damage from the storm surge was astronomical, there was little, if any significant wind damage. In the 1920s or 1930s, Hurricane Ian would have likely been rated as a high-end category three.
Since the methodology for rating has changed due to the advent of recon data [and later, the 10% reduction formula], TCs are rated stronger today than they were in the past, but that's not a climate-related trend. It is purely an artifact of technological advancement and a few arbitrary decisions.
Case in point, NOAA researchers Dr. Andrew B. Hagen and Dr. Chris Landsea found in their 2012 paper that 80% of category five hurricanes observed with today's technology would have been rated as category four or lower with the available technology in the 1940s and 1950s (pre-satellite era).
🔗https://t.co/dMVi5rtd4l
By looking at the 10 category five Atlantic hurricanes occurring between Andrew (1992) and Felix (2007), only aforementioned Andrew and Mitch (1998) would have been rated as a category five had they occurred in the 1940s and 1950s without satellites. And, based on their tracks, prior to aircraft recon flights, I would go out on a limb to say that only Andrew (1992) would have been rated as a category five given it made landfall as one in a densely populated area. In other words, 90% of category five hurricanes in recent years would have been “missed” or underestimated before the 1940s.
So, the “unprecedented” number of MHs that have reached category five strength in the Atlantic basin in recent years has a heck of a lot to do with improved observational capabilities; it has little or nothing to do with anthropogenic-induced climate change.
Did you know? 🤔
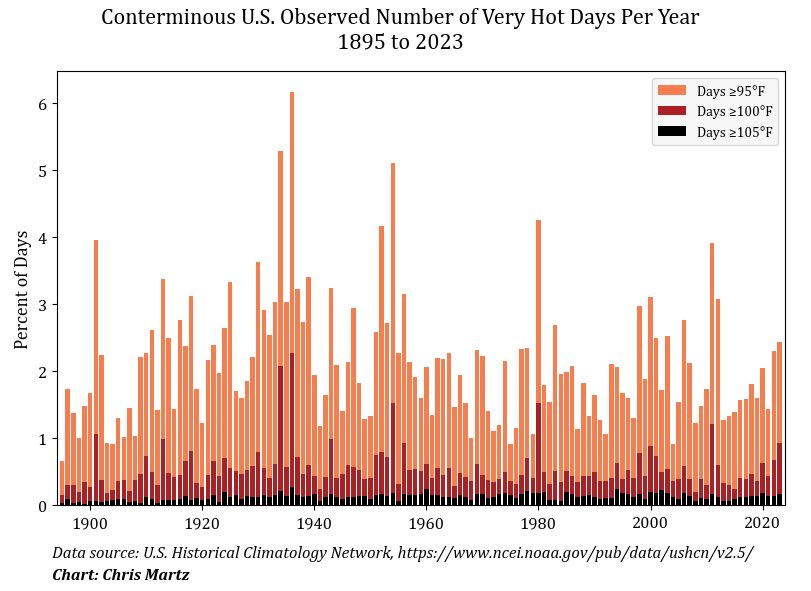
The average annual number of extremely hot days in the United States have 𝒅𝒆𝒄𝒓𝒆𝒂𝒔𝒆𝒅 since 1895.
While this isn’t the case everywhere, in the Lower 48, the average number of days ≥95° was 18% lower during the 60-year period 1961-2020 than during the period 1901-1960.
Good luck finding honest reporting of these statistics in the Washington Post, New York Times or on CNN.
Nowhere has large scale solar or wind energy generation reduced costs.
Investment in Australian coal fired generation faded out because government policy over decades has made it risky. If not for that, we wouldn't be seeing the closure of the plants. We would have still been enjoying some of the cheapest electricity in the world.
#auspol #ausecon @LibertariansAus
@BlackHillCraig@JEChalmers Correct: GenCost is elecricity at the gate of the panel "desert" of the Wind "farm" before the BIG NEW GRID or the VERY EXPENSIVE Batteries (buckets of electrons).
AND
they only work 1 day out of 5 (Solowr) and 2 days out of 5 (Windown)...BAD...
Nuclear now! 9 days out of 10!
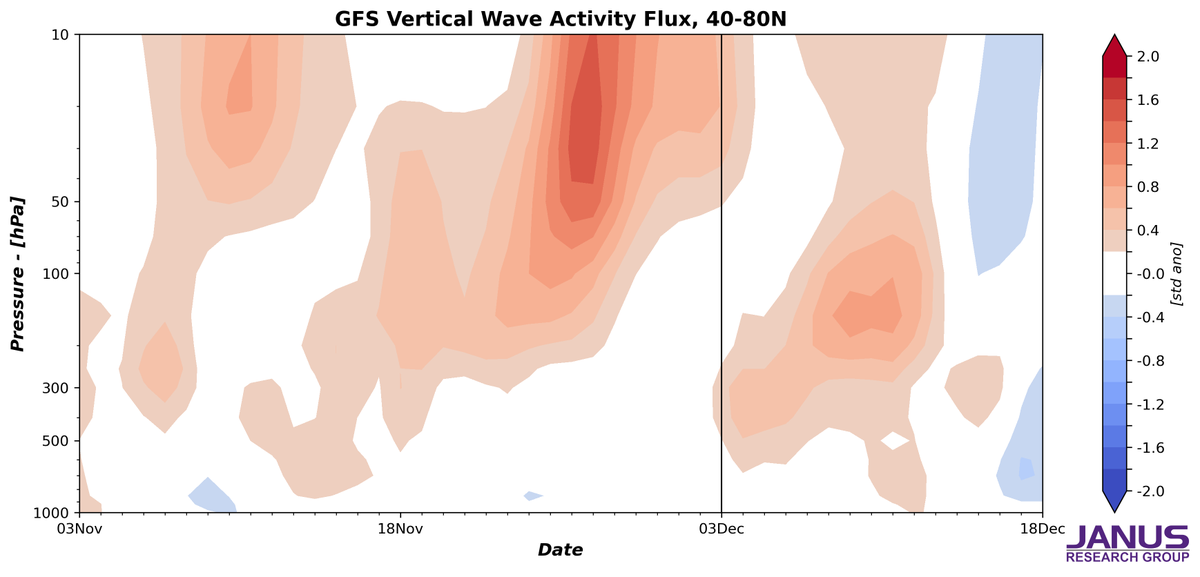
Hard to find more textbook looking stretched #PolarVortex (PV) than what's predicted mid-month, stretched looking PV, red/blue striation in upward Rossby wave energy, wave reflection of wave energy off of PV, opposite tilting waves in vertical & #cold in East Asia & North America
@Peter_Fitz@DeanChill He is NOT an expert on quality of electricity for keeping:
1. The timing signals that keep the integrity of financial transactions, global banking....
2 . Energy density required for making aluminium, titanium....
2(a) their downstream industries ...
3. Every microsecond 24/7/365
I worked for 20 years in "Big Ag" so you don’t have to. This is what they don’t want you to know:
Farmers don’t have time for conspiracy theories.
Romanticize farming all you want, but without modern tools, you’d starve.
GM crops aren't frankenfood.
They cut pesticide use, resist drought, and improve yields, all while passing some of the strictest safety checks in science.
They are the least unknown crops.
Your food is safe. Period.
Pesticides are tested more rigorously than most medicines.
Farming isn’t killing the planet.
Modern farming uses less land, less water, and fewer inputs than ever before. Innovation is the solution, not the problem.
Organic farming still use pesticides. Some are more toxic and less effective than synthetic alternatives, meaning higher doses are needed.
If you really care about feeding the world and protecting the planet, focus on facts, not fear.
My name is Simon and my goal is to make people smarter, not angrier.
Drop a “Hi” in the comments and let me know if you have any questions about Ag!
@aaronshem@MatthewWielicki Also:
Fastest growth in human and animal population
Greatest eradication of disease and poverty
Elimination of cold and damp in houses
Education
Irrational fear and genocide.
Warming gives life, humans can cope with change - always have.
Innovation will not stop.
Smile, breathe!
Wise words
“My name’s Frank. I’m 64, a retired electrician.
Forty-two years I spent running wires through houses, fixing breakers, making sure people had light in their kitchens and heat in their winters. Never once did anyone ask me where I went to college. Mostly, they just wanted to know if I could get the power back on before their ice cream melted.
Last May, I was at my granddaughter Emily’s school career day. You know the drill — doctors, lawyers, a software guy in a slick suit talking about “scaling startups.” I was the only one there with a tool belt and work boots.
When it was my turn, I told the kids, “I don’t have a degree. I’ve never sat in a lecture hall. But I’ve wired schools, hospitals, and your principal’s house. And when the hospital generator failed during a snowstorm in ’98, I was the one in the basement with a flashlight, keeping the lights on for newborn babies upstairs.”
The kids leaned forward. They had questions — real ones. “How do you fix stuff in the dark?” “Do you make a lot of money?” “Do you ever get zapped?” (Yes, once, and it’ll curl your hair.)
When the bell rang, one boy hung back. Small kid, freckles, hoodie too big for him. He mumbled, “My uncle’s a plumber. People laugh at him ’cause he didn’t finish high school. But… he’s the only one in the family who can fix anything.”
I looked that boy in the eye and said, “Kid, your uncle’s a hero. When your toilet overflows at midnight, Harvard ain’t sending anyone. A plumber is.”
Here’s the thing nobody told me when I was young — the world doesn’t run without tradespeople. You can have all the engineers you want, but if nobody builds the house, wires the power, or lays the pipes, those blueprints just sit in a drawer.
We’ve made it sound like trades are what you do if you can’t go to college, instead of a path you choose because you like working with your hands, solving problems, and seeing your work stand solid for decades.
Four years after high school, some kids walk away with diplomas. Others walk away with zero debt, a union card, and a skill they can take anywhere in the world. And guess what? When your furnace dies in January, it’s not the diploma that saves you.
A few weeks ago, that same freckled kid’s mom stopped me at the grocery store. She said, “You probably don’t remember, but you told my son trades are important. He’s shadowing his uncle this summer. First time I’ve seen him excited about anything in years.”
That’s the part we forget — for some kids, knowing their path is respected changes everything. It’s not about “just” fixing wires or pipes. It’s about pride. Purpose. The kind that sticks with you long after the job’s done.
So next time you meet a teenager, don’t just ask, “Where are you going to college?” Ask, “What’s your plan?” And if they say, “I’m learning to weld,” or “I’m starting an apprenticeship,” smile big and say, “That’s fantastic. We’re going to need you.”
Because we will. More than ever. And when the lights go out, you’ll be glad they showed up.”
Nothing is perfect, but nuclear provides carbon-free electricity 24/7, uses less land than any other source & keeps communities powered for generations….
That’s as close to perfect as energy gets⚛️
Once again, nuclear disinformation goes unchecked by Australian media.
This claim that nuclear in Australia would cost $600 billion assumed that nuclear costed more than 5x more than even the CSIRO's estimate.
The ABC should issue an apology and correction for repeating it once again.
@simonahac@tedobrienmp@AngusTaylorMP Simple Simon's equations do not work,
I do not assert he is a jerk,
But energy is not his gig!
Grumpy 😠 Simon,
Not surprised,
The economy is not a toy,
Silver spoons....
Do not employ!
Selah....
JOHN CLAUSER, 2022 PHYSICS NOBEL PRIZE WINNER:
"I can very confidently assert, there is no climate emergency.
As much as it may upset many people, my message is the planet is NOT in peril.
Atmospheric CO2 and methane have negligible effect on the climate.
The policies government have been implementing are totally unnecessary and should be eliminated.
So far, [we] have totally misidentified what is the dominant process in controlling the climate, and all of the various models are based on incomplete and incorrect physics.
The dominant process, is “the cloud-sunlight-reflexivity thermostat mechanism.
Clouds are all bright white, and they reflected 90% of the sunlight back into space making them the most crucial yet most overlooked aspect of the climate system.
Two-thirds of the Earth are ocean. The Pacific Ocean alone is half the Earth. The average cloud cover for the Earth is 67%; about 50% over land and 75% over oceans.
I claim that the above conspicuous properties of clouds are the missing part of the puzzle."


![ChrisMartzWX's tweet photo. History didn't begin in 1980.
It is true that tropical cyclone (TC) activity (including the frequency of category five major hurricanes) has increased in the Atlantic since the 1980s, but that increase is 𝒂𝒍𝒎𝒐𝒔𝒕 𝒆𝒏𝒕𝒊𝒓𝒆𝒍𝒚 due to Atlantic Multidecadal Variability (AMV), which has been well-documented in the scientific literature if you bothered to read it instead of rehashing talking points you got from WFLA-TV's @WeatherProf or UPenn's Dr. @MichaelEMann.
Atlantic Multidecadal Variability (AMV), also known as the Atlantic Multidecadal Oscillation (AMO), operates on a 65-70-year cycle oscillating between positive (or warm) modes and negative (cool) modes with respect to North Atlantic sea surface temperature (SST) temporal variability (Schlesinger & Ramankutty, 1994). Positive modes correspond to high TC activity and negative modes correspond conversely to low activity.
🔗https://t.co/6MreWQteVo
The AMV / AMO has been in its positive phase since 1995, and that is when Atlantic TC activity suddenly increased. It is likely that the Atlantic Meridional Mode (AMM), which operates on interannual and decadal time scales, is linked to this multidecadal variability since, it too, has predominantly been in its positive phase since the mid-1990s.
🔗https://t.co/mrxtUKgwa1
Positive modes of AMV /AMO and AMM correspond to higher-than-average tropical North Atlantic SSTs and reduced vertical wind shear (i.e., the change in wind speed and/or direction with increasing height). On the other hand, negative modes correspond to lower SSTs and high vertical shear. You can see this in the image I attached on the left, which is adapted from Vimont & Kossin (2007).
🔗https://t.co/x76ptmOjDE
The effect of AMV on Atlantic TC activity has been explored in a number of studies, such as Goldenberg et al. (2001); Klotzbach & Gray (2008); Zhang et al. (2019); and Li et al. (2022).
🔗https://t.co/NIhhOmUWEc / open-access here: https://t.co/kG26v6L3Cn
🔗https://t.co/2BPv0PaEqC
🔗https://t.co/3Ia4BdCSyU
🔗https://t.co/6GDOzcoc6V
Thus, the increase in Atlantic TC activity since 1980 (but, really after 1995) is mostly an artifact of AMV, not the gradual creep upward in ocean temperature caused by global warming.
What about the “unprecedented” number of category five hurricanes in recent years? 🤔
Well, that statistic is true if you take the raw numbers at face value. But it is irresponsible to do that. 🙅♂️
Prior to 1966, there were no operational weather satellites in low-earth orbit allowing meteorologists to monitor TCs out over the open ocean. So, unless a tropical storm (TS), hurricane (HU) or major hurricane (MH) made landfall on a densely populated coastline or passed by a ship, it is impossible to know exactly how many storms there were back then. 🛰️
Only in 1966, with the launch of NASA's Environmental Science Services Administration (ESSA) Satellites, ESSA-1 and ESSA-2, that visible imagery was achieved so that TCs could be continuously tracked from space.
🔗https://t.co/Yixt9XhpS7
And, only since the 1980s has satellite coverage been good at a global scale. Since the early-to-mid-1990s the technology (e.g., microwave sounding units) finally became good enough for meteorologists to get a good picture of storm structure and intensity, especially out over open water far removed from land, in the absence of dropsonde data from aircraft reconnaissance missions.
Prior to the 1980s, TS, HU and MH counts are likely underestimated and that range of uncertainty widens significantly the further back in time we go. As such, for a fair apples to oranges comparison, we must estimate the number of “missing” storms and correct for that in the raw data. This was first done in Vecchi & Knutson (2008) and updated in Vecchi et al. (2021) to include MHs.
🔗https://t.co/Evrg8lsl5R
🔗https://t.co/YrzF0SNPwx
In the image on the top right, I attached Fig. 2 from Vecchi et al. (2021). The red line shows the estimated number of “missed” HUs (left panel) and MHs (right panel) per year between 1851 and 2019 (study period). The red shading shows the uncertainty in those estimates. The blue line shows the total number of HUs (left panel) and MHs (right panel) over that same time interval with the blue shading representing the uncertainty. The top two panels show annual counts while the bottom two panels smooth those out into 15-year centered averages.
As can be seen from the smoothed plots, there is no century-scale upward trend in either HUs or MHs in the Atlantic once the data is homogenized to correct for “missing” storms. The increase since the 1970s is a recovery from a deep minimum in TC activity from the 1970s to the early 1990s. And, of course, a sinusoidal pattern oscillating between high TC activity (e.g., the late 19th century, mid-20th century and 1990s-present) and comparatively low activity (e.g., the early and late 20th century) is exhibited.
One more thing that needs to be considered here is that the way in which TC intensities are assigned has changed in recent decades, and these changes have not been accounted for when doing climate analyses spanning more than 50 years.
TCs are rated according to the Saffir-Simpson wind scale, which assigns storms a category based on maximum sustained wind speed of the storm and the damage incurred by it if it made landfall. Maximum sustained wind speed is defined as,
🗨️ “[𝑇]ℎ𝑒 ℎ𝑖𝑔ℎ𝑒𝑠𝑡 𝑎𝑣𝑒𝑟𝑎𝑔𝑒 𝑤𝑖𝑛𝑑 𝑠𝑝𝑒𝑒𝑑 𝑚𝑒𝑎𝑠𝑢𝑟𝑒𝑑 𝑎𝑡 𝑎𝑛 𝑢𝑛𝑜𝑏𝑠𝑡𝑟𝑢𝑐𝑡𝑒𝑑 𝑝𝑜𝑖𝑛𝑡 𝑎𝑛𝑑 𝑡𝑖𝑚𝑒 𝑎𝑡 10-𝑚 𝑎𝑙𝑡𝑖𝑡𝑢����𝑒 𝑑𝑢𝑟𝑖𝑛𝑔 𝑒𝑖𝑡ℎ𝑒𝑟 𝑎 1-𝑚𝑖𝑛 𝑡𝑖𝑚𝑒 𝑠𝑝𝑎𝑛 (𝑎𝑠 𝑑𝑒𝑓𝑖𝑛𝑒𝑑 𝑏𝑦 𝑡ℎ𝑒 𝑈𝑛𝑖𝑡𝑒𝑑 𝑆𝑡𝑎𝑡𝑒𝑠 𝑁𝑎𝑡𝑖𝑜𝑛𝑎𝑙 𝑊𝑒𝑎𝑡ℎ𝑒𝑟 𝑆𝑒𝑟𝑣𝑖𝑐𝑒 𝑎𝑛𝑑 𝑡ℎ𝑒 𝐽𝑜𝑖𝑛𝑡 𝑇𝑦𝑝ℎ𝑜𝑜𝑛 𝑊𝑎𝑟𝑛𝑖𝑛𝑔 𝐶𝑒𝑛𝑡𝑒𝑟) 𝑜𝑟 𝑎 10-𝑚𝑖𝑛 𝑡𝑖𝑚𝑒 𝑠𝑝𝑎𝑛 (𝑎𝑠 𝑑𝑒𝑓𝑖𝑛𝑒𝑑 𝑏𝑦 𝑡ℎ𝑒 𝑊𝑜𝑟𝑙𝑑 𝑀𝑒𝑡𝑒𝑜𝑟𝑜𝑙𝑜𝑔𝑖𝑐𝑎𝑙 𝑂𝑟𝑔𝑎𝑛𝑖𝑧𝑎𝑡𝑖𝑜𝑛).”
🔗https://t.co/cPq0Hx2iRr
Prior to the mid-1940s, TCs were rated according to this strict definition. Wind speeds were measured by an anemometer placed 10 meters above the ground at an unobstructed point. So, when a TS and HU made landfall or passed by a ship, the wind speed and gusts measured in-situ were used to rate its overall intensity at that point, and damage was also used in a similar way that the Enhanced Fujita (EF) scale is used to rate tornadoes.
That is no longer the case.
Beginning in the 1940s, aircraft began flying into TC eyewalls to gather wind speed, temperature, pressure and humidity data to give meteorologists a true picture of storm structure. Since the 1990s, the NOAA National Hurricane Center (NHC) has used the aircraft recon data at flight level (~10,000 feet / 700 hPa) to 𝑒𝑠𝑡𝑖𝑚𝑎𝑡𝑒 the maximum sustained wind speed at 10 meters above the surface by applying a 10% reduction to account for increased friction near the surface (e.g., Franklin et al., 2003).
🔗https://t.co/4D28AFlV3W
The problem with this methodology is that when we get some near-surface wind speed observations as a storm nears landfall (or passes near an island), there seldom are in-situ measurements corroborating the flight-level wind speeds with a 10% reduction, which means that the frictional accelerations at the surface are higher than the NHC estimates it to be. And, it is higher over land than it is over water, and that is not taken into consideration.
During Hurricane Ian in 2022, for example, there were no near-surface wind speed measurements that could corroborate a category four-strength hurricane except for a few gusts (gusts are not wind speed). While the damage from the storm surge was astronomical, there was little, if any significant wind damage. In the 1920s or 1930s, Hurricane Ian would have likely been rated as a high-end category three.
Since the methodology for rating has changed due to the advent of recon data [and later, the 10% reduction formula], TCs are rated stronger today than they were in the past, but that's not a climate-related trend. It is purely an artifact of technological advancement and a few arbitrary decisions.
Case in point, NOAA researchers Dr. Andrew B. Hagen and Dr. Chris Landsea found in their 2012 paper that 80% of category five hurricanes observed with today's technology would have been rated as category four or lower with the available technology in the 1940s and 1950s (pre-satellite era).
🔗https://t.co/dMVi5rtd4l
By looking at the 10 category five Atlantic hurricanes occurring between Andrew (1992) and Felix (2007), only aforementioned Andrew and Mitch (1998) would have been rated as a category five had they occurred in the 1940s and 1950s without satellites. And, based on their tracks, prior to aircraft recon flights, I would go out on a limb to say that only Andrew (1992) would have been rated as a category five given it made landfall as one in a densely populated area. In other words, 90% of category five hurricanes in recent years would have been “missed” or underestimated before the 1940s.
So, the “unprecedented” number of MHs that have reached category five strength in the Atlantic basin in recent years has a heck of a lot to do with improved observational capabilities; it has little or nothing to do with anthropogenic-induced climate change.](https://pbs.twimg.com/media/G42P80TXQAAtkL4.png)
![ChrisMartzWX's tweet photo. History didn't begin in 1980.
It is true that tropical cyclone (TC) activity (including the frequency of category five major hurricanes) has increased in the Atlantic since the 1980s, but that increase is 𝒂𝒍𝒎𝒐𝒔𝒕 𝒆𝒏𝒕𝒊𝒓𝒆𝒍𝒚 due to Atlantic Multidecadal Variability (AMV), which has been well-documented in the scientific literature if you bothered to read it instead of rehashing talking points you got from WFLA-TV's @WeatherProf or UPenn's Dr. @MichaelEMann.
Atlantic Multidecadal Variability (AMV), also known as the Atlantic Multidecadal Oscillation (AMO), operates on a 65-70-year cycle oscillating between positive (or warm) modes and negative (cool) modes with respect to North Atlantic sea surface temperature (SST) temporal variability (Schlesinger & Ramankutty, 1994). Positive modes correspond to high TC activity and negative modes correspond conversely to low activity.
🔗https://t.co/6MreWQteVo
The AMV / AMO has been in its positive phase since 1995, and that is when Atlantic TC activity suddenly increased. It is likely that the Atlantic Meridional Mode (AMM), which operates on interannual and decadal time scales, is linked to this multidecadal variability since, it too, has predominantly been in its positive phase since the mid-1990s.
🔗https://t.co/mrxtUKgwa1
Positive modes of AMV /AMO and AMM correspond to higher-than-average tropical North Atlantic SSTs and reduced vertical wind shear (i.e., the change in wind speed and/or direction with increasing height). On the other hand, negative modes correspond to lower SSTs and high vertical shear. You can see this in the image I attached on the left, which is adapted from Vimont & Kossin (2007).
🔗https://t.co/x76ptmOjDE
The effect of AMV on Atlantic TC activity has been explored in a number of studies, such as Goldenberg et al. (2001); Klotzbach & Gray (2008); Zhang et al. (2019); and Li et al. (2022).
🔗https://t.co/NIhhOmUWEc / open-access here: https://t.co/kG26v6L3Cn
🔗https://t.co/2BPv0PaEqC
🔗https://t.co/3Ia4BdCSyU
🔗https://t.co/6GDOzcoc6V
Thus, the increase in Atlantic TC activity since 1980 (but, really after 1995) is mostly an artifact of AMV, not the gradual creep upward in ocean temperature caused by global warming.
What about the “unprecedented” number of category five hurricanes in recent years? 🤔
Well, that statistic is true if you take the raw numbers at face value. But it is irresponsible to do that. 🙅♂️
Prior to 1966, there were no operational weather satellites in low-earth orbit allowing meteorologists to monitor TCs out over the open ocean. So, unless a tropical storm (TS), hurricane (HU) or major hurricane (MH) made landfall on a densely populated coastline or passed by a ship, it is impossible to know exactly how many storms there were back then. 🛰️
Only in 1966, with the launch of NASA's Environmental Science Services Administration (ESSA) Satellites, ESSA-1 and ESSA-2, that visible imagery was achieved so that TCs could be continuously tracked from space.
🔗https://t.co/Yixt9XhpS7
And, only since the 1980s has satellite coverage been good at a global scale. Since the early-to-mid-1990s the technology (e.g., microwave sounding units) finally became good enough for meteorologists to get a good picture of storm structure and intensity, especially out over open water far removed from land, in the absence of dropsonde data from aircraft reconnaissance missions.
Prior to the 1980s, TS, HU and MH counts are likely underestimated and that range of uncertainty widens significantly the further back in time we go. As such, for a fair apples to oranges comparison, we must estimate the number of “missing” storms and correct for that in the raw data. This was first done in Vecchi & Knutson (2008) and updated in Vecchi et al. (2021) to include MHs.
🔗https://t.co/Evrg8lsl5R
🔗https://t.co/YrzF0SNPwx
In the image on the top right, I attached Fig. 2 from Vecchi et al. (2021). The red line shows the estimated number of “missed” HUs (left panel) and MHs (right panel) per year between 1851 and 2019 (study period). The red shading shows the uncertainty in those estimates. The blue line shows the total number of HUs (left panel) and MHs (right panel) over that same time interval with the blue shading representing the uncertainty. The top two panels show annual counts while the bottom two panels smooth those out into 15-year centered averages.
As can be seen from the smoothed plots, there is no century-scale upward trend in either HUs or MHs in the Atlantic once the data is homogenized to correct for “missing” storms. The increase since the 1970s is a recovery from a deep minimum in TC activity from the 1970s to the early 1990s. And, of course, a sinusoidal pattern oscillating between high TC activity (e.g., the late 19th century, mid-20th century and 1990s-present) and comparatively low activity (e.g., the early and late 20th century) is exhibited.
One more thing that needs to be considered here is that the way in which TC intensities are assigned has changed in recent decades, and these changes have not been accounted for when doing climate analyses spanning more than 50 years.
TCs are rated according to the Saffir-Simpson wind scale, which assigns storms a category based on maximum sustained wind speed of the storm and the damage incurred by it if it made landfall. Maximum sustained wind speed is defined as,
🗨️ “[𝑇]ℎ𝑒 ℎ𝑖𝑔ℎ𝑒𝑠𝑡 𝑎𝑣𝑒𝑟𝑎𝑔𝑒 𝑤𝑖𝑛𝑑 𝑠𝑝𝑒𝑒𝑑 𝑚𝑒𝑎𝑠𝑢𝑟𝑒𝑑 𝑎𝑡 𝑎𝑛 𝑢𝑛𝑜𝑏𝑠𝑡𝑟𝑢𝑐𝑡𝑒𝑑 𝑝𝑜𝑖𝑛𝑡 𝑎𝑛𝑑 𝑡𝑖𝑚𝑒 𝑎𝑡 10-𝑚 𝑎𝑙𝑡𝑖𝑡𝑢����𝑒 𝑑𝑢𝑟𝑖𝑛𝑔 𝑒𝑖𝑡ℎ𝑒𝑟 𝑎 1-𝑚𝑖𝑛 𝑡𝑖𝑚𝑒 𝑠𝑝𝑎𝑛 (𝑎𝑠 𝑑𝑒𝑓𝑖𝑛𝑒𝑑 𝑏𝑦 𝑡ℎ𝑒 𝑈𝑛𝑖𝑡𝑒𝑑 𝑆𝑡𝑎𝑡𝑒𝑠 𝑁𝑎𝑡𝑖𝑜𝑛𝑎𝑙 𝑊𝑒𝑎𝑡ℎ𝑒𝑟 𝑆𝑒𝑟𝑣𝑖𝑐𝑒 𝑎𝑛𝑑 𝑡ℎ𝑒 𝐽𝑜𝑖𝑛𝑡 𝑇𝑦𝑝ℎ𝑜𝑜𝑛 𝑊𝑎𝑟𝑛𝑖𝑛𝑔 𝐶𝑒𝑛𝑡𝑒𝑟) 𝑜𝑟 𝑎 10-𝑚𝑖𝑛 𝑡𝑖𝑚𝑒 𝑠𝑝𝑎𝑛 (𝑎𝑠 𝑑𝑒𝑓𝑖𝑛𝑒𝑑 𝑏𝑦 𝑡ℎ𝑒 𝑊𝑜𝑟𝑙𝑑 𝑀𝑒𝑡𝑒𝑜𝑟𝑜𝑙𝑜𝑔𝑖𝑐𝑎𝑙 𝑂𝑟𝑔𝑎𝑛𝑖𝑧𝑎𝑡𝑖𝑜𝑛).”
🔗https://t.co/cPq0Hx2iRr
Prior to the mid-1940s, TCs were rated according to this strict definition. Wind speeds were measured by an anemometer placed 10 meters above the ground at an unobstructed point. So, when a TS and HU made landfall or passed by a ship, the wind speed and gusts measured in-situ were used to rate its overall intensity at that point, and damage was also used in a similar way that the Enhanced Fujita (EF) scale is used to rate tornadoes.
That is no longer the case.
Beginning in the 1940s, aircraft began flying into TC eyewalls to gather wind speed, temperature, pressure and humidity data to give meteorologists a true picture of storm structure. Since the 1990s, the NOAA National Hurricane Center (NHC) has used the aircraft recon data at flight level (~10,000 feet / 700 hPa) to 𝑒𝑠𝑡𝑖𝑚𝑎𝑡𝑒 the maximum sustained wind speed at 10 meters above the surface by applying a 10% reduction to account for increased friction near the surface (e.g., Franklin et al., 2003).
🔗https://t.co/4D28AFlV3W
The problem with this methodology is that when we get some near-surface wind speed observations as a storm nears landfall (or passes near an island), there seldom are in-situ measurements corroborating the flight-level wind speeds with a 10% reduction, which means that the frictional accelerations at the surface are higher than the NHC estimates it to be. And, it is higher over land than it is over water, and that is not taken into consideration.
During Hurricane Ian in 2022, for example, there were no near-surface wind speed measurements that could corroborate a category four-strength hurricane except for a few gusts (gusts are not wind speed). While the damage from the storm surge was astronomical, there was little, if any significant wind damage. In the 1920s or 1930s, Hurricane Ian would have likely been rated as a high-end category three.
Since the methodology for rating has changed due to the advent of recon data [and later, the 10% reduction formula], TCs are rated stronger today than they were in the past, but that's not a climate-related trend. It is purely an artifact of technological advancement and a few arbitrary decisions.
Case in point, NOAA researchers Dr. Andrew B. Hagen and Dr. Chris Landsea found in their 2012 paper that 80% of category five hurricanes observed with today's technology would have been rated as category four or lower with the available technology in the 1940s and 1950s (pre-satellite era).
🔗https://t.co/dMVi5rtd4l
By looking at the 10 category five Atlantic hurricanes occurring between Andrew (1992) and Felix (2007), only aforementioned Andrew and Mitch (1998) would have been rated as a category five had they occurred in the 1940s and 1950s without satellites. And, based on their tracks, prior to aircraft recon flights, I would go out on a limb to say that only Andrew (1992) would have been rated as a category five given it made landfall as one in a densely populated area. In other words, 90% of category five hurricanes in recent years would have been “missed” or underestimated before the 1940s.
So, the “unprecedented” number of MHs that have reached category five strength in the Atlantic basin in recent years has a heck of a lot to do with improved observational capabilities; it has little or nothing to do with anthropogenic-induced climate change.](https://pbs.twimg.com/media/G42MnhTXEAIgLGK.png)








![ChrisMartzWX's tweet photo. History didn't begin in 1980.
It is true that tropical cyclone (TC) activity (including the frequency of category five major hurricanes) has increased in the Atlantic since the 1980s, but that increase is 𝒂𝒍𝒎𝒐𝒔𝒕 𝒆𝒏𝒕𝒊𝒓𝒆𝒍𝒚 due to Atlantic Multidecadal Variability (AMV), which has been well-documented in the scientific literature if you bothered to read it instead of rehashing talking points you got from WFLA-TV's @WeatherProf or UPenn's Dr. @MichaelEMann.
Atlantic Multidecadal Variability (AMV), also known as the Atlantic Multidecadal Oscillation (AMO), operates on a 65-70-year cycle oscillating between positive (or warm) modes and negative (cool) modes with respect to North Atlantic sea surface temperature (SST) temporal variability (Schlesinger & Ramankutty, 1994). Positive modes correspond to high TC activity and negative modes correspond conversely to low activity.
🔗https://t.co/6MreWQteVo
The AMV / AMO has been in its positive phase since 1995, and that is when Atlantic TC activity suddenly increased. It is likely that the Atlantic Meridional Mode (AMM), which operates on interannual and decadal time scales, is linked to this multidecadal variability since, it too, has predominantly been in its positive phase since the mid-1990s.
🔗https://t.co/mrxtUKgwa1
Positive modes of AMV /AMO and AMM correspond to higher-than-average tropical North Atlantic SSTs and reduced vertical wind shear (i.e., the change in wind speed and/or direction with increasing height). On the other hand, negative modes correspond to lower SSTs and high vertical shear. You can see this in the image I attached on the left, which is adapted from Vimont & Kossin (2007).
🔗https://t.co/x76ptmOjDE
The effect of AMV on Atlantic TC activity has been explored in a number of studies, such as Goldenberg et al. (2001); Klotzbach & Gray (2008); Zhang et al. (2019); and Li et al. (2022).
🔗https://t.co/NIhhOmUWEc / open-access here: https://t.co/kG26v6L3Cn
🔗https://t.co/2BPv0PaEqC
🔗https://t.co/3Ia4BdCSyU
🔗https://t.co/6GDOzcoc6V
Thus, the increase in Atlantic TC activity since 1980 (but, really after 1995) is mostly an artifact of AMV, not the gradual creep upward in ocean temperature caused by global warming.
What about the “unprecedented” number of category five hurricanes in recent years? 🤔
Well, that statistic is true if you take the raw numbers at face value. But it is irresponsible to do that. 🙅♂️
Prior to 1966, there were no operational weather satellites in low-earth orbit allowing meteorologists to monitor TCs out over the open ocean. So, unless a tropical storm (TS), hurricane (HU) or major hurricane (MH) made landfall on a densely populated coastline or passed by a ship, it is impossible to know exactly how many storms there were back then. 🛰️
Only in 1966, with the launch of NASA's Environmental Science Services Administration (ESSA) Satellites, ESSA-1 and ESSA-2, that visible imagery was achieved so that TCs could be continuously tracked from space.
🔗https://t.co/Yixt9XhpS7
And, only since the 1980s has satellite coverage been good at a global scale. Since the early-to-mid-1990s the technology (e.g., microwave sounding units) finally became good enough for meteorologists to get a good picture of storm structure and intensity, especially out over open water far removed from land, in the absence of dropsonde data from aircraft reconnaissance missions.
Prior to the 1980s, TS, HU and MH counts are likely underestimated and that range of uncertainty widens significantly the further back in time we go. As such, for a fair apples to oranges comparison, we must estimate the number of “missing” storms and correct for that in the raw data. This was first done in Vecchi & Knutson (2008) and updated in Vecchi et al. (2021) to include MHs.
🔗https://t.co/Evrg8lsl5R
🔗https://t.co/YrzF0SNPwx
In the image on the top right, I attached Fig. 2 from Vecchi et al. (2021). The red line shows the estimated number of “missed” HUs (left panel) and MHs (right panel) per year between 1851 and 2019 (study period). The red shading shows the uncertainty in those estimates. The blue line shows the total number of HUs (left panel) and MHs (right panel) over that same time interval with the blue shading representing the uncertainty. The top two panels show annual counts while the bottom two panels smooth those out into 15-year centered averages.
As can be seen from the smoothed plots, there is no century-scale upward trend in either HUs or MHs in the Atlantic once the data is homogenized to correct for “missing” storms. The increase since the 1970s is a recovery from a deep minimum in TC activity from the 1970s to the early 1990s. And, of course, a sinusoidal pattern oscillating between high TC activity (e.g., the late 19th century, mid-20th century and 1990s-present) and comparatively low activity (e.g., the early and late 20th century) is exhibited.
One more thing that needs to be considered here is that the way in which TC intensities are assigned has changed in recent decades, and these changes have not been accounted for when doing climate analyses spanning more than 50 years.
TCs are rated according to the Saffir-Simpson wind scale, which assigns storms a category based on maximum sustained wind speed of the storm and the damage incurred by it if it made landfall. Maximum sustained wind speed is defined as,
🗨️ “[𝑇]ℎ𝑒 ℎ𝑖𝑔ℎ𝑒𝑠𝑡 𝑎𝑣𝑒𝑟𝑎𝑔𝑒 𝑤𝑖𝑛𝑑 𝑠𝑝𝑒𝑒𝑑 𝑚𝑒𝑎𝑠𝑢𝑟𝑒𝑑 𝑎𝑡 𝑎𝑛 𝑢𝑛𝑜𝑏𝑠𝑡𝑟𝑢𝑐𝑡𝑒𝑑 𝑝𝑜𝑖𝑛𝑡 𝑎𝑛𝑑 𝑡𝑖𝑚𝑒 𝑎𝑡 10-𝑚 𝑎𝑙𝑡𝑖𝑡𝑢����𝑒 𝑑𝑢𝑟𝑖𝑛𝑔 𝑒𝑖𝑡ℎ𝑒𝑟 𝑎 1-𝑚𝑖𝑛 𝑡𝑖𝑚𝑒 𝑠𝑝𝑎𝑛 (𝑎𝑠 𝑑𝑒𝑓𝑖𝑛𝑒𝑑 𝑏𝑦 𝑡ℎ𝑒 𝑈𝑛𝑖𝑡𝑒𝑑 𝑆𝑡𝑎𝑡𝑒𝑠 𝑁𝑎𝑡𝑖𝑜𝑛𝑎𝑙 𝑊𝑒𝑎𝑡ℎ𝑒𝑟 𝑆𝑒𝑟𝑣𝑖𝑐𝑒 𝑎𝑛𝑑 𝑡ℎ𝑒 𝐽𝑜𝑖𝑛𝑡 𝑇𝑦𝑝ℎ𝑜𝑜𝑛 𝑊𝑎𝑟𝑛𝑖𝑛𝑔 𝐶𝑒𝑛𝑡𝑒𝑟) 𝑜𝑟 𝑎 10-𝑚𝑖𝑛 𝑡𝑖𝑚𝑒 𝑠𝑝𝑎𝑛 (𝑎𝑠 𝑑𝑒𝑓𝑖𝑛𝑒𝑑 𝑏𝑦 𝑡ℎ𝑒 𝑊𝑜𝑟𝑙𝑑 𝑀𝑒𝑡𝑒𝑜𝑟𝑜𝑙𝑜𝑔𝑖𝑐𝑎𝑙 𝑂𝑟𝑔𝑎𝑛𝑖𝑧𝑎𝑡𝑖𝑜𝑛).”
🔗https://t.co/cPq0Hx2iRr
Prior to the mid-1940s, TCs were rated according to this strict definition. Wind speeds were measured by an anemometer placed 10 meters above the ground at an unobstructed point. So, when a TS and HU made landfall or passed by a ship, the wind speed and gusts measured in-situ were used to rate its overall intensity at that point, and damage was also used in a similar way that the Enhanced Fujita (EF) scale is used to rate tornadoes.
That is no longer the case.
Beginning in the 1940s, aircraft began flying into TC eyewalls to gather wind speed, temperature, pressure and humidity data to give meteorologists a true picture of storm structure. Since the 1990s, the NOAA National Hurricane Center (NHC) has used the aircraft recon data at flight level (~10,000 feet / 700 hPa) to 𝑒𝑠𝑡𝑖𝑚𝑎𝑡𝑒 the maximum sustained wind speed at 10 meters above the surface by applying a 10% reduction to account for increased friction near the surface (e.g., Franklin et al., 2003).
🔗https://t.co/4D28AFlV3W
The problem with this methodology is that when we get some near-surface wind speed observations as a storm nears landfall (or passes near an island), there seldom are in-situ measurements corroborating the flight-level wind speeds with a 10% reduction, which means that the frictional accelerations at the surface are higher than the NHC estimates it to be. And, it is higher over land than it is over water, and that is not taken into consideration.
During Hurricane Ian in 2022, for example, there were no near-surface wind speed measurements that could corroborate a category four-strength hurricane except for a few gusts (gusts are not wind speed). While the damage from the storm surge was astronomical, there was little, if any significant wind damage. In the 1920s or 1930s, Hurricane Ian would have likely been rated as a high-end category three.
Since the methodology for rating has changed due to the advent of recon data [and later, the 10% reduction formula], TCs are rated stronger today than they were in the past, but that's not a climate-related trend. It is purely an artifact of technological advancement and a few arbitrary decisions.
Case in point, NOAA researchers Dr. Andrew B. Hagen and Dr. Chris Landsea found in their 2012 paper that 80% of category five hurricanes observed with today's technology would have been rated as category four or lower with the available technology in the 1940s and 1950s (pre-satellite era).
🔗https://t.co/dMVi5rtd4l
By looking at the 10 category five Atlantic hurricanes occurring between Andrew (1992) and Felix (2007), only aforementioned Andrew and Mitch (1998) would have been rated as a category five had they occurred in the 1940s and 1950s without satellites. And, based on their tracks, prior to aircraft recon flights, I would go out on a limb to say that only Andrew (1992) would have been rated as a category five given it made landfall as one in a densely populated area. In other words, 90% of category five hurricanes in recent years would have been “missed” or underestimated before the 1940s.
So, the “unprecedented” number of MHs that have reached category five strength in the Atlantic basin in recent years has a heck of a lot to do with improved observational capabilities; it has little or nothing to do with anthropogenic-induced climate change.](https://pbs.twimg.com/media/G42cxZhXcAA5krZ.png)





![robinmonotti's tweet photo. JOHN CLAUSER, 2022 PHYSICS NOBEL PRIZE WINNER:
"I can very confidently assert, there is no climate emergency.
As much as it may upset many people, my message is the planet is NOT in peril.
Atmospheric CO2 and methane have negligible effect on the climate.
The policies government have been implementing are totally unnecessary and should be eliminated.
So far, [we] have totally misidentified what is the dominant process in controlling the climate, and all of the various models are based on incomplete and incorrect physics.
The dominant process, is “the cloud-sunlight-reflexivity thermostat mechanism.
Clouds are all bright white, and they reflected 90% of the sunlight back into space making them the most crucial yet most overlooked aspect of the climate system.
Two-thirds of the Earth are ocean. The Pacific Ocean alone is half the Earth. The average cloud cover for the Earth is 67%; about 50% over land and 75% over oceans.
I claim that the above conspicuous properties of clouds are the missing part of the puzzle."](https://pbs.twimg.com/media/G5Up06oboAAe-av.jpg)