$SLB
$SLB is about to test its 200 EMA this week.
The Adam and Eve pattern is still intact as long as we don't lose support of the Eve pattern, the rounded floor that has been holding the second low together.
As long as Eve support holds, one to watch.
You can know the pattern and still not know when to act on it. Our daily videos and trade alerts at https://t.co/DPsk9vzJGc walk through the confirmation, the invalidation, and the plan.
$TDW $WTTR $WFRD $CHX $PUMP $CLB $XLE $OIH $IEZ $XOM $CVX $COP $OXY $SLCA #ENERGY
https://t.co/N0Iu1aMEN2
🚨 خارطة الفضة حتي عام2030 قد تجعلك مليونير!
قاع رئيسي عند سعر 50$ - 40$ ثم نصعد في موجة خماسية حتي سعر 500$ ثم حدوث تصحيح
في هذا التصحيح اتوقع نصنع قاع عند 250$ ومن هناك صعود رالي لنتخطي ال1,100 لأونصة الفضة الواحدة
وقتها اونصة الذهب هتتداول عند قرابه 18,000$ #xag
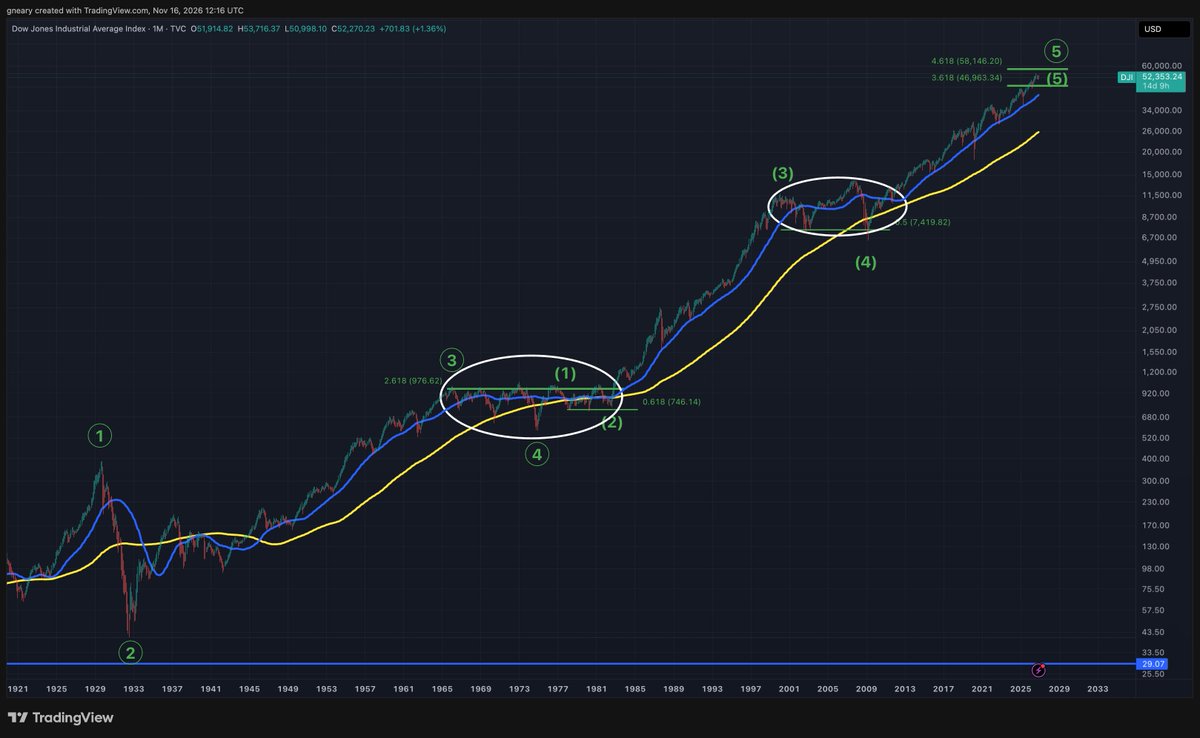
$DJI we have not had any sustained difficulty since 2007 - 2009
We have had it VERY easy since then
We have had flash crashes that have recovered in record breaking time, some only lasting a few weeks.
That is not how history tells us the market behaves in a crash or correction.
What is very clear is that we are due something seismic and it is still very early to say that we are in it now
A number of sectors have crashed hard but the overall market has been resilient but it will have its turn too, as it always has.
This is a lesson for everyone in the future to always be prepared because the market is the great humbler.
$DXY – not buying this breakout just yet.
Hawkish Fed expectations offer some support, but sharply falling oil challenges the higher-for-longer narrative.
At major multi-year resistance, a short-term macro repricing isn't enough to confirm this to be a structural breakout.
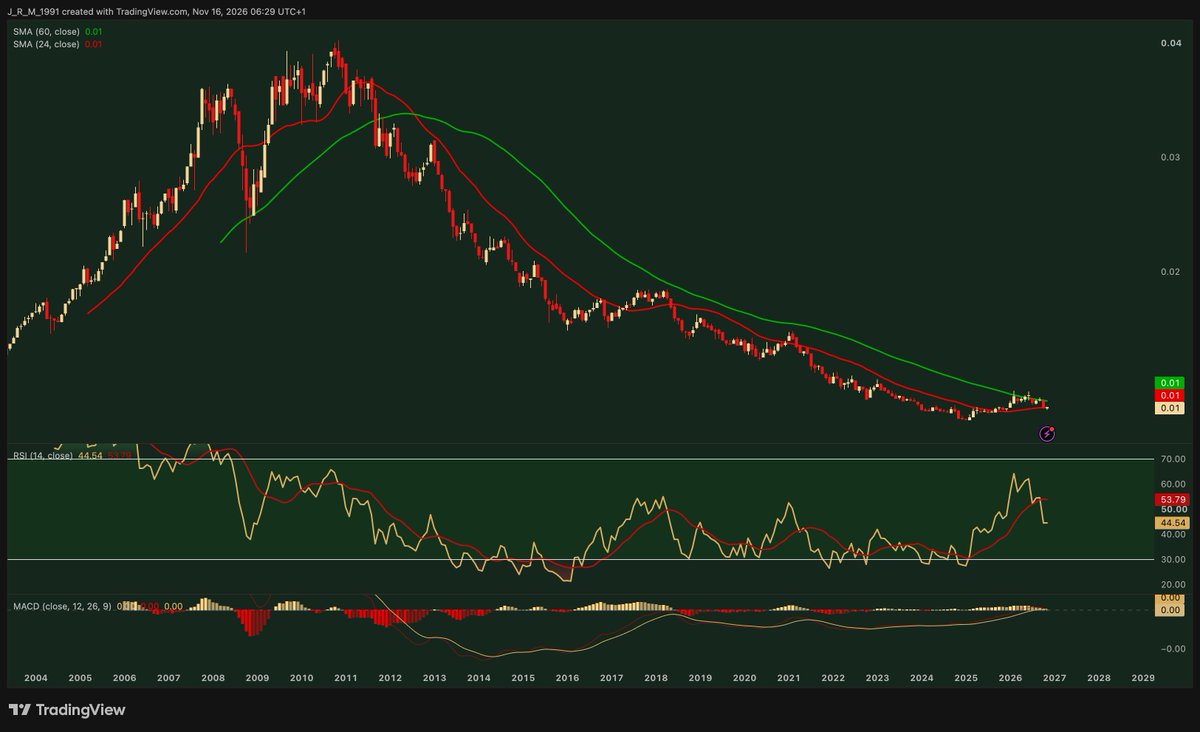
EMERGING VS DEVELOPED MARKETS - STILL EARLY?
After a first meaningful leg up, the EM-to-DM ratio has failed to break its 5-year moving average, and is now back on the 2-year one.
This tells me the following:
1) EMs are still early, based on the ratio's absolute level (75% below its prior peak).
2) The recent correction and failure to break this key level isn't surprising, as strong legs up are normally followed by such breaths.
3) Seeing the ratio holding on its 2-year MA would be a positive signal likely preceding another leg up (new breakout attempt).
So, while the EM trade still seems early, investors should keep in mind that this is a long-term one, meaning that such corrections/breath, could last for several months.
Patience is therefore key here.
$EEM $VOO $EWZ
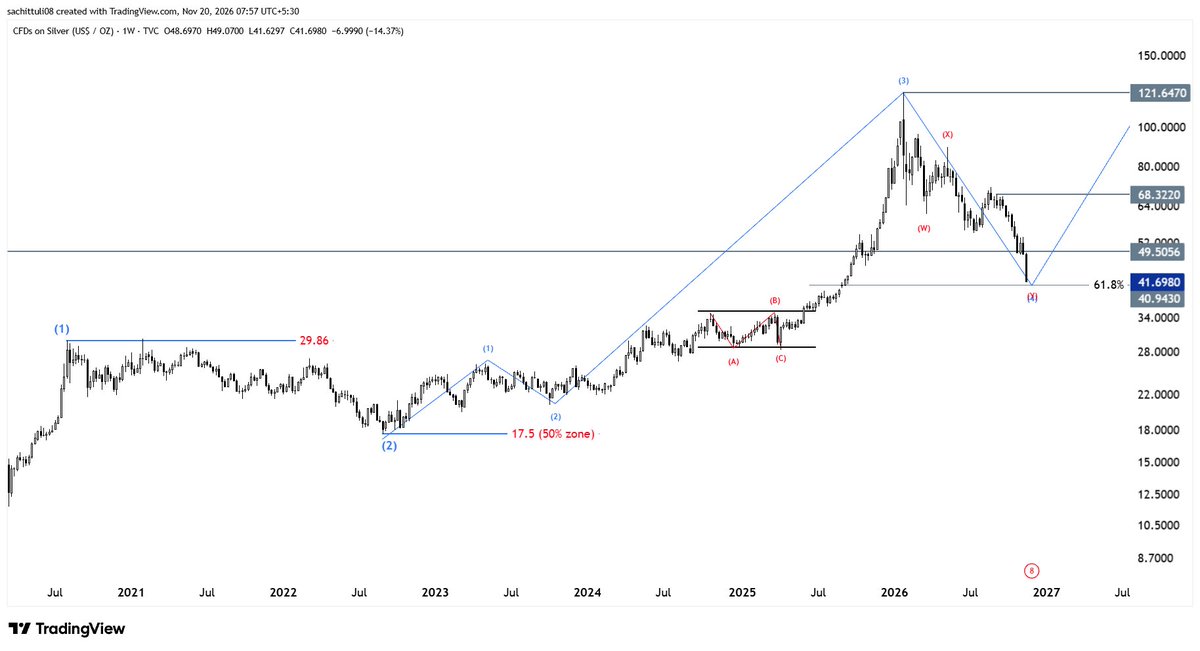
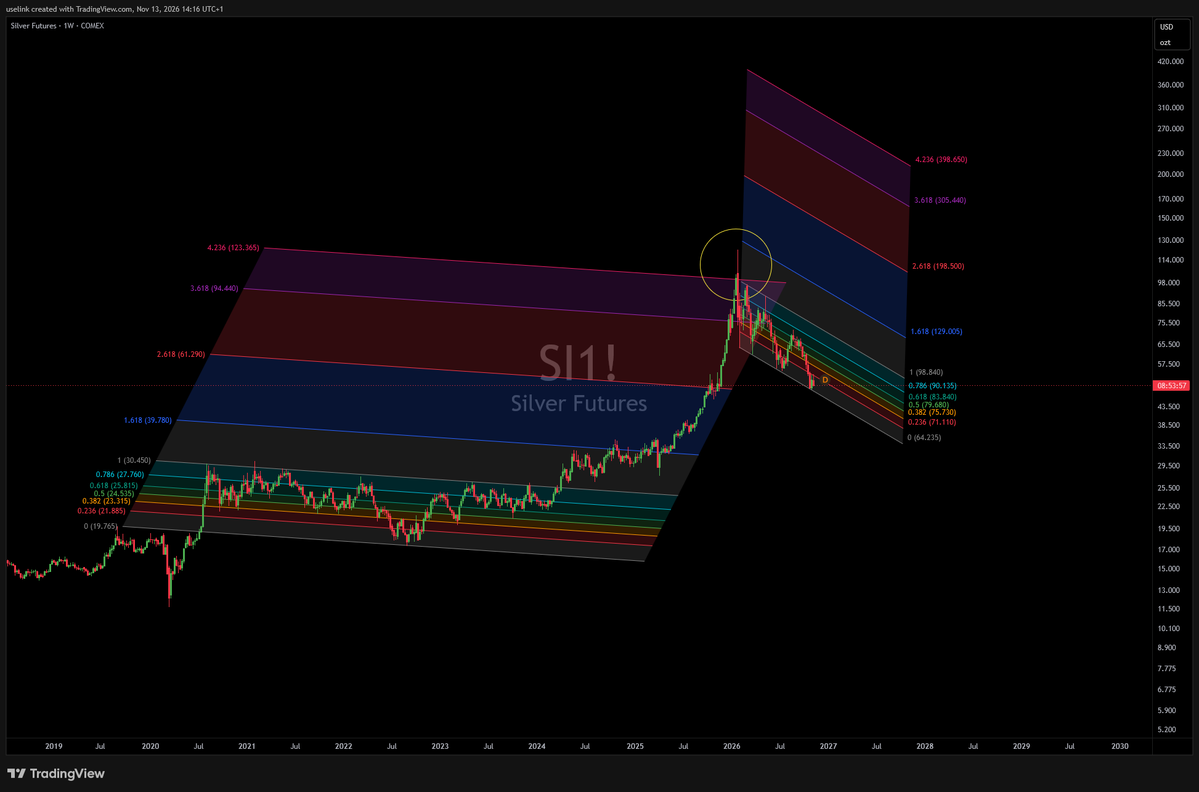
$XAGUSD
the rsi was overheated in Jan 2026 and now went to oversold in nearly 1 year to complete.
There are confluence of support present now and retracement has reached 50%.
RSI now again need to go towards overheated range and 5th wave need to complete with divergence.. which will complete the overall 3rd major.....
OIL SERVICES VS OIL PRODUCERS
Oil services have become very cheap relative to oil producers, as the IEZ-to-XLE ratio shows.
Given their cheapness, and the growing concerns about energy security, the priority in the coming year is most likely gonna switch getting the cheapest energy sources possible to ensure a secure energy supply.
In this context, oil services could be the biggest winner of a race for the closest and most secure energy sources.
#OOTT
Silver
Not calling a low, but would advise that we are likely close. The price itself is now near an area where multiple support lines converge (arc and downward pointing wedge).
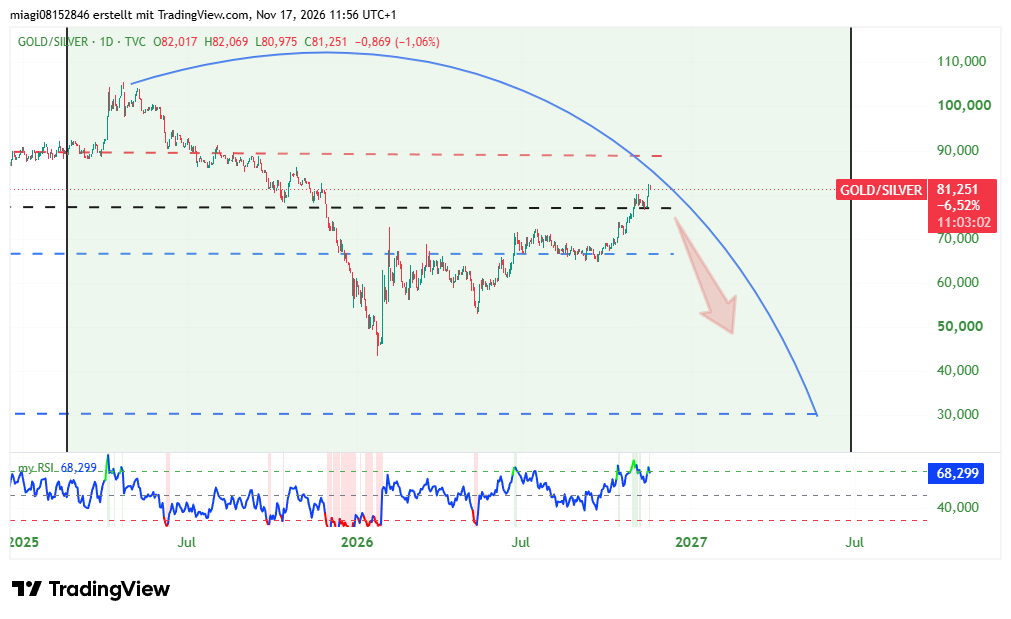
The Silver to Stocks ratio is now near support, whilst the Gold to Silver ratio is near resistance.
$XOP
Member Request
Members can request charts and get them charted anytime. Become a member at https://t.co/piEjMamo61.
On Tuesday $XOP put in a bullish engulfing candle, a green body that fully covers the prior red candle, at the 200 EMA.
Yesterday we got confirmation follow through, giving us a pivot here, a close above the signal candle's high, as we bounce off the 200 EMA.
Ascending support holds. The risk reward profile was clear here for anyone who took the bounce.
We remain in a solid uptrend, with higher lows, and nothing bearish about this chart. Pullbacks continue to be seen as buying opportunities.
As long as higher lows and the 200 EMA continue to hold, bulls remain in control.
Come check us out on Discord and start your free trial, see what we're all about firsthand: https://t.co/9J76VmgpA7
#OIL #CRUDEOIL #ENERGY $USO $XLE $XOM $CVX $COP $OXY $EOG $DVN $FANG $APA $SU $CNQ $CVE $SLB $BNO
Historically, the #GSR (#Gold:#Silver Ratio) has averaged between 40:1 and 60:1 in the modern era. When the ratio expands far beyond that average, it tends to eventually snap back to that mean, often very quickly. Currently at 78:1.
More recently, the GSR fell from around 107:1 in Apr 2025 to about 43:1 around silver’s $122 January 2026 ATH peak. Since then, the GSR ratio has been generally range-bound between 60:1 and 70:1 since June 2026. That’s just above the high end of the modern average. However, the ratio has started widening again. This could signal that Silver is setting up to resume its bull run. However, plenty of Silver headwinds continue:
1. Fed Rate hikes.
2. Lower Silver bullion coin sales circa 116m oz in 2021 to estimated 55m oz in 2026. Lower demand from India.
3. Rapid investor sell off in Silver since Jan 2026.
4. LittleSis is an Industrial commodity (circa 66%) and does not enjoy the same quasi-monetary attributes as BigBro Gold.
Against this, Silver has been in a structural market deficit for 5 years, meaning demand has outstripped mining and recycling output. Last year, demand outstripped supply by 40.2 million oz. That drove the 5 year market deficit to 716 million oz. For perspective, total Silver mining output last year was 846 million oz.
With demand under pressure, Metals Focus expects the market deficit to ease further this year and flip to a surplus in 2027. This reduces the likelihood of another squeeze. However, once markets scale back expectations of aggressive monetary tightening in 2027, Silver could start to outperform, as renewed upward price momentum encourages investors to rebuild their exposure - silver following BigBro Gold up, and the GSR down.
Gold vs. Stocks may be entering a regime change.
The $Gold / $SPX ratio has spent decades below a secular resistance line that connects the 1980 and 2011 peaks.
Now, for the first time in years, the ratio is pressing against it again.
A breakout could mark the beginning of a major capital shift toward hard assets.
If this resistance breaks, are your portfolios prepared for that kind of shift?