@rab9604 Amit Bhartia, the best thinker I have seen in decades, and I co-author this piece, inverting the entire chest beating over the impending collapse of our fertility rate, hence, demo dividend.
We argue that Demographic Buyback is the RIGHT way to look at TFR collapse, and that's how we will reach Middle Income in 75 years. There is no other way.
We hit ~$50,000 National EPS by 2100... that's $50k per Capita GDP.
We narrow the gap with US and China. We probably turn in a fiscal surplus.
Read it. It's all there.
A Demographic Buyback increases the nation's EPS, and economy's Free Cash Flow, as we postulate.
So, far from a death sentence, a population collapse is the solution: just like it is for China & others.
Point is Not whether the forecast is right or not.
Point is: only countries with declining populations will prosper in the coming decades. This is beyond debate.
Read. Reflect. Rotate and Share.
Final note: anybody using this concept will need to attribute to us. Otherwise I shall shame them with the call " Gali Gali mien shor hai, £¢¥~ Idea Chor hai".
Extremely industrial, 19th&20th century, era thinking in the article by Ms. Nilekani.
The countries that will win big time,in the next 50-70 years, will be countries with declining populations, and increasing AI + Robotics adoption.
Separately, a point missed in my and Amit Bhartia 's @rab9604 's piece , by folks is: why is the US population projected to be flat, while everyone else declines?
Answer: Simple: America remains THE country people want to emigrate to to.
This will continue enabling US to choosing who it wants and in what proportion: age, skills, ethnicity.
Like multiple taps that it can keep switching on/ off at will.
This will keep its population flat BUT with the right balance, and massive productivity increases.
America will continue to dominate the world almost forever.
I don't at all buy " The Empire is on its last legs" theory.
It's not perfect, but it's still and will remain the Heavyweight champion of the world
In the 1920s, a Stanford psychologist tracked genius children for 50 years.
Malcolm Gladwell breaks down what he discovered:
Rich families → successful. Poor families → failures.
Not average. Failures. Genius-level IQs that produced nothing.
He spent 60 minutes at Microsoft explaining why we're wrong about success:
The psychologist was named Terman. He gave IQ tests to 250,000 California schoolchildren.
He identified the top 0.1%. Kids with IQs of 140 and above.
His hypothesis: these children would become the leaders of academia, industry, and politics.
He tracked them. And tracked them. For decades.
The results split into three groups:
The top 15% achieved real prominence. The middle group had average, moderately successful professional lives.
And the bottom group? By any measure, failures.
The difference wasn't personality. Wasn't habits. Wasn't work ethic.
It was simple: the successful geniuses came from wealthy households. The failures came from poor families.
Poverty is such a powerful constraint that it can reduce a one-in-a-billion brain to a lifetime of worse than mediocrity.
There's a concept called "capitalization rate."
It asks a simple question: what percentage of people who are capable of doing something actually end up doing that thing?
In inner city Memphis, only 1 in 6 kids with athletic scholarships actually go to college.
If our capitalization rate for sports in the inner city is 16%, imagine how low it must be for everything else.
Here's something stranger.
Gladwell read the birth dates of the 2007 Czech Junior Hockey Team:
January 3rd. January 3rd. January 12th. February 8th. February 10th. February 17th. February 20th. February 24th. March 5th. March 10th. March 26th...
11 of the 20 players were born in January, February, or March.
This isn't unique to the Czechs. Every elite hockey team in the world shows the same pattern. Every elite soccer team too.
Why?
The eligibility cutoff for youth leagues is January 1st.
When you're 10 years old, a kid born in January has 10 months of maturity on a kid born in October. That's 3 or 4 inches of height. The difference between clumsy and coordinated.
So we look at a group of 10 year olds, pick the "best" ones, give them special coaching, extra practice, more games.
We think we're identifying talent. We're just identifying the oldest.
Then we give the oldest more opportunities, and 10 years later they really are the best.
Self-fulfilling prophecy.
The capitalization rate for hockey talent born in the second half of the year? Close to zero.
We're leaving half of all potential hockey players on the table because of an arbitrary date on a calendar.
Kids born in the youngest cohort of their school class are 11% less likely to go to college.
11% of human potential squandered because we organize elementary school without reference to biological maturity.
Now here's the part about math.
Asian kids dramatically outperform Western kids in mathematics. The gap is enormous and consistent across decades of testing.
Some people say it's genetic. It's not.
It's attitudinal.
When Asian kids face a math problem, they believe effort will solve it.
When Western kids face a math problem, they believe the answer depends on innate ability they either have or don't.
Here's the proof.
The international math tests include a 120-question survey. It asks about study habits, parental support, attitudes.
It's so long most kids don't finish it.
A researcher named Erling Boe decided to rank countries by what percentage of survey questions their kids completed.
Then he compared it to the ranking of countries by math performance.
The correlation was 0.98.
In the history of social science, there has never been a correlation that high.
If you want to know how good a country is at math, you don't need to ask any math questions. Just make kids sit down and focus on a task for an extended period of time.
If they can do it, they're good at math.
Why do Asian cultures have this attitude?
Gladwell's theory: rice farming.
His European ancestors in medieval England worked about 1,000 hours a year. Dawn to noon, five days a week. Winters off. Lots of holidays.
A peasant in South China or Japan in the same period worked 3,000 hours a year.
Rice farming isn't just harder than wheat farming. It's a completely different relationship with work.
There's a Chinese proverb: "A man who works dawn to dusk 360 days a year will not go hungry."
His English ancestors would have said: "A man who works 175 days a year, dawn to 11, may or may not be hungry."
If your culture does that for a thousand years, it becomes part of your makeup.
When your kids sit down to face a calculus problem, that legacy of persistence translates perfectly.
Now consider distance running.
In Kenya, there are roughly a million schoolboys between 10 and 17 running 10 to 12 miles a day.
In the United States, that number is probably 5,000.
Our capitalization rate for distance running is less than 1%.
Kenya's is probably 95%.
The difference isn't genetic. The difference is what the culture values and where it spends its attention.
Here's the most fascinating finding.
30% of American entrepreneurs have been diagnosed with a profound learning disability.
Richard Branson is dyslexic. Charles Schwab is dyslexic. John Chambers can barely read his own email.
This isn't coincidence. Their entrepreneurialism is a direct function of their disability.
How do you succeed if you can't read or write from early childhood?
You learn to delegate. You become a great oral communicator. You become a problem solver because your entire life is one big problem. You learn to lead.
80% of dyslexic entrepreneurs were captain of a high school sports team. Versus 30% of non-dyslexic entrepreneurs.
By the time they enter the real world, they've spent their whole life practicing the four skills at the core of entrepreneurial success: delegation, oral communication, problem solving, and leadership.
Ask them what role dyslexia played in their success and they don't say it was an obstacle.
They say it's the reason they succeeded.
A disadvantage that became an advantage.
Here's what Gladwell wants you to understand:
When we see differences in success, our default explanation is differences in ability.
We forget how much poverty, stupidity, and attitude constrain what people can become.
We refuse to admit that our own arbitrary rules are leaving talent on the table.
We cling to naive beliefs that our meritocracies are fair.
The capitalization argument is liberating.
It says you don't look at a struggling group and conclude they're incapable. It says problems that look genetic or innate are often just failures of exploitation.
It says we can make a profound difference in how well people turn out.
If we choose to pay attention.
A toothpaste company has quietly killed the entire market research industry and nobody is talking about it.
Colgate published a paper showing you can predict real purchase intent at 90% accuracy by simply asking LLMs to roleplay customers.
And this is beyond insane.
If you ask an AI, "Rate this product from 1 to 5," it gives safe, middle-of-the-road garbage.
So researchers invented a method called Semantic Similarity Rating (SSR).
Instead of asking the AI for a number, they asked it to roleplay.
They gave the LLM a demographic profile. They showed it a product concept. And they asked it to write down its raw, unfiltered thoughts.
Then, they used a semantic model to translate those written thoughts into a numerical score.
The results are staggering.
Tested against 57 real corporate surveys and 9,300 actual human responses, the synthetic AI consumers matched real human buying behavior with 90% reliability.
They perfectly mirrored how different age brackets and income levels react to price changes.
And they provided detailed, qualitative feedback that was deeper and more critical than what actual humans wrote.
This destroys the economics of traditional market research.
You don't need to wait a month to see if a product will sell.
You can simulate 1,000 hyper-targeted customer interviews overnight.
You can A/B test pricing across every demographic instantly.
A freelance journalist who had never taken a statistics course wrote a 142-page book in 1954 that professional statisticians still hand to students before anything else, because nobody before him had bothered to explain the tricks in plain language.
His name was Darrell Huff. The book is called How to Lie with Statistics.
I read it in one sitting and spent the next three days noticing the tricks everywhere.
Over 1.5 million copies have sold in English alone. It became a standard college textbook in the 1960s and 70s. Seventy years later it is still in print, still assigned, still the first thing a working statistician reaches for when they want to teach someone to think clearly about numbers.
The man who wrote it was not a researcher. He was a freelancer who wrote how-to articles for magazines. He had no PhD, no academic post, no institutional affiliation. He just understood that numbers could lie without technically being wrong, and he thought someone should explain how.
His opening line sets the whole tone of the book.
"The crooks already know these tricks; honest men must learn them in self-defense."
That one sentence is the entire argument. The manipulation is not coming. It already happened. It happened this morning in the article you read and the chart someone showed you at work and the study your doctor quoted. The only question is whether you know what to look for.
Huff called the first trick the Well-Chosen Average.
When someone tells you the average salary at a company is $80,000, they have told you almost nothing. If the CEO earns $2 million and the 20 employees earn $30,000 each, the mean is $80,000. The median is $30,000. Both are technically correct. One is a lie. The person reporting the number chose which average to use, and they almost always chose the one that served their argument. Huff's rule: whenever you see an average with no description of which average it is, ask.
The second trick he named the Gee-Whiz Graph.
A line chart shows company profits rising. The line shoots nearly vertical, almost doubling in height across the chart. You feel impressed. Then you look at the y-axis and notice the chart does not start at zero. It starts at 94. The actual increase in profits was 3 percent. The dramatic visual was produced entirely by cropping the bottom of the chart. Nothing in the data changed. The picture changed everything.
Every news organization on earth still does this every day.
The third trick is the one that should change how you read every study you ever encounter. Huff called it Post Hoc Rides Again, which is short for the Latin phrase post hoc ergo propter hoc. After this, therefore because of this.
Cities with more churches have more violent crime. Therefore churches cause violence. The logic is airtight. The conclusion is absurd. Both church attendance and crime go up as population grows. The two numbers track each other because a third variable drives both. The correlation is real. The cause is invented.
Huff showed that this structure is not a rare mistake. It is the default pattern of almost every study reported in a newspaper, because causation is a boring word and because proves is a better headline than correlates with.
The fourth trick was the one that floored me. He called it the Semi-Attached Figure.
A headache pill company claims their product is twice as fast as the competition. The study behind the claim is real. The product was tested and the numbers are accurate. What the advertisement does not mention is that the study measured absorption rate into the bloodstream, not relief of headaches. The two things are related but not identical. The statistic is real. It is attached to the wrong conclusion.
Huff said this is the most dangerous trick of all because the number is never fabricated. You cannot fact-check a semi-attached figure by verifying the statistic. You have to ask whether the statistic actually measures what the claim requires it to measure.
Almost nobody asks.
There is one part of Huff's story that most people who recommend the book leave out.
Years after he wrote it, he was hired by the tobacco industry. He worked on a follow-up manuscript called How to Lie with Smoking Statistics, designed to cast doubt on the research connecting cigarettes to cancer. The book was never published. He testified before Congress in an attempt to undermine the statistical evidence against tobacco.
The man who wrote the clearest guide to spotting statistical deception spent the end of his career deploying those same tricks against evidence that was killing people.
That detail does not make the book wrong. The tricks he described are real and the defenses he taught are still the right ones. But it is a reminder that the tools in the book are neutral. Understanding how lies are built does not protect you from choosing to build one.
The crooks already know these tricks.
Some of them wrote the manual.
What is one statistic you have seen recently that you now think deserves a second look?
10 RESEARCH WEBSITES THAT PHDS DO NOT WANT YOU TO FIND.
Bookmark this. Academia is gatekept by paywalls and you should not be paying.
1. https://t.co/w5aGmsEO8t
The largest open library on earth. Almost any textbook your professor assigned is here for free.
2. https://t.co/bgokJYdop3
The search engine for academic papers. Sort by citations to find the most influential research.
3. https://t.co/iF6YXpIhEj
AI powered paper search built by the Allen Institute. Highlights every citation in context.
4. https://t.co/5xwH9lD6tl
Plug in one paper, see every related study mapped as a graph. Reveals what experts actually read together.
5. https://t.co/1pMqKlnIWZ
An AI research assistant. Ask any question and get a structured table of papers with key findings.
6. https://t.co/loNjo3UikE
Aggregates the conclusions of thousands of papers into one answer. Stops cherry picking.
7. https://t.co/zoFxYq3kOi
The Spotify of papers. Recommends new research based on what you have already read.
8. https://t.co/SwdhbpHOQt
Visualizes citation chains. Shows how an idea spread across decades of research.
9. https://t.co/RmAmyVOCV7
Tells you which papers support, contradict, or mention any claim. Saves hours of fact checking.
10. https://t.co/D8H3COvPXj
200 million open access papers in one searchable index. The world's largest free academic archive.
Most students pay $40,000 to access what these sites already make free.
@ogeneral_ng a simple service request on a new AC is not resolved for 3 days. Calling customer service helping is of no use. Helping said request will be assigned to new service center this was not done. Both O General and service center are lying and misguiding @jagograhakjago
Winter is coming for Indian inflation
My Paisanomics column for the Mumbai Mirror.
Read and Share.
On May 14, the government said that for April 2026, the wholesale inflation was 8.3%, implying wholesale prices were 8.3% higher than April 2025: The highest in 42 months.
Indeed, wholesale inflation doesn’t remain confined to factory gates and mandis. Companies and traders will try to pass on at least a part of these higher costs to consumers. And then, the retail inflation that ordinary Indians experience will go up as well.
First, the price of petrol and diesel will be increased further.
Second, a lot of economic activity depends on energy. Factories need electricity and natural gas to produce goods, trucks and ships need fuel to transport them and farms depend on diesel and fertilisers.
So when energy prices go up, the cost of producing and transporting goods rises, pushing up inflation.
Third, packaging costs are up, pushing up milk prices and prices of products of every day use.
Fourth, the depreciation of the rupee will add to inflation. India imported goods worth $775 billion in 2025-26, including crude oil, edible oil, pulses, coal, plastics, ores, minerals and chemicals, iron and steel, etc.
Fifth, higher government borrowing is likely to leave lesser money for others to borrow, pushing up interest rates and EMIs.
Sixth, the toxic mix of economic stagnation and high inflation creates the conditions for stagflation(stagnation plus inflation) – a problem that is rarely easy to fix.
https://t.co/TDaLQbwbJy
Dear Pratap Bhanu Mehta @pbmehta, your piece "In age of uncertainty, patriotism is a poor substitute for statecraft" is a beautifully articulated piece of skepticism.
It is always a privilege to read your prose.
However, a rigorous dissection of your central thesis reveals a fundamental misdiagnosis of India's macroeconomic resilience, strategic maneuvering, and the very nature of modern governance.
Let's begin with your core overarching premise: that the Prime Minister relies on "moralised language" and the "language of sacrifice" to deflect attention from deep-rooted structural and governance problems.
This establishes a conceptually flawed false binary between societal mobilization and statecraft.
In modern behavioral economics, public mobilization is not a substitute for statecraft; it is an indispensable instrument of it.
#PratapBhanuMehta
Rubika: Are you a gold trader? Are you happy with Modi's appeal not to buy gold
Gold trader: *starts crying* Yes, I am happy. Modi is doing it for the country. This sacrifice is for the country.
These kinds of Bhakts are the reason why India will never progress in the future.
"There have always been two Hinduisms. One is plural, local, and decentralised, where each community has its own gods, rituals, and truths. There is no single measure of purity and no dominant authority. The other is Brahminical Hinduism, constructed over centuries, where all jatis are forced into a fourfold varna framework, purity becomes power, and hierarchy is presented as cosmic order. Today, however, many can only see the second. The first has faded from memory".
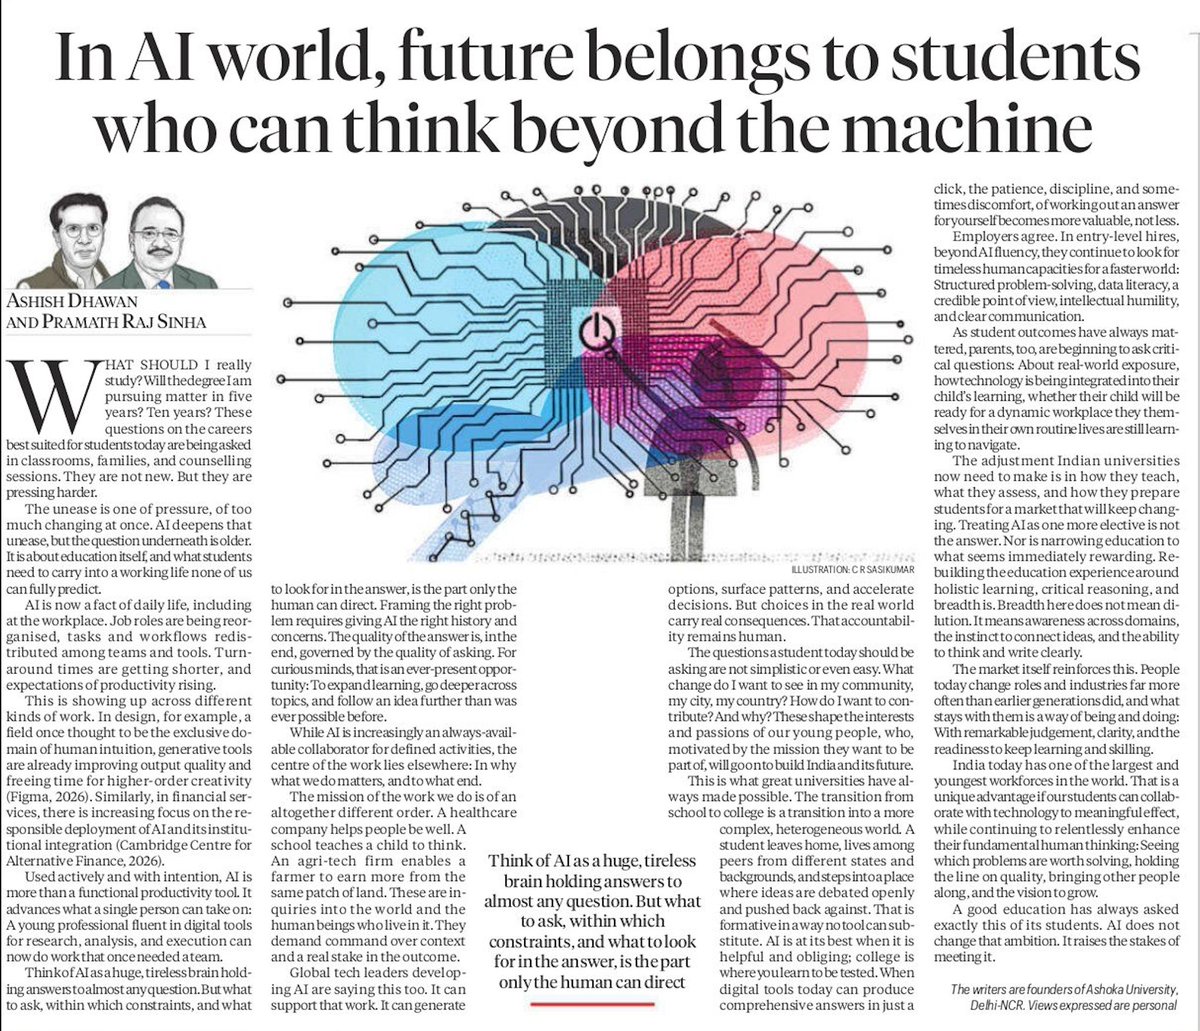
The article rightly defends human judgment in the age of AI.
But it says little about cognitive atrophy, shrinking attention spans, or how education is also about subjectification and socialization, not merely skills and problem-solving.