Today's follower bonus: message me on WhatsApp to request my U.S. stock sector-strength notes, where I break down how I compare leadership across industries. Join today to claim it 👇 📷 https://t.co/tTCG61FfNp
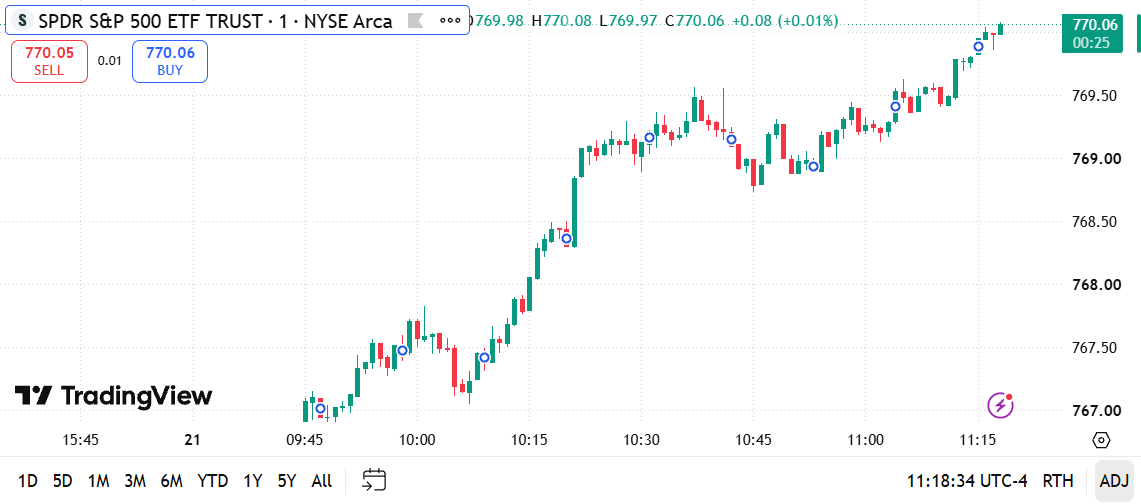
$SPY 1-min chart breakdown 🚀Steady trend day! After holding the $767.00 open base, buyers drove a stair-step rally straight through $770.00 to fresh highs at $770.08•High: $770.08
Support: $769.00 / $767.00 Pure multi-leg momentum. (1/2) 👇#SPY#SPX#FinTwit#DayTrading $QQQ
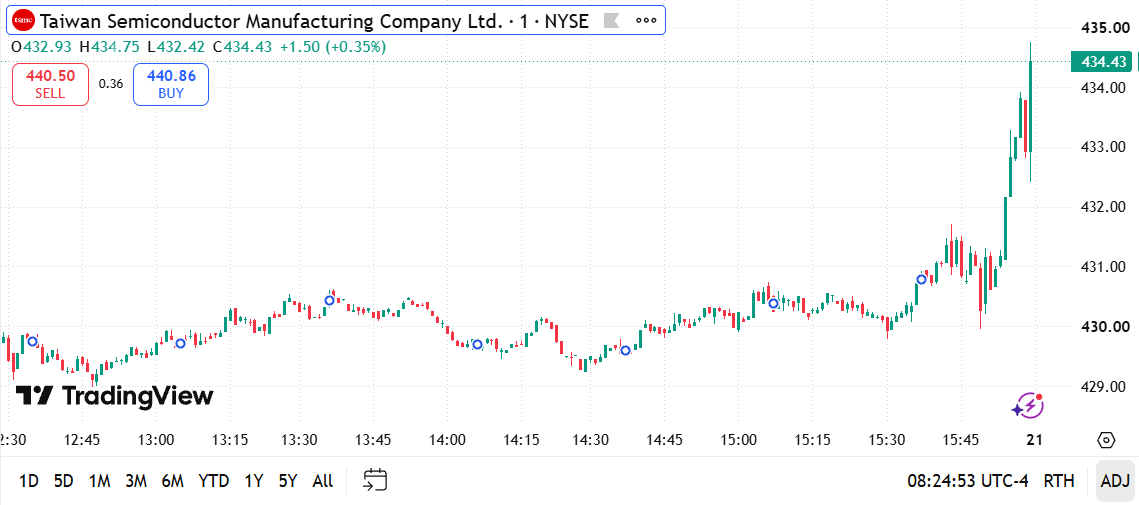
$TSM 1-min chart breakdown
Insane late-day vertical squeeze! After hours of range-bound consolidation near $430, semi giant exploded straight to $434.75 into the close
High: $434.75•Key Support: $431.00 / $429.50
(1/2)👇#TSM#Semiconductors#FinTwit#DayTrading $QQQ
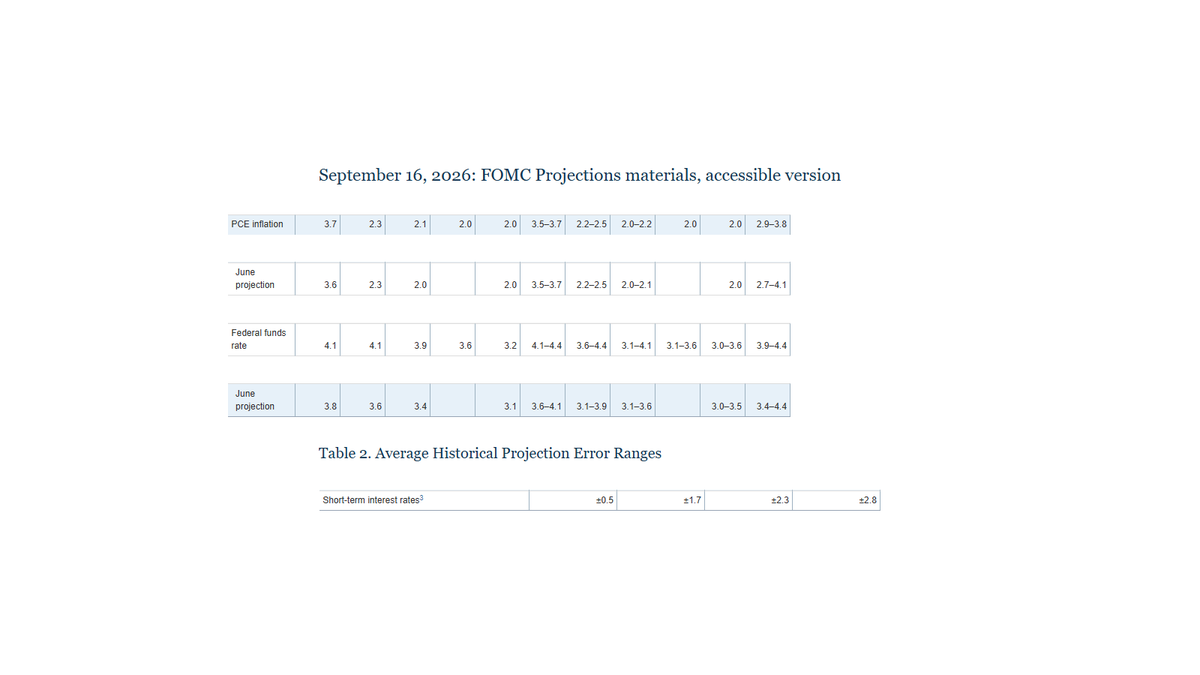
The September FOMC projections became more hawkish without becoming more certain. The median end-2026 policy-rate projection rose to 4.1% from 3.8% in June, while median 2026 PCE inflation edged up to 3.7% from 3.6%.
That does not turn the dot plot into a promise. The Fed's own historical-error table puts the 2026 short-rate error range at ±0.5 percentage point, and participants' paths are conditional on the economy. The useful read is not “4.1% is locked.” It is that officials now see a higher appropriate path while inflation uncertainty remains unusually high.
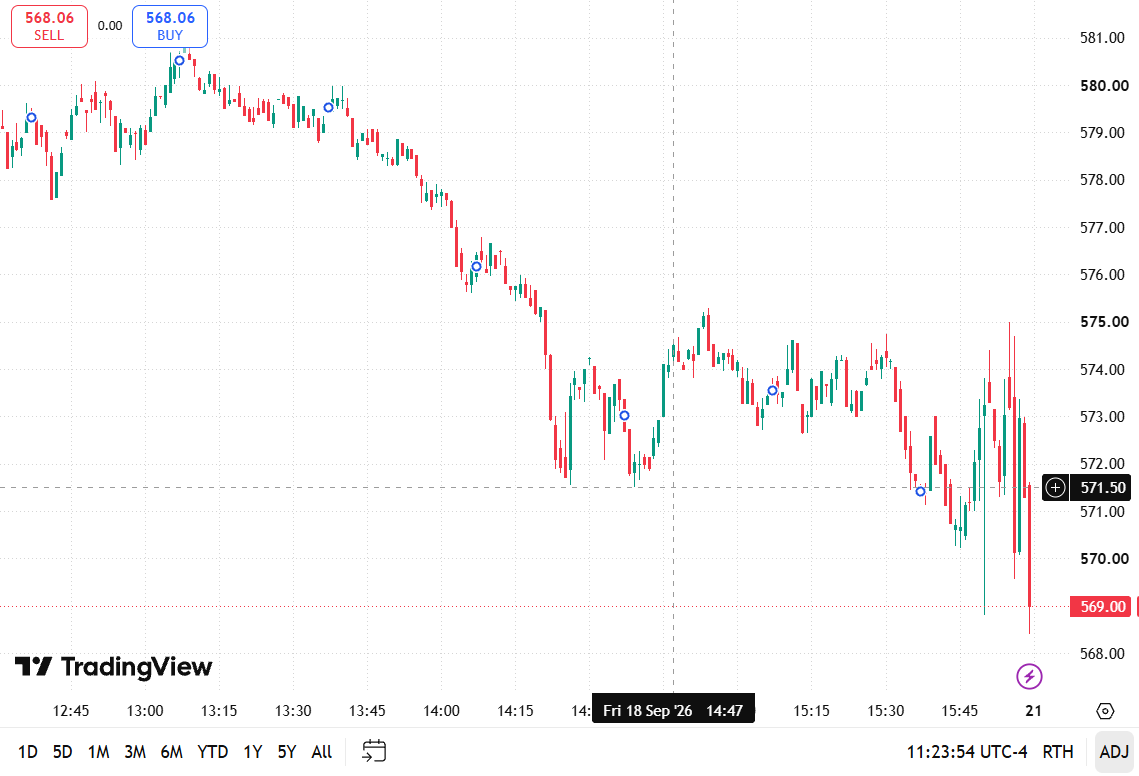
Intraday 1-min chart breakdown 📉📉 Brutal bear pressure throughout the session! After rejecting near $580.00, price entered a steady downtrend before a wild tail-end flush swept liquidity all the way down to $568.00.
(1/2)👇#DayTrading#FinTwit#Trading#PriceAction#USStocks
[2/2] I’m not treating them as one trade. NVDA needs semiconductor follow-through, TSLA needs the auction to hold its gap, and AMZN needs buyers beyond the first print. Prior close is the common reference, not an entry signal. https://t.co/YtNIgNsQDQ
Management attributed the reset mainly to the delayed ramp of a Houston contract-manufacturing facility, while saying demand remains strong. This is an execution reset before it is a demand reset.
https://t.co/kYMZAaB6aG
[2/2] NFLX is absorbing a Wells Fargo downgrade to Underweight and a $57 target, while Alphabet is leading. This is stock selection, not a clean communication-services call. Next check: does NFLX stabilize without dragging XLC lower?https://t.co/QNA2MsZEFo
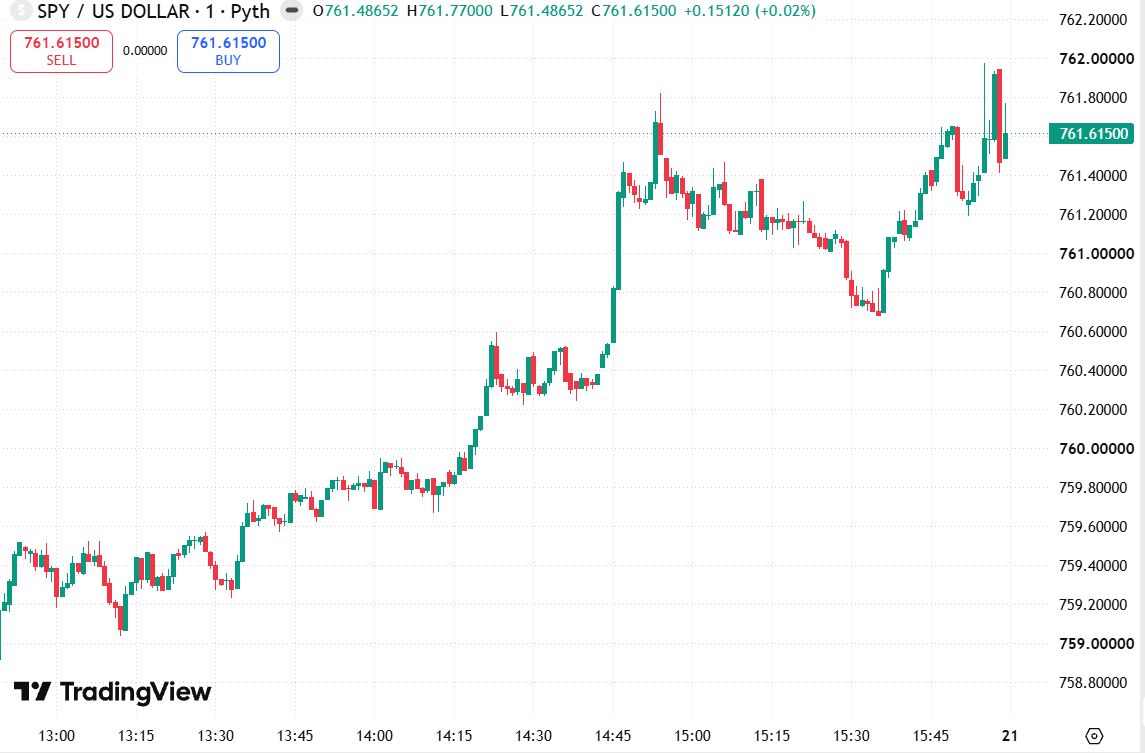
$SPY intraday 1-min chart breakdown 📈 Solid staircase trend higher today. Massive impulse move into the afternoon, followed by a tight consolidation range around $761. • Key Resistance: $762.00 (tested twice)
👇#SPY#SPX#DayTrading#FinTwit#Trading $QQQ
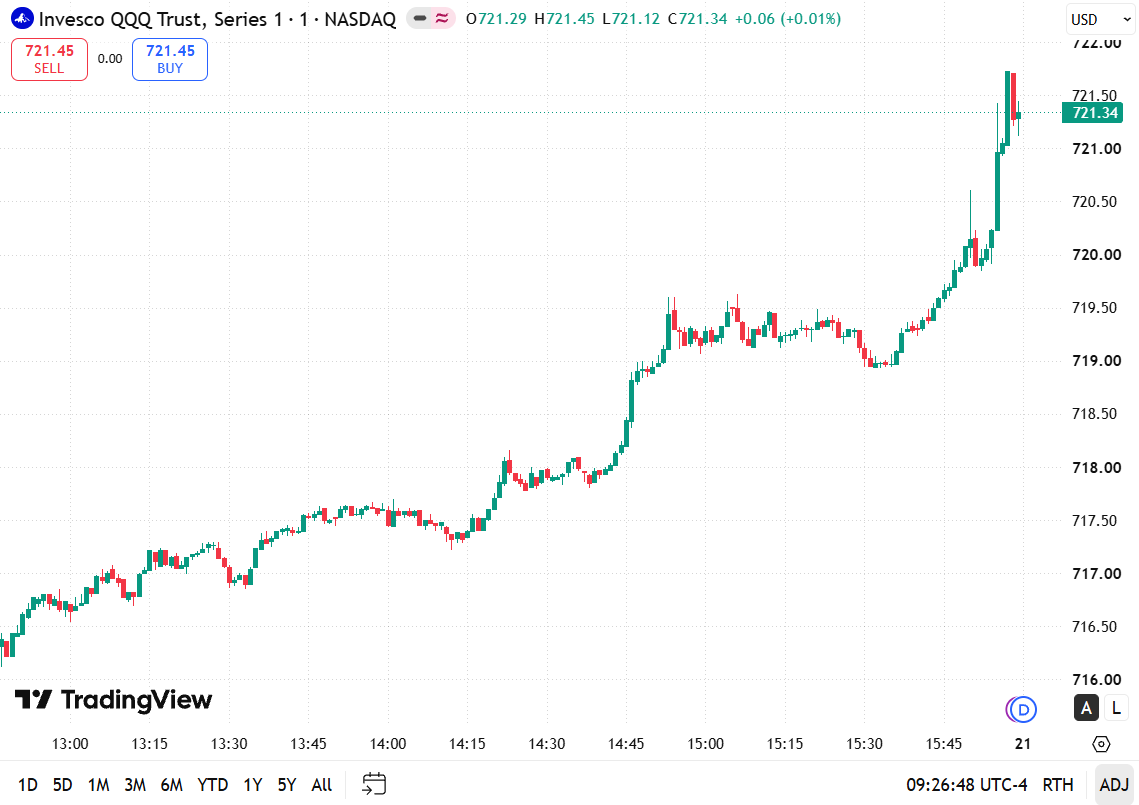
$QQQ 1-min chart breakdown 🚀 Absolute powerhouse session today! Solid step-up structure followed by a vertical squeeze in late trading straight to the $721.80 high. • High of Day: $721.80
• Key Support: $720.00 / $719.00 Tech bulls showing zero mercy into the close. (1/2)👇
$MSFT 1-min chart breakdown 📉📈 Wild price action on Tech giant today! After a steady rally to the $496.80 peak, shares saw a steady fade followed by a brutal iquidity sweep down to $492.20 before a rapid rebound.
(1/2) 👇#MSFT#Microsoft#DayTrading#FinTwit#USStocks $QQQ
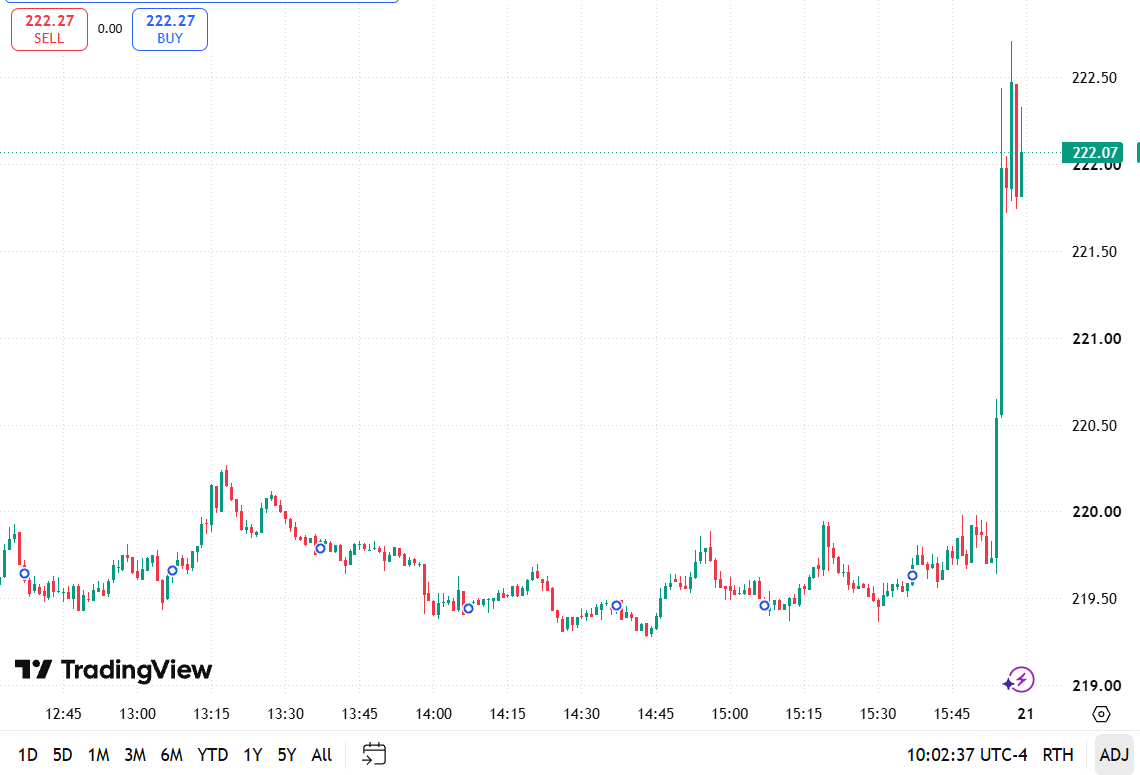
Massive intraday vertical squeeze! 🚀 After hovering in a tight range around $219.50 all afternoon, price surged violently into the close to print a sharp high near $222.70. • Intraday High: $222.70
(1/2) 👇#DayTrading#FinTwit#Trading#PriceAction#USStocks