In the market environment you have to make the rules to the game and then have the discipline to abide by these rules, even though the market moves in ways that wilt constantly tempt you into believing you don't need to follow your rules this time.
"The biggest key in times of elevated uncertainty is to not dig in with an opinion. When a trader's opinion starts to influence their discipline, it inevitably leads to disaster. It may not be fun taking more small losses or 'paper cuts', but I assure you that is a prudent pr...
Quote of the Day:
"The biggest key in times of elevated uncertainty is to not dig in with an opinion. When a trader's opinion starts to influence their discipline, it inevitably leads to disaster. It may not be fun taking more small losses or 'paper cuts', but I assure you that is a prudent price to pay for avoiding the risk of ruin and living to fight another day."
— @markminervini
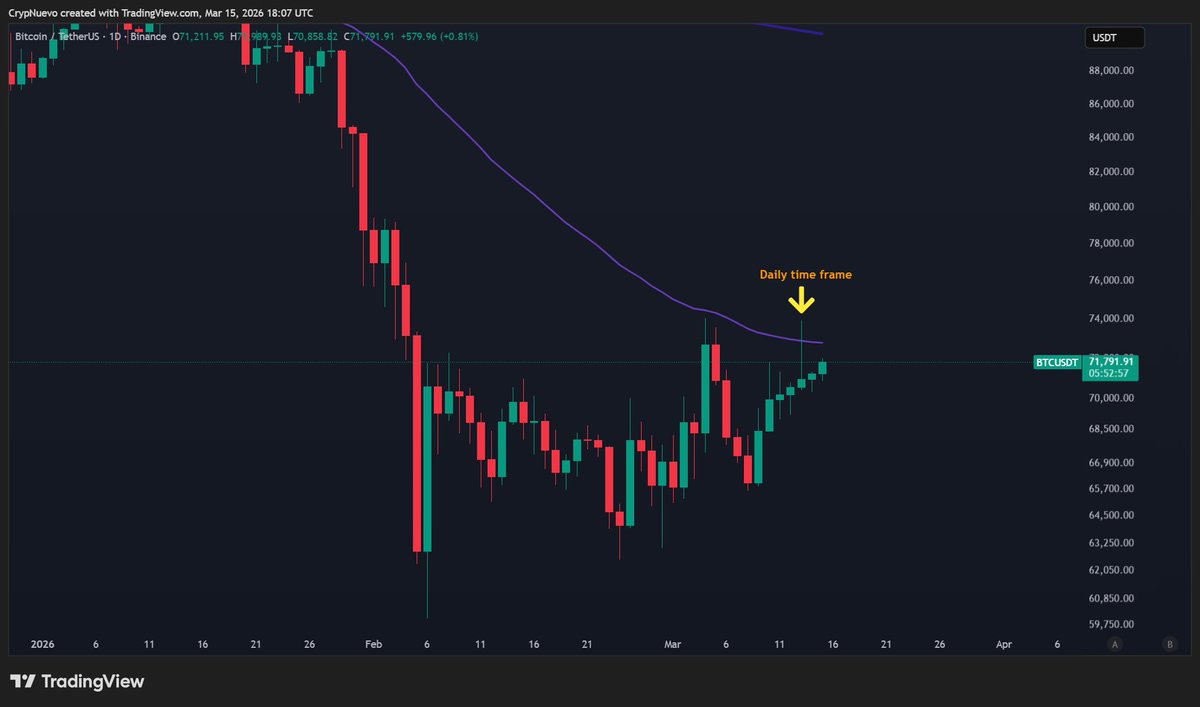
$BTC Sunday update:
Price is back at the range lows of this 4-month range.
I'm expecting a strong bounce here, not because it's a range since all of them eventually break, but because this drop was too sharp (-25% in 4 weeks) and is extremely overextended.
🧵↓(1/5)
!!"If your edge puts the odds in your favor, then every loss puts you that much closer to a win.
When you really believe this, your response to a losing trade will no longer take on a negative emotional quality.
If your edge puts the odds in your favor, then every loss puts you that much closer to a win. When you really believe this, your response to a losing trade will no longer take on a negative emotional quality.
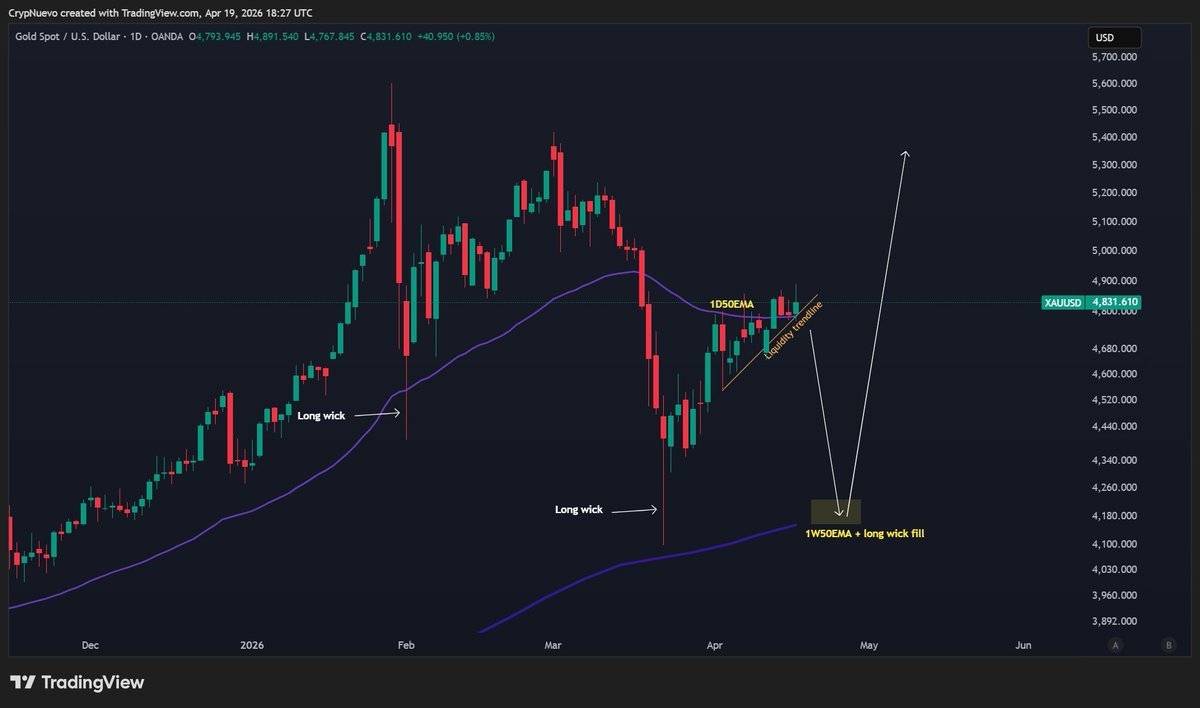
$GOLD is following our ambitious projection so far.
If we get a retest of $4100-$4200 anytime over the next 2 months, I'll take a full size long from there.
It'd be the clearest swing trade of the year imo since it'd be filling a long wick and retesting the 1W50EMA support.
"We're 252% of stock market cap to GDP. In 1929 we were 65%. In 1987 we got to ~85-90%. In 2000, 170%.
If you think about the periodicity of significant bear markets. Since 1970, we get a mean reversion about every 10 years.
Let's say mean revert to the past 25 or 30-year PE
Paul Tudor Jones says the US is more dependent on equity prices than ever, and explains what a 35% correction would trigger in the economy:
"We're 252% of stock market cap to GDP. In 1929 we were 65%. In 1987 we got to ~85-90%. In 2000, 170%.
If you think about the periodicity of significant bear markets. Since 1970, we get a mean reversion about every 10 years.
Let's say mean revert to the past 25 or 30-year PE. That would be a 30, 35% decline. Well, 35% on 250% of GDP is 80, 90% of GDP.
10% of our tax revenues are capital gains, they go to zero. So you can see the budget deficit blowing up. You can see the bond market getting smoked. You can see this kind of negative self-reinforcing effect.
In the stock market, we're over-equitized as a country. We have the highest individual equity weightings in the history of the country.
And then the real problem is if you look at private equity in 2007-2008, that was about 7% of institutional portfolios. Now it's about 16% of the institutional portfolios. We're so much more illiquid than we were in 2008.
The problem is that if you buy the S&P at this current valuation, the 10-year forward return is negative when you buy the S&P with a PE of 22. That's what history shows.
So yes, the S&P is spectacular long-term, if you have a hundred-year view. But that's because that's an average of a hundred years, including times when the S&P 500 PE was 6, 7 and 8, or one third of what it is right now.
Valuation matters a lot, and the stock market's really high and it's gonna be really hard to make money from here with any kind of long-term view."
$BTC is in a daily bear flag. Price is rising. OI is rising. Volume is declining.
Most people see the green candles and get excited.
Here's what the data is actually telling you 👇
📈 Rising price inside a flag = relief rally.
This is not a reversal. It's a retracement. Price is simply filling liquidity overhead before the next move.
The flag is the trap.
📊 Rising OI alongside price = fresh longs being opened into the bounce.
But who's taking the other side of those trades?
In a bear flag context, smart money is shorting into the retail FOMO.
The OI build isn't confirming the move. It's loading the trap.
📉 Declining volume = no conviction behind the buyers.
A real reversal needs expanding volume to show genuine absorption of supply.
A low-participation grind up is exactly what bear flags look like internally.
So what's the probable macro move?
↗️ Price squeezes into the LIQ zone (50-61.8% fib) to grab liquidity
📌 OI spikes → maximum long exposure
🔻 Volume fails to confirm
💥 Flag breaks down → measured move targets previous lows
The ONE thing that invalidates this:
A high-volume daily close above the 61.8% fib with OI holding and volume expanding.
That would signal real absorption, not distribution.
Until then, the weight of evidence favours continuation.
Watch how price REACTS to resistance. Not just whether it touches it.
The reaction tells you everything.
I posted about this level 5 weeks ago. All I've been doing since is waiting for price to get here.
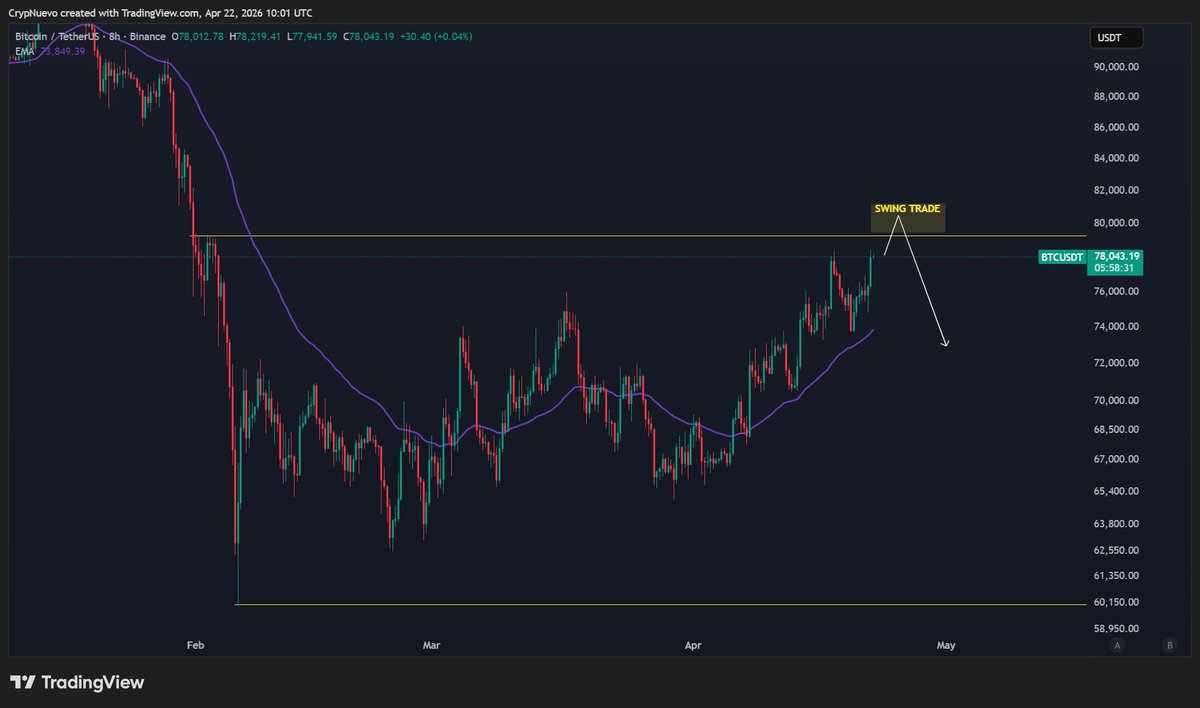
$BTC update:
I'm looking to short a deviation above the range highs, in the area between $79k-$81k where we could see price losing momentum and forming a local top.
Overall, I'm expecting price to stay in this range for some more time.
The rate of UNDER-employed has begun accelerating faster than UN-employment.
This occurs before financial crisis's.
I cover that in this video but what is of MORE importance (which I also cover in the vid) is HOW I use the analysis:
Tune in here:
https://t.co/c9cyrd4N33
Remember that there are only two forces that cause prices to move: traders who believe the markets are going up, and traders who believe the markets are going down.
$BTC update:
Perfect clean day-trade setup 🔨
Price dropped straight to our $69k level where it'd sweep the lows in an overextended move to the downside that needed to be rebalanced.
In trading, context and timing are as important as the levels/zones we mark in our charts.
It has been a great week for trading wicks.
I've only traded longs this week towards the new massive long wick in the weekly (1W) time frame from last week.
Also traded a new long this weekend based on Friday's long wick on the daily time frame (1D).
Now, I see a 4h long wick.