Mathematics.
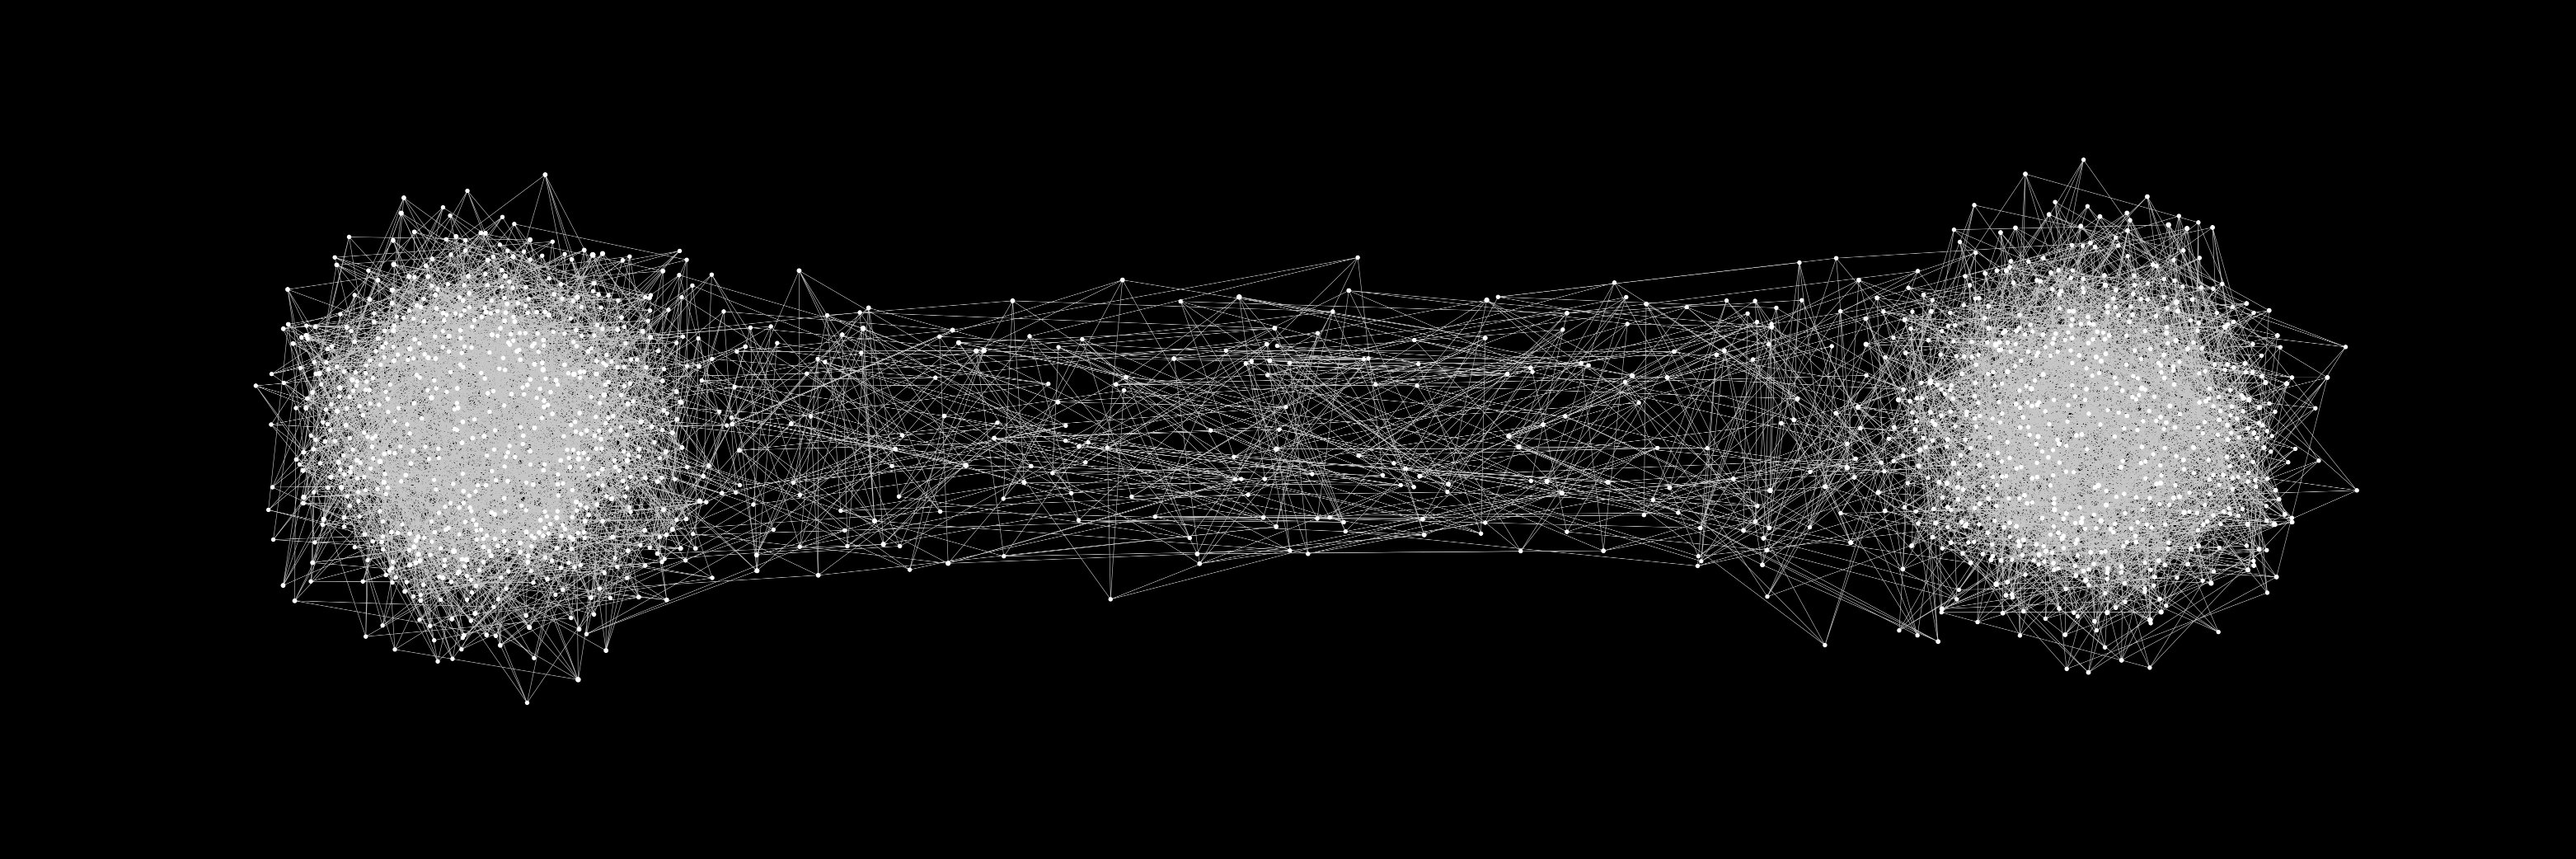
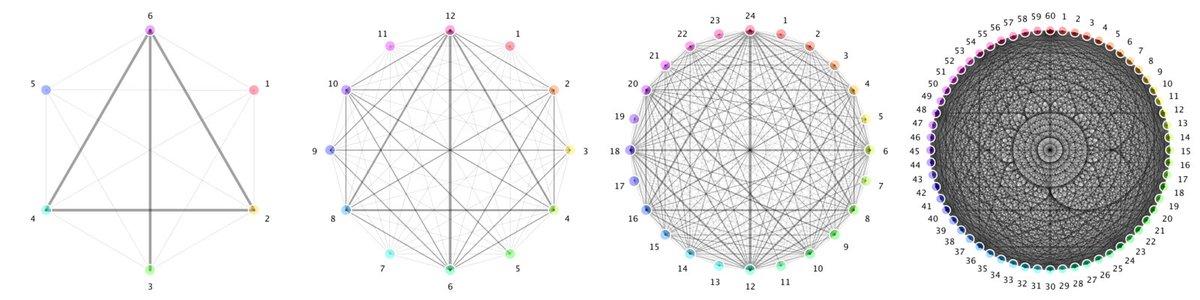
Visualizations of 8 different ways of shuffling 64 cards. The horizontal lines of dots represent the particular orders of the cards throughout each shuffle. The vertical curves represent paths the cards take from start to finish. Source: https://t.co/07emWOlQcE
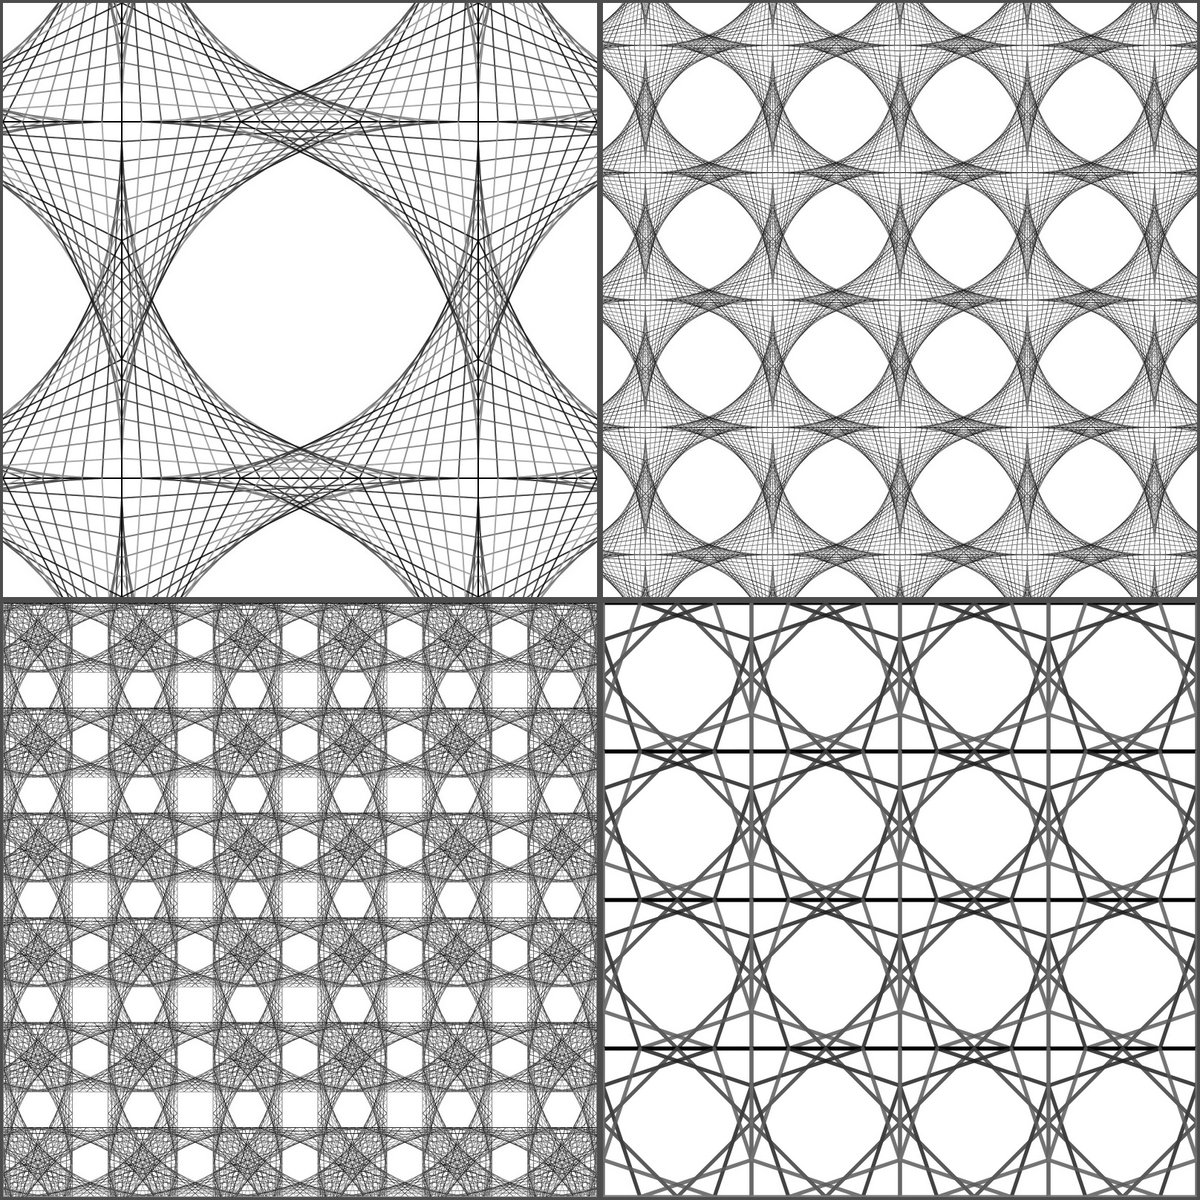
Excited to run the workshop “Visualizing Mathematical Structures with #Processing” during week 2—the Illustrating Math week—of the Institute for Advanced Study / PCMI Graduate Summer School. We’re off to a great start! https://t.co/b4qRXeNWyx @the_IAS#mathart#processing
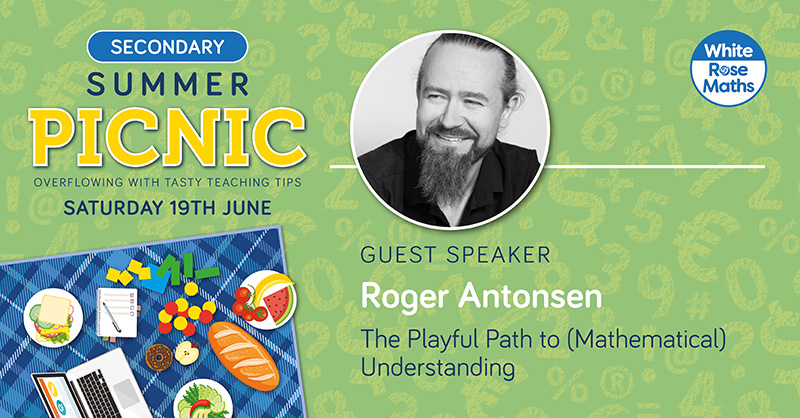
⭐ It's time for our last session of the day, and what a session to end on!
Internationally renowned guest speaker @rantonse is taking us down The Playful Path to (Mathematical) Understanding!
#MathsPicnic
Can we ever fully grasp what artificial intelligence will look like without first understanding how human intelligence works? @atomseden asks @rantonse and computer scientist Barbara Grosz. https://t.co/cVaeE3dVKq
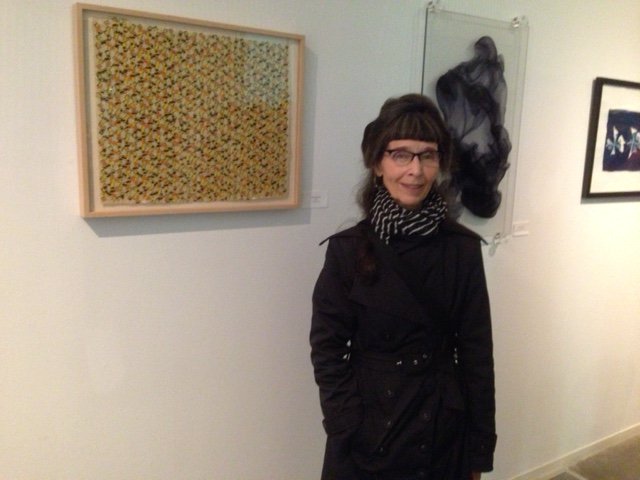
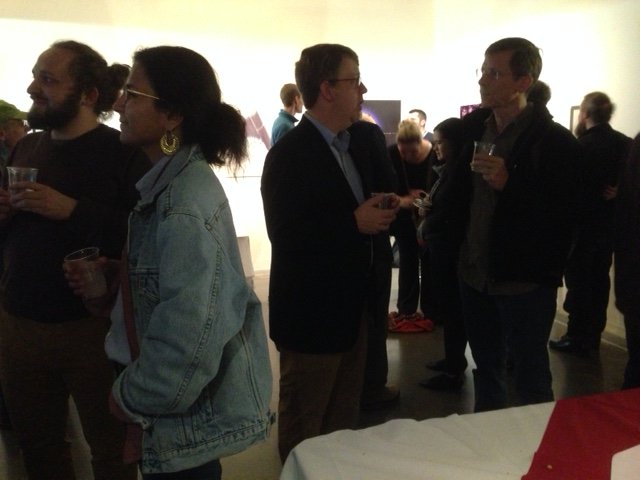
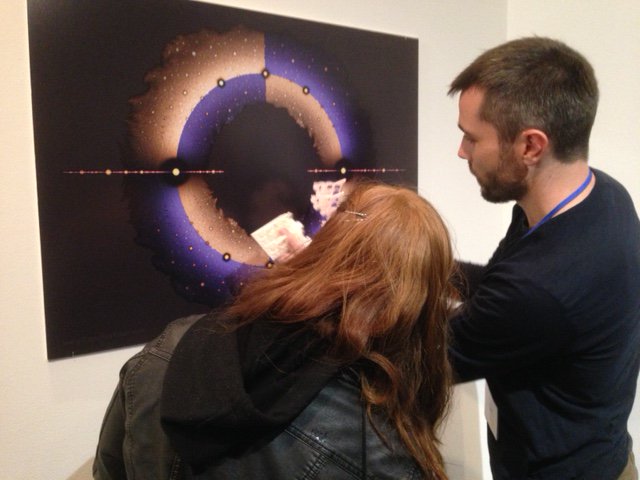
.@BrownUniversity@ICERM reception celebrating "Math+Art" show @BAIBrownU Granoff Center: from left w/ their art, Roger Antonsen @rantonse University of Oslo @UniOslo; Jacqueline Ott; Bernat Espigule @bernatree Universita de Barcelona;& (center) ICERM director Brendan Hassett