Inflation is the silent thief.
Over the last 30 years, it cut the value of $1 in half.
But $1 invested in the S&P 500 grew to over $9 – AFTER adjusting for higher prices.
That’s the power of ownership.
The stock market doesn’t always move with the economy.
Since 1965, the S&P 500 has alternated between long periods of explosive growth and “lost decades”:
📉 1965–1978: S&P 500 CAGR of just 0.1%
📈 1978–2000: S&P 500 CAGR of 13.4%
📉 2000–2013: S&P 500 CAGR of just 0.04%
📈 2013–2021: S&P 500 CAGR of 13.5%
The biggest returns came when stock valuations started relatively low compared to GDP.
Someone who invested $5,000 in U.S. stocks annually between 1980 and 2023 at the best and the worst possible juncture each year: A portfolio with perfect timing would have grown to nearly $5.6 million in the S&P 500 while the one with perfectly awful timing would grow to $4.3 m..
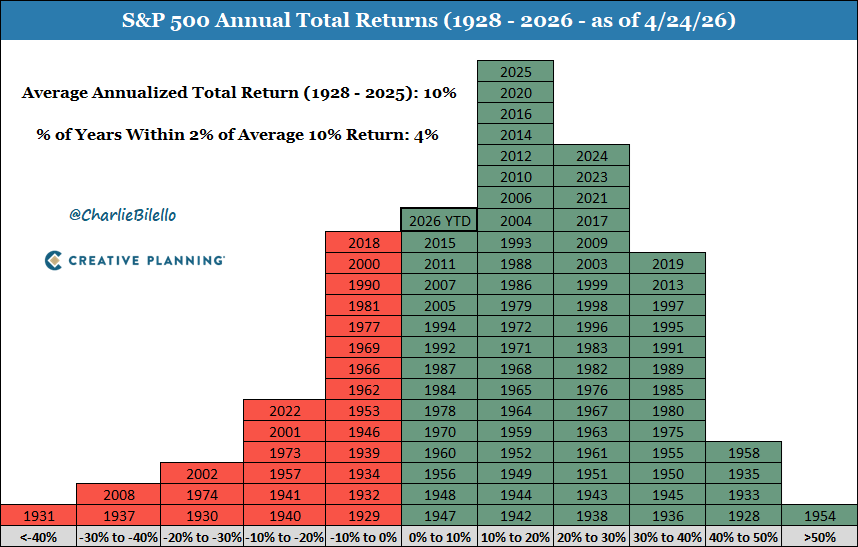
You might be wondering why this chart appears to be flipping you the bird.
Well, that’s the stock market for you.
While it's averaged 10% over long periods of time, it doesn't do it in a nice, linear, stress-free way.
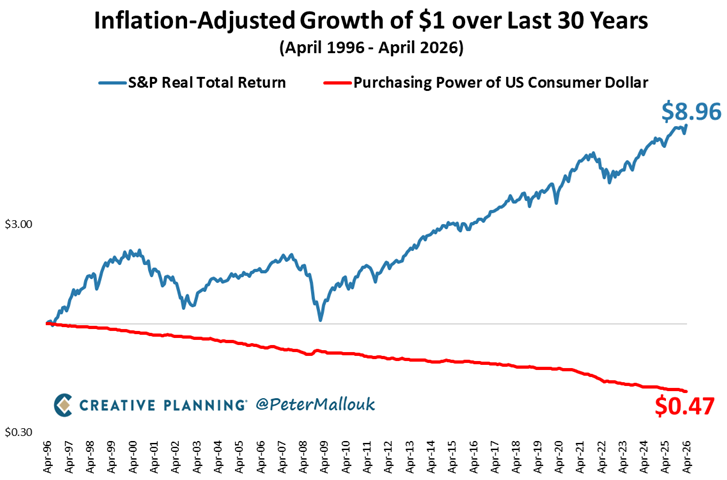
Inflation is the silent thief.
Over the last 30 years, it cut the value of $1 in half.
But $1 invested in the S&P 500 became nearly $9 – AFTER adjusting for higher prices.
That’s the power of ownership.