This paper is simply wrong about its central topic: how Hyperliquid’s ADL works.
Tarun is describing a different (much crazier) algorithm, which also might explain how he calculated that traders somehow paid $653m to cover a $23m deficit.
🧵
wrap = approval is done deal. He's essentially doing videos on all the pertinent depts that are involved in approving ETFs and ETPs, only one missing is Trading and Markets.
Hashdex recently met w/ SEC Division of Trading & Markets re: bitcoin ETF (DEFI) filing...
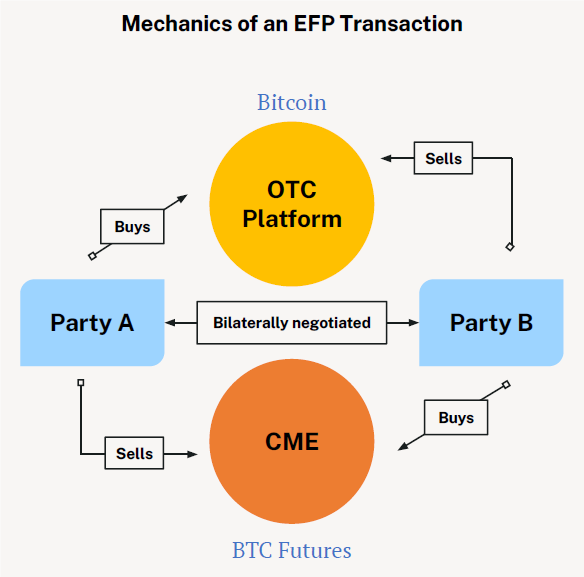
DEFI is unique, wild card filing b/c it will buy physical btc (& take pricing) from regulated market (CME).
Interesting info here & shows ongoing dialogue w/ SEC.
https://t.co/7y1r6Yi1PN
“If you took @t1alpha's resources away from me, I would retire. I would not play the game. I don’t like playing the game with one hand tied behind my back voluntarily.” – @KeithMcCullough
In Thursday’s Q4 Macro Themes presentation, our CEO gave a brief overview of how Tier 1’s data bolsters Hedgeye’s tried and true, go anywhere investing process.
“It matters as much as anything that I’ve seen in terms of macro awareness that I’m trying to get you to.”
Click here to learn how you can become more macro-aware with Tier 1's valuable market information: https://t.co/bBn0K1pJLk
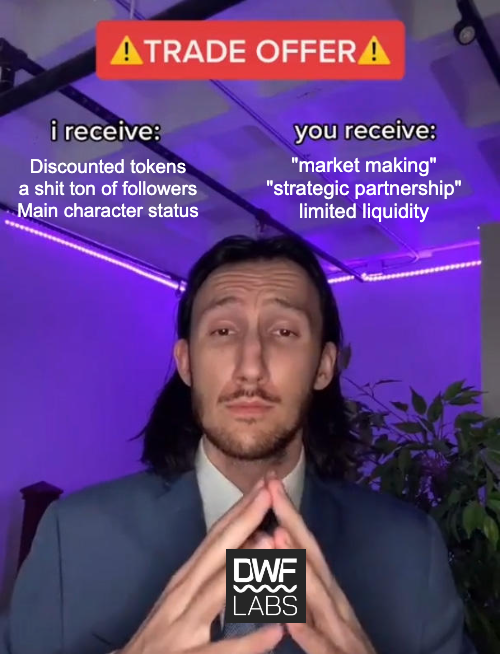
1/ 🧵 Lately, a narrative is spinning around an entity posing as a Market Maker, OTC desk & Venture firm. Many believe their actions don’t align with genuine market-making or OTC trading practices.
Let’s take a closer look👇:
A few interesting trading ideas to explore 🧵
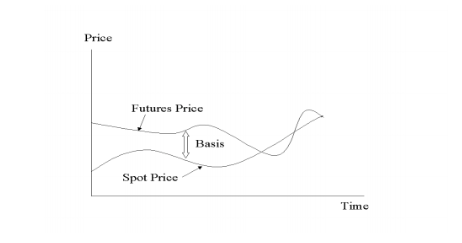
1/x Exploiting the $VIX term structure & the future-spot convergence by shorting $VXX when the basis is in a high Contango ( >= 6%), also known as "the $VIX basis trade"
Moving Average Answer Key:
Moving averages allow traders the ability to quantify trends and act as signals for entries, exits, and trailing stops. They can become support and resistance, and give the trader levels to trade around. Below are examples of the specific moving averages with time frames.
• 5 Day EMA: Measures the short term time frame. This is support in the strongest up trends. This line can only be used in low volatility trends.
• 10 day EMA: “The 10 day exponential moving average (EMA) is my favorite indicator to determine the major trend. I call this ‘red light, green light’ because it is imperative in trading to remain on the correct side of a moving average to give yourself the best probability of success. When you are trading above the 10 day, you have the green light, and you should be thinking buy. Conversely, trading below the average is a red light. The market is in a negative mode, and you should be thinking sell.” – Marty Schwartz
• 20 day EMA: This is the intermediate term moving average. It is generally the last line of support in a volatile up trend.
• 50 day SMA: This is the line that strong leading stocks typically pull back to. This is usually the support level for strong up trends. Use 50-Day Average For Trading Signals
• 100 day SMA: This is the line that provides the support between the 50 day and the 200 day. If it does not hold as support, the 200 day generally is the next stop.
• 200 day SMA: “My metric for everything I look at is the 200-day moving average of closing prices. I've seen too many things go to zero, stocks and commodities. The whole trick in investing is: “How do I keep from losing everything?” If you use the 200-day moving average rule, then you get out. You play defense, and you get out.” - Paul Tudor Jones
Bulls like to buy dips when price is above the 200-day moving average, while bears sell rallies short below it. Bears usually win and sell into rallies below this line as the 200 day becomes resistance, and bulls buy into deep pullbacks to the 200 day when the price is above it. This line is one of the biggest signals in the market telling you which side to be on. Bull above, Bear below. Bad things happen to stocks and markets when this line is lost.
Let's talk about various manipulative shenanigans that used to go on at FTX.
We'll start with something widespread on sh1tcoin perpetual futures: funding rate manipulation.
If you looked at trades in the trash that FTX listed, you'd see all these min qty trades
What are they?
Since the start of 2022:
The Pound is down 21% vs USD
The Yen is down 20% vs USD
The Euro is down 15% vs USD
The “Dollar Milkshake Theory” predicted accurately that the US Dollar would outperform other currencies.
Here's what you need to know about this theory👇