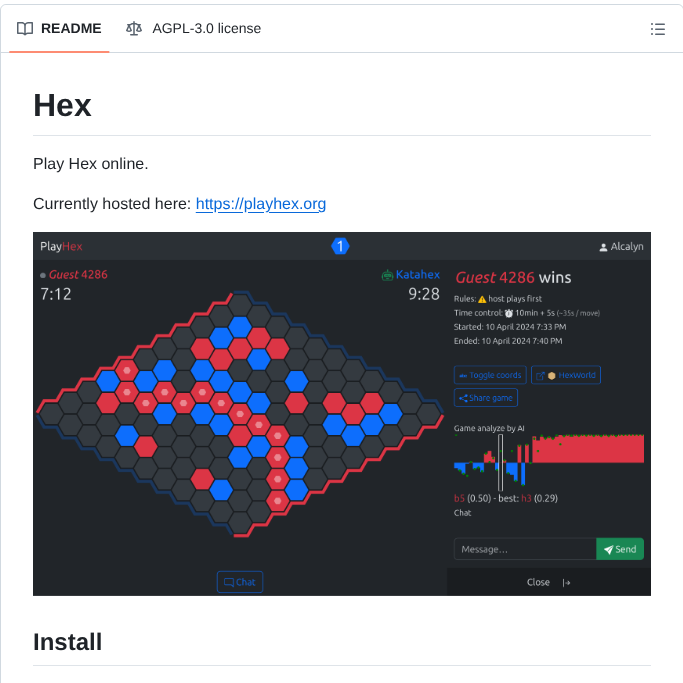
🌿🌳 Combining Open-Source #MachineLearning and Publicly Available #Aerial Data (NAIP and NEON) to Achieve High-Resolution High-Accuracy Remote Sensing of #Grass–#Shrub–#Tree Mosaics
✍️ Brynn Noble and Zak Ratajczak
🔗 https://t.co/SnPNPpg1Kw
The Wilcoxon Signed-Rank Test is a non-parametric statistical test used to compare two related samples or repeated measurements to determine if their population distributions differ. Unlike the paired t-test, which assumes normal distribution, the Wilcoxon Signed-Rank Test is suitable for non-normally distributed data or data with outliers.
Advantages:
✔️ Suitable for non-normally distributed, ordinal data, or data with outliers.
✔️ Ideal for small sample sizes, providing robust results where the paired t-test may not be reliable.
✔️ Uses rank differences instead of actual values, reducing the impact of outliers and making fewer assumptions about the data.
Limitations:
❌ Compares ranks of differences, not specific measures like means or medians, potentially losing information about the magnitude of differences.
❌ Results can be misleading if data isn’t truly paired or if the assumptions, such as symmetry of differences around the median, are not met.
❌ Less powerful than the paired t-test when data is normally distributed.
Important Considerations:
While often used to assess differences between medians, the Wilcoxon Signed-Rank Test actually tests for differences in ranks of paired observations. This means it is sensitive to various aspects of the data, including the distribution's shape. If the data isn’t symmetric or doesn’t meet the test's assumptions, the test may not compare medians accurately and could lead to increased Type I error. For direct median comparisons, especially with non-symmetric data, consider alternatives like quantile regression or Mood's median test. Permutation tests also offer a flexible, non-parametric option for testing hypotheses about various statistics without relying on rank transformations.
Visualization Explanation:
The visualization compares the distributions of two skewed samples, "Time 1" and "Time 2," using density plots with dashed lines indicating their medians. Although the medians are displayed, the Wilcoxon Signed-Rank Test actually assesses the ranks of paired differences, rather than directly comparing medians. The test can only be used to compare medians if the samples are independent and identically distributed (IID), have the same dispersion and shape, and are symmetric about their medians. If these conditions are not met, the test may not accurately compare medians. In such cases, consider alternatives like quantile regression or permutation tests, which do not depend on rank transformations.
Explore more on this topic and other statistical methods in my online course on Statistical Methods in R! Learn more by visiting this link: https://t.co/7YQCRDKSPO
#RStats #DataAnalytics #Python #VisualAnalytics #R4DS
🎁 A New Year’s gift to the geospatial community: a brand-new QGIS plugin that unlocks access to 80+ petabytes of satellite imagery and geospatial datasets with zero coding required.
In my first video of 2026, I’m excited to share what might be one of the most powerful QGIS plugins I’ve built so far. This plugin makes it incredibly easy to explore the official Earth Engine Data Catalog and the Awesome GEE Community Catalog directly inside QGIS.
With just a few clicks, you can browse massive Earth Engine datasets, visualize them on the map, generate time series from ImageCollections, export data for further analysis, and even convert Earth Engine JavaScript workflows to Python, all without writing a single line of code.
If you’ve ever wanted the power of Earth Engine inside QGIS without the learning curve, this plugin is for you.
👉 Download the plugin and follow the full step-by-step video tutorial to get started today:
QGIS Plugin Page: https://t.co/o4wrN44uZr
GitHub Repository: https://t.co/NB4shvrL7b
Video Tutorial: https://t.co/HjBHDQGMy7
Happy New Year, and I hope this tool helps you do more with geospatial data in 2026 🚀
#QGIS #geospatial #EarthEngine #Python #datascience
O documento vai funcionar como uma bússola da pós-graduação brasileira para, a partir de bases científicas, identificar oportunidades de expansão de acordo com as necessidades regionais e induzir a geração de talentos nos mestrados e doutorados. Acesse: https://t.co/GtSXp2ffVn
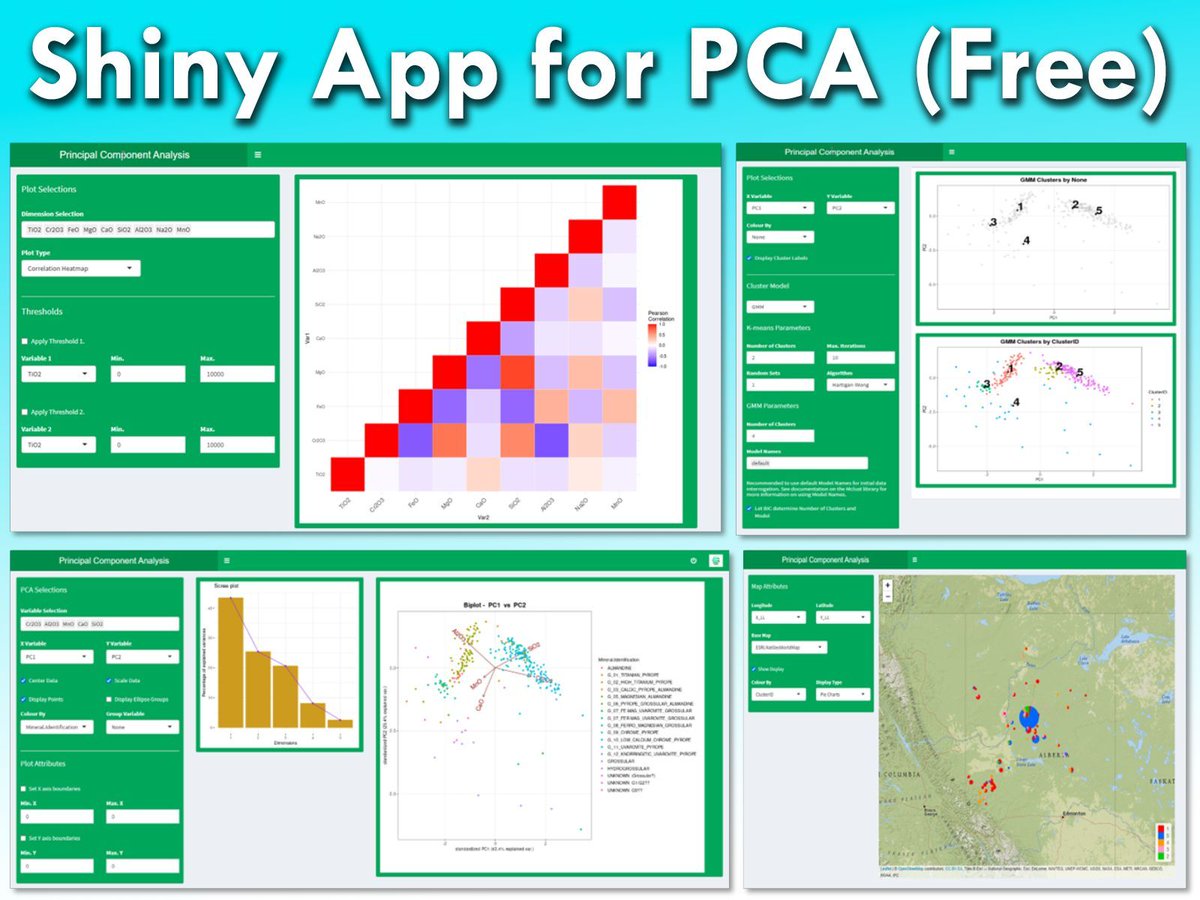
Check out this R Shiny app for Principal Component Analysis (PCA). It is an easy way to explore your data without writing code.
Upload your CSV file to:
✔️ Analyze correlations between variables
✔️ View scree plots and loadings
✔️ Generate biplots for visual insights
✔️ Apply K-means or GMM clustering for classification
The image shows the PCA tool in action, including correlation heatmaps, scree plots, biplots, clustering results, and interactive maps. All features run directly in your browser.
Thanks to Dean Smith for creating this app! Try it here: https://t.co/HEyjony53n
Ready to learn more about PCA using the R programming language? Enroll in my online course.
More details are available at this link: https://t.co/DUfoAHuxxD
#Statistical #datastructure #RStats #VisualAnalytics #Python
I just updated the scDiffEq Python API (v1.1.0) to include animated visualizations of simulations.
You can generate GIFs (or still images) showing:
- Temporal gene expression dynamics
- UMAP projections of simulated trajectories
During my PhD, I found animations like these useful in presentations.
Available now in the latest release: https://t.co/Wkl0My7xT8
🚨 BREAKING: Google Research just dropped the textbook killer.
Its called "Learn Your Way" and it uses LearnLM to transform any PDF into 5 personalized learning formats. Students using it scored 78% vs 67% on retention tests.
The education revolution is here.
Future Prediction of Urban Growth Modelling using Cellular Automata (CA) with Python
👉 Tutorial link is: https://t.co/qxcea869Bp
Registration Info Link: https://t.co/HkWGNwfBn1
#googleearthengine#GEE#EarthEngine
🌾 Around Prague 🇨🇿, large arable fields highlight the region’s strong farming tradition.
This #ImageOfTheDay uses #CopernicusEU Land Monitoring data to map crop types, revealing detailed patterns in land use that support food security & policy.
🔗 https://t.co/yhOK2Eu5xW
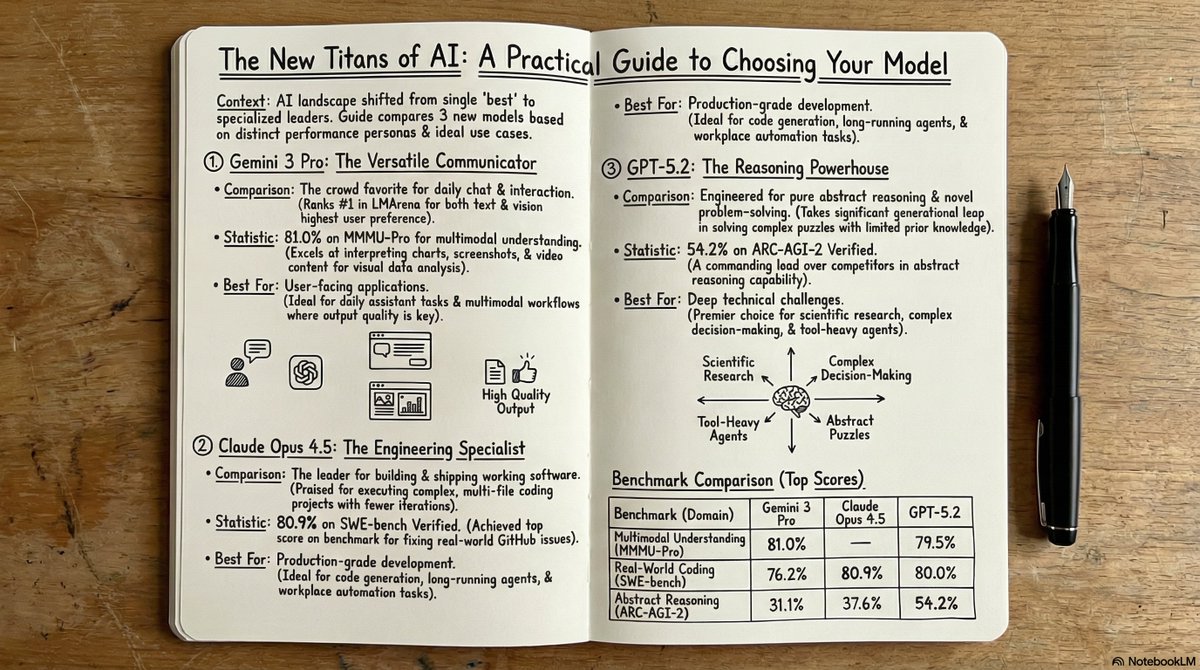
using @NotebookLM vanilla (no prompt) infographic function vs adding a custom prompt makes a HUGE difference in quality!
No prompt (L)
Custom prompt (R)
O documento vai funcionar como uma bússola da pós-graduação brasileira para, a partir de bases científicas, identificar oportunidades de expansão de acordo com as necessidades regionais e induzir a geração de talentos nos mestrados e doutorados. Acesse: https://t.co/GtSXp2ffVn
O prazo para inscrição de proposta vai até 30 de dezembro e serão ofertadas uma bolsa na modalidade cátedra. O selecionado poderá indicar um bolsista de pós-doutorado e outro de doutorado-sanduíche. Confira o edital e inscreva-se em:https://t.co/F2c9lxgCYg
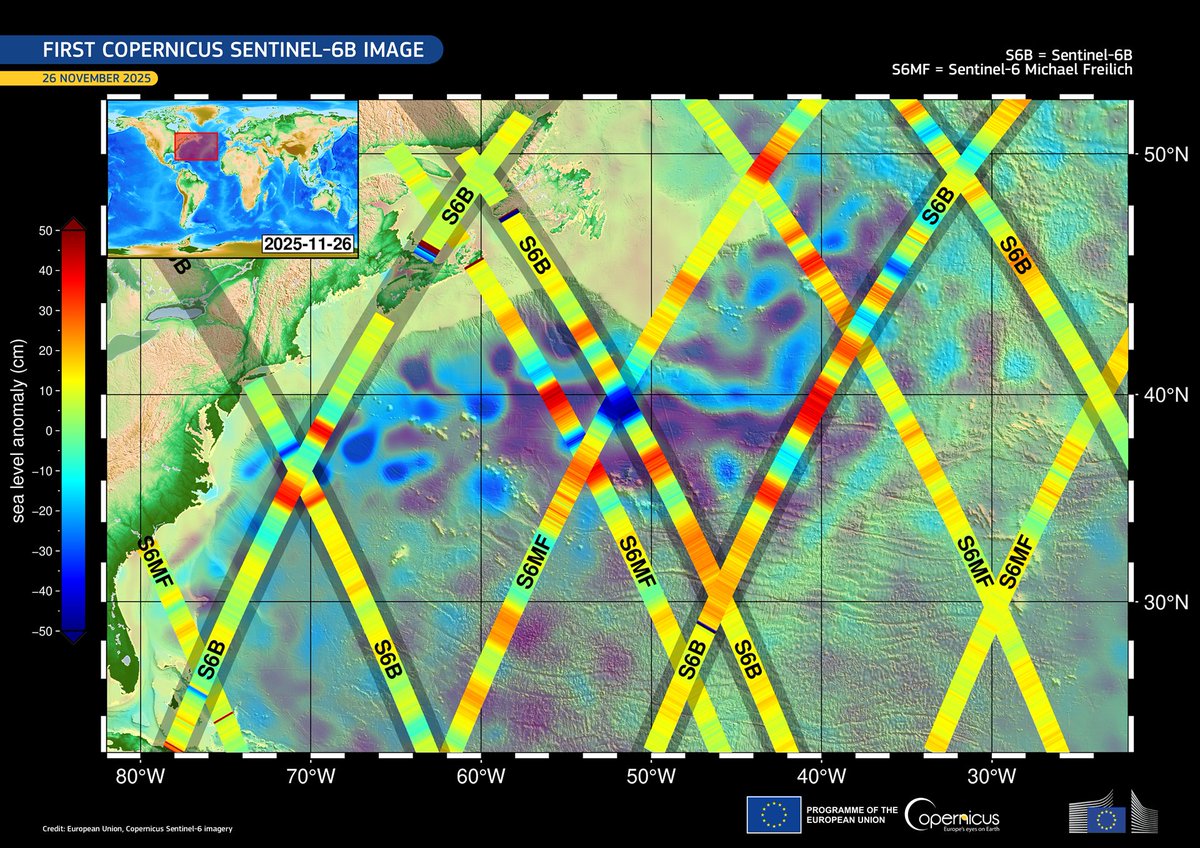
🌊🛰️ Just weeks after its launch, #CopernicusEU Sentinel-6B has delivered its 1st images - an early demonstration of how the mission will strengthen the global monitoring of oceans, coasts & inland water bodies.
🔗 https://t.co/TkeKNKX9T1
@eumetsat@esa@NASA@NOAA@CNES
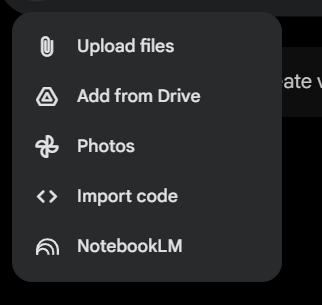
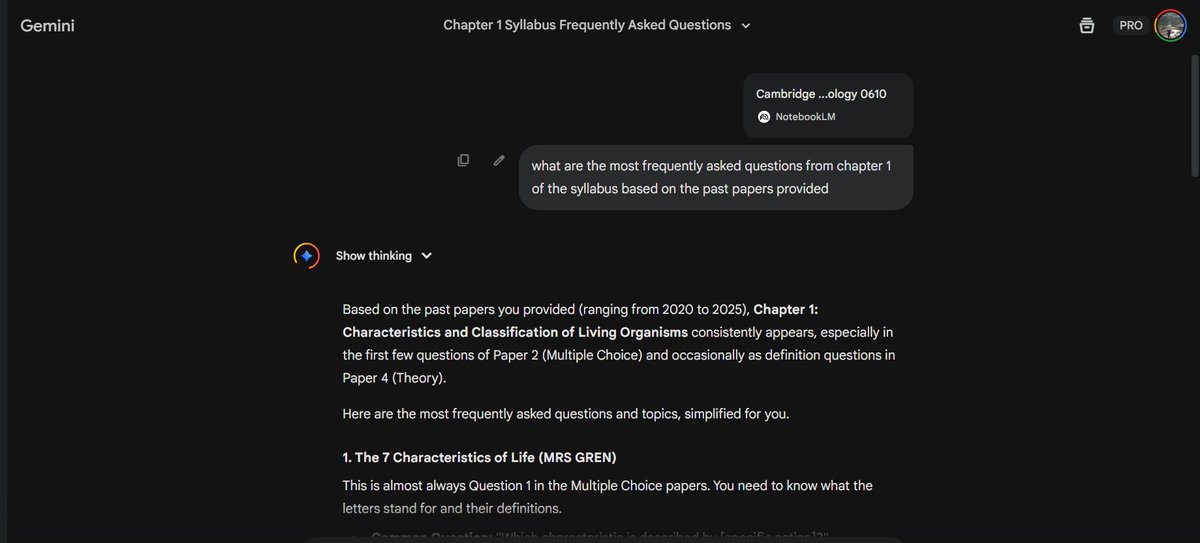
🚨BREAKING: Google is rolling out NotebookLM inside Gemini Chat.
– Attach your notebooks
– Bring all your research into chat
– Get deeper, more accurate responses


![dnltbing's tweet photo. Whole genome shotgun phylogenomics resolve the diving beetle tree of life
[Bergsten et al. 2025]
https://t.co/vmGpGw534R https://t.co/K9BmOrVVVN](https://pbs.twimg.com/media/G9BmYnBaQAAh_V0.jpg)