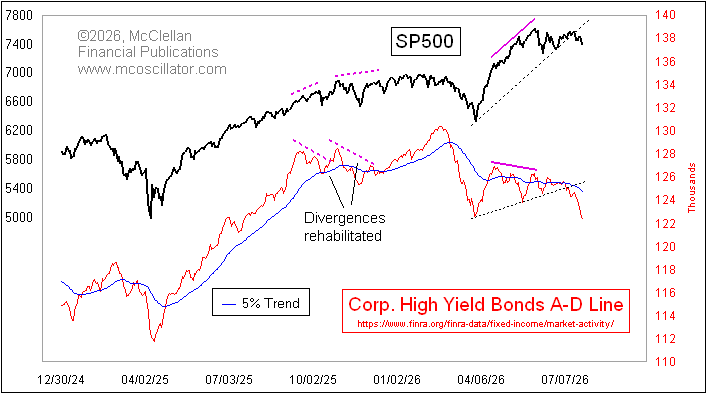
The raw A-D Line for HY corporate bonds looks pretty bad right now. These bonds trade more like stocks, and draw from the same liquidity pool. But they are low quality investment vehicles, not deserving of investor money, so they only do well when liquidity is plentiful. When it dries up, they are the canaries in the coal mine, keeling over from bad gases before the coal miners.
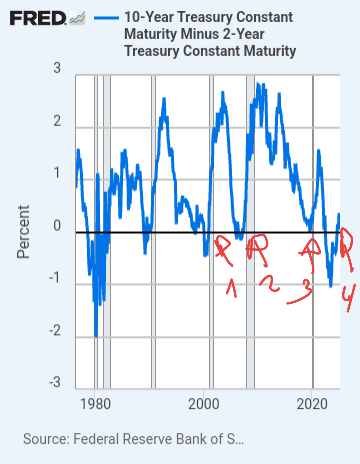
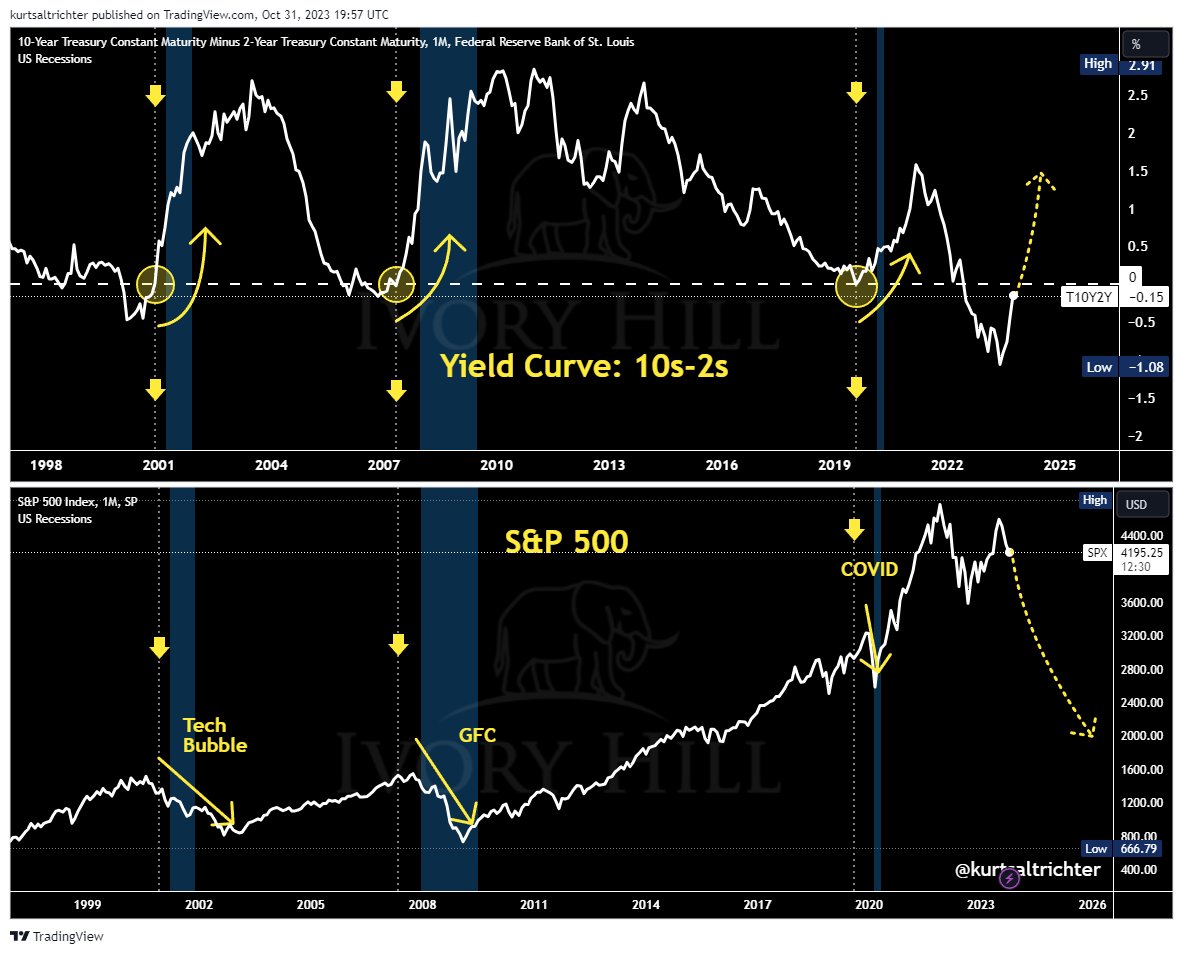
Every time we see an inverted yield curve paired with a flattening Fed funds rate, the U.S. economy is heading into a recession.
When the Fed starts cutting rates and the yield curve flips positive, we're on the brink of a recession and a major market crash.
This market currently has an 85% correlation to the summer of 2007.
This time is no different.
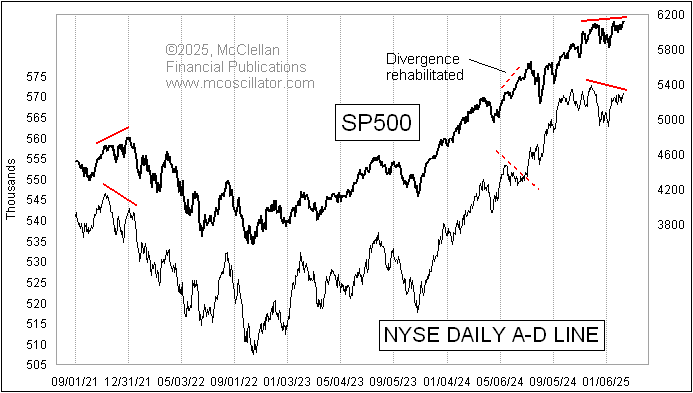
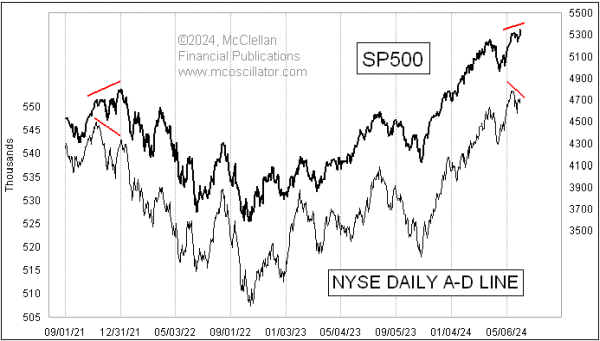
I have had discussions with several people about the topic of a new high in the NYSE A-D Line, which is what @StockCharts is showing. My data disagree so I went hunting. They have a data error on Feb. 12 for both advances and declines, repeating the prior day's values. I have notified them so that they can get their data corrected. The NYSE A-D Line still has a bearish divergence, for the moment anyway.
My latest Chart In Focus article, "A-D Line Divergence Shows Bull Market Starting To Crack", is posted at https://t.co/vkpNcfMhXm. And you can sign up at that same link to receive these weekly articles straight to your inbox. No strings, no spam, and we don't sell our list.
"A Fed pivot is bullish for stocks"
"An inverted yield curve doesn't mean a recession is coming"
Based on history, when the Fed pivots with an inverted yield curve, stocks crash.
🚨 The yield curve is on the rise 🚨
Lessons from the last three recessions are clear:
When the 10s2s crosses zero and continues to head north, a stock market crash is either in progress or will be in progress soon.
Our October 11th sell signal is firmly red.