Aprovecho la polémica para compartir un mapa que atesoro: shademap, un mapa que te muestra cómo la luz le da a los edificios. Ideal si querés comprar/alquilar
🌿🌿 Leveraging #Phenology to Assess Seasonal Variations of #Plant Communities for #Mapping Dynamic #Ecosystems
✍️ Thilina D. Surasinghe et al.
🔗 https://t.co/ODXA0iy4mv
Day 150 of #365DaysOfMaps. May 30th is National Hole in my Bucket Day. If you know a Henry or Liza then today is the day to hum a tune to them.
Hole in my Bucket (150/365)
https://t.co/b4zupYsqEA
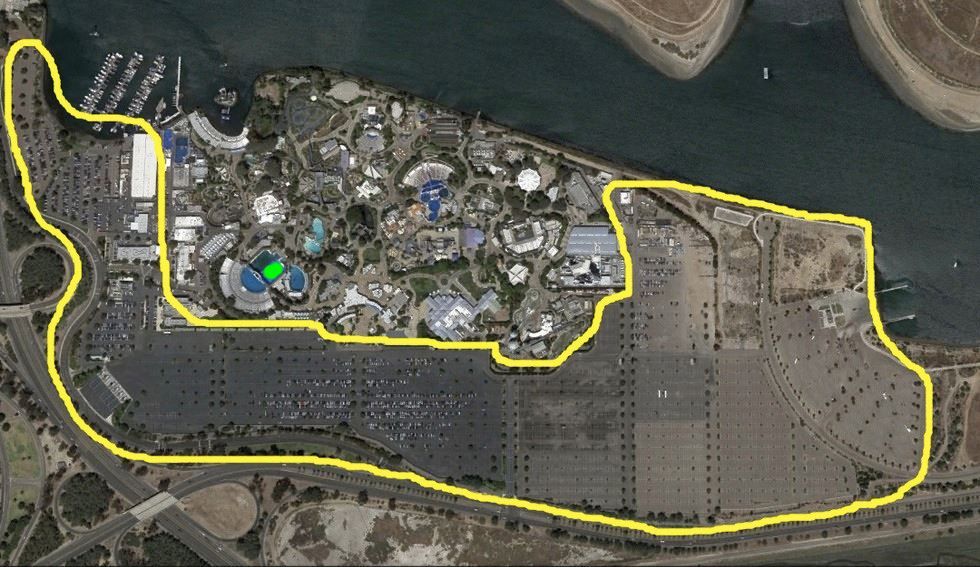
I was sent this map without a source but I thought it was impressive nonetheless. It shows the SeaWorld parking lot in yellow. The green dot is where Orcas spend their lives.
Working on another simple web-based mapping tool to make it possible for anyone to make a map like this in 30 seconds. Also adding GeoJSON export function to my tools for those who want a simple sketch tool they can import to GIS.