Why are my candles blue/red/green? 🤔
I am getting this question a lot.
It's not a TradingView setting—it's the Simple Volume with Pocket Pivots indicator by @finallynitin.
The indicator simplifies volume analysis by filtering out the noise and highlighting only the volume bars that deserve your attention:
🟦 Blue (Pocket Pivot Volume) – An accumulation signal where today's up-volume exceeds the highest down-volume from the last 10 down days. These often indicate institutional buying and are especially powerful within a base or on a breakout.
🟩 Green – Above-average volume on an up day. This shows buyers are active and supporting the move.
🟥 Red – Above-average volume on a down day. This indicates significant selling pressure or supply entering the stock.
🟧 Orange – Very low "dry-up" volume, where volume has contracted significantly below its average. This is especially useful for identifying VCPs and healthy consolidations.
Most other volume bars are intentionally shown in grey, as they usually don't provide actionable information.
The indicator also includes several useful additions mentioned below and more :
• Relative Volume (%) to instantly compare today's volume with its average.
• Highest Volume labels (HVE/HVY/HVQ) to highlight exceptional institutional activity.
• Bull Snort signals (Oliver Kell) shown with a purple background and/or dot, marking explosive accumulation days with exceptionally high volume and strong closes.
• Daily & 50-day turnover (₹ Cr) displayed in a table for quick liquidity analysis.
• Customizable Volume MA & Relative Volume periods to suit your trading style.
• A visible 50-period average volume on the price scale.
If you want your price candles to match these volume signals, simply enable:
Indicator Settings → Style → ✅ Paint Price Bars
This colors the candles using the same logic as the volume bars, making it much easier to spot accumulation and distribution directly on the price chart without constantly looking at the volume pane.
You can find the indicator here:
https://t.co/sPzsyxGGnC
A big thank you to @finallynithin for creating and sharing this indicator with the community. I've been using it for a long time, and it has become an integral part of my charting workflow. The clean visualization makes reading price and volume much easier, and I genuinely appreciate the effort that went into building and maintaining it. 🙌
Market Quadrant 27/2026
The hard money environment continues. Breakouts reverting to the pivot & even below. Pullbacks starting the day strong & ending in squats. Of the handful of names that showed follow-through, the majority lacked valid entry points.
This is a 'death by a thousand cuts' market which presents tradable setups & stands just on the brink of being called bullish, but the moves keep on failing to materialise. Here, sitting out seems defensive & taking trades seems aggressive. If one stance has to be taken, it should be on the side of defence, as there is not much point in spending too much effort just to earn peanuts.
Bias → Bear
Less than half the stocks above their 200 SMA, but now approaching the 50% mark
Trend → Uptrend (weak)
NNH weak positive + more than half the stocks above 50MA
Swing → Upswing (weak)
MBI weak green + more than half the stocks above 10MA + XP<15
Momentum → Positive but worsening
Realty, Pharma, Chemicals & Capital market indices are leading
4 Entry Types Every Swing Trader Should Know
1. PDH Entry
Price moves above the Previous Day’s High. It shows strength continuing from the last session.
2. Pullback Entry Buying a stock that’s already leading when it dips to an EMA, trendline, or support zone. The pullback should be controlled, not aggressive.
3. Pivot Break Entry
Price breaks a level that has been rejected multiple times. This suggests sellers at that level are finally out of the way. A clean breakout candle usually confirms it.
4. Anticipation Entry
Entering slightly before a breakout, usually inside a tight consolidation on a day where price has gone pretty tight, at EOD. The structure should already be strong so the breakout has a higher chance of happening. Gives better risk–reward.
Daily study of stocks making 20% plus moves in 5 days and stocks showing up in my EP9 million scans. If you do that daily you will find themes early and be on top of themes.
𝗤 𝘀𝗵𝗼𝘄𝗶𝗻𝗴 𝗮 𝗳𝗶𝘃𝗲 𝘀𝘁𝗮𝗿 𝘀𝗲𝘁𝘂𝗽 ⭐ ⭐ ⭐ ⭐ ⭐
So everyone except one person was asleep. At what time, well about the same time it broke out intraday. It’s the most textbook breakout I’ve seen in a while. The right sector, big volume, and just a perfect flag pattern intraday.
I got stopped out the first time around, I took a $13,000 loss on it on this weird red candle. So I had a 5.20 average. I had about half size and then it just shook me out and I got stopped out low 5s. And then I started building back, 5.20 and 5.32, I think, were my entries. My only regret is I didn’t buy 200,000 shares instead of 100,000 shares and then it went just straight up. It is the most textbook flag ever. Higher lows intraday at the range. It’s a hot sector, the hottest sector we’ve seen in probably year plus. Record volume, ultra liquid.
Memorize this, memorize. Trades like that, they don’t grow on trees. Except for the past two weeks they’ve literally been growing on trees, but generally you don’t get them too often. I have to say, I’m a little bit disappointed. Guys, how are you not monitoring these coronavirus stocks? It’s the hottest sector. Only one person saw it. And that person didn't even buy it.
Okay guys, I'm going to teach you something. If you have a hot sector like this, you have to monitor, you have to create a watchlist and monitor all of the stocks. Just scroll through them during the day. This is unacceptable guys. I’m a little bit disappointed. I’m super disappointed. Just scroll; I have 40 coronavirus stocks in my watchlist and I just scroll through them, the most liquid ones. I sort them by dollar volume. Most of them are too illiquid for me to trade. But every day, pre-market and during the day, I just scroll through this list.
INO is obviously the most liquid one today, GILD—this is a slow moving one, it's not a pump stock. MRNA, APT, CODX, AIM, NVAX. All of these. Just scroll through them, look for setups. Look for news. OMI, they had earnings—oh, good thing I sold it yesterday. Whew! What a piece of shit. ARCT, another one that is getting pumped today.
Guys, you have to do these things. You really have to. There's really no excuse. And if you think there's too many, just focus on the most liquid ones. Markets like these are when you can make your whole year in a few weeks. Like a whole year happens in a few weeks. That’s the market environment we are in right now. And you just have to do this over and over and over again.
Doing the 20% study daily and tracking n plotting the reading after every session tells me if the market is stretched or not before I do something stupid. This one study alone has kept me out of more bad trades than anything else
Grateful @PradeepBonde🙏
Qullamaggie on Everything Looks Like a Flag if you Look Closely Enough
“Everything looks like a flag if you look closely enough. We’re looking for very specific setups that give us an edge. We want edge, not randomness.”
Qullamaggie on Ignore Weak Stocks
“ROKU? Look guys, these kind of stocks - it’s a weak stock. Ignore these, ignore these. Focus on the strong ones. There’s a lot of random stocks. Ignore all of these. Focus on the ones that are in uptrends and that have been holding up really well during the correction. Focus on those ones. That’s where the big money is.
Like ROKU is literally inside of a range right now. This thing has no upside.
Look at stuff like DDOG. Look at stuff which I passed on. Look at stuff like WORK, which I am long. These are the types of stocks you wanna own. These are the types of stocks you wanna own. Look at this.
TDOC also, this one I didn’t think it was gonna go. I saw it breaking out early, but I passed on it. But it’s just - they can’t hold it down. And as soon as the market selling eased, this thing exploded. All of these. Don’t, don’t look at these weak stocks. Ignore them.”
🚨 Presenting the Strong Start RVOL Dashboard TradingView indicator, free for everyone!
Paste a watchlist → it ranks every name by RVOL & stars the ones that have a strong start
- Credits to @FreeThinkEd for the original script on which this is based
- Credits to @imanasarora for the strong start concept
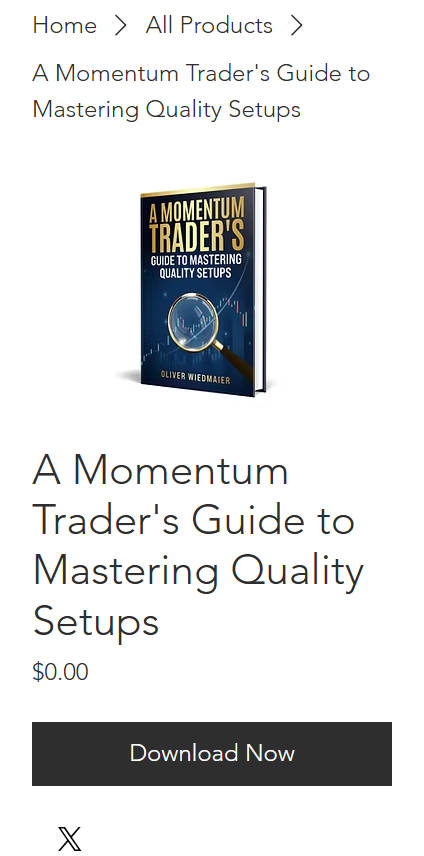
I'm excited to announce that my book will finally be released this weekend.
To honor the incredible community of traders and friends I've learned from over the years, it will be 100% free.
This is my way of paying it forward.
Inside you'll find 120+ pages and 15,000+ words covering the complete process I use to find and trade high quality momentum stocks.
some topics covered:
-Trade tactics
-Habits and Routine
-A guide to perform a Deep Dive
And, most importantly, the "5 Whys". A powerful framework for uncovering the root cause of impulsive decisions, overtrading, and self-sabotaging behaviors.
I can't wait to share it with all of you this weekend.
𝗤 𝘀𝗵𝗼𝘄𝗶𝗻𝗴 𝘁𝗵𝗲 𝗯𝗮𝘀𝗶𝗰 𝗺𝗼𝗺𝗲𝗻𝘁𝘂𝗺 𝗽𝗮𝘁𝘁𝗲𝗿𝗻𝘀.
It's just these simple patterns. I talk about it all the time. These channels, like you have a big momentum stock, goes up a lot, builds a channel. You have a big momentum stock, it builds a channel this way. You have a big momentum stock, it maybe does something like this with higher lows. You have a big momentum stock, it maybe goes up a lot and then maybe does something like this. These triangles and channels. High-tight flags. It's the same patterns over and over again. It doesn't matter if you learn them from Minervini, Dan Zanger, it's the same things, or Stockbee, right? It's the same things over and over.
It's just so easy. You just need to train your brain to see these patterns on the strongest stocks. That's the key. The strongest stocks, not some random piece of shit. People keep posting these random stocks that have these bull flags, but you need the strongest stocks. You don't have an edge trading some random shit stock that happens to have a good chart pattern. I get these every day, people are posting and asking me about them. It has to be a momentum leader. Just the same patterns over... just look at the stocks I'm in, right?
NVDA, I bought it last week, okay? Very simple. A big momentum stock, look at the pattern. What is it? Do you see this? Do you see this pattern? I bought it here. NIO, I bought it a couple of days ago. What's the pattern, right? Do you see it? I bought it on this day here, like somewhere here, right? LVGO, what's the pattern? Okay, I bought it here, so it was a little bit of a chase. FSLY, I bought it here. What's the pattern? You see this? DDOG, where did I buy it? I bought it here. This wasn't a clean one, but it was showing relative strength. But again, same patterns. You see higher lows and Z, I bought it here. I also bought it here initially.
The same patterns over and over again. There's absolutely no rocket science involved. Anyone who's trying to sell you rocket science, just unfollow them and run the other way. They're all frauds. They don't make any money. Same thing, these simple patterns: triangles, channels, high-tight flags. We bought TSLA here, right? Same thing. I bought TSLA here, right? Same thing. I also bought TSLA down here. Same thing. This is just the same patterns over and over again.
All you have to do to succeed in the stock market is don't be a fucking retard. Really. I mean, really. That's all you have to do. You don't need any intelligence to make tens of millions. All you need to know is risk management, portfolio management, and these patterns. And then you need to have sit-out power when the market is bad. That's all you need. You literally need five things.
And yes, CRWD... where did I buy it? On this day here. You see the pattern. LAC, I bought it here. You see the pattern. I bought it here, or was it here? I don't remember. One of... the same thing over and over again. Exactly, the big... yeah, exactly. All the... Zanger, Jesse Livermore, Darvas, Ruppel, O'Neil... exactly, it's the same thing. They're all momentum traders. They trade these momentum stocks, relative strength stocks, the stocks that funds are dying to get in, okay?
You want the stocks that the funds want to buy, okay? The funds leave footprints, the big institutions, they leave footprints. Your job is to sniff out the stocks the funds are buying. You don't want some piece-of-shit random stock. You're never going to make money over time. You want buyers coming in after you.
Qullamaggie on Double Your Account, Double Your Size
“Hard to make 17 million? Well, if you make over 200% after taxes and fees, it’s not that hard to make 17 million. Like guys, it’s not rocket science. Like, if you double your account, you double your size, and that’s how you make parabolic returns in your accounts.
You can’t sit there and take out money every time you make a little bit of profit, like some of these day trading rooms. You know, they’re shorting these momentum stocks on the front side and their members are blowing up left and right, and they’re like, hey, you always gotta wire out some money. No, you don’t need to. It’s bullshit. What you need to do, is not blow up and trade safe setups. There’s no need for day trading, it’s too hard.”
Master day trading Nasdaq NQ and S&P 500 ES Futures with the Futures Daily Key Levels V3.0 indicator. Trade regular e-minis or micros using a structured auto-updated daily key levels system with defined entries, stop loss and target exits.
My Detailed Analysis of Our Running Trade in #WALCHANNAG
Walchandnagar Industries
By watching this video you will:-
1) know why this was the best option last week
2) reasons we bought it
3) why it can go up 30-80%
4) what made it buyable for us
Let ke know your views