Single father, scientist, & engineer.
Managed medical studies & NASA GISS project.
I only respond to intelligent life.
💉I don't take experimental Medicine!
Threats aimed at Republicans shouldn't be a partisan issue!
Up 364%
Neither should threats aimed at Democrats!
Up 124%
Rise in online violent threats aimed at Republicans, October 2021 to September 2025. ISD. Threats aimed at Democrats rose 124% in the same posts.
Sources and Methods
Republicans, Trump in particular, drew 33% more of them. These are threats, not completed attacks. The sample is about 800,000 posts, a 5% cut of what they collected.
The is a clear rise in political violent potential due to partisan politics. I'm not a Trump fan boy, but we can't have a nation where we have elected officials who are targets of violent rhetoric!
Not toward the left or the right.
Nobody is saying that threats against democrats haven't risen. A 124% rise is not small either.
When are we going to grow up and stop acting like children? I don't know but I felt it's time to say something.
Drug addiction/overdoses are very high and our focus needs to be on further reducing crime, corruption in government (earmarks-special interests and war).
Our government dysfunction, polarization, and debt: the leadership, money in politics, and fiscal trajectory is a problem.
Left vs Right bickering needs to stop.
The problem with the far-left is substantially higher in the millions counting Antifa's planned but not executed violence.
Most left/right are in the middle and not interested in physical harm of any kind.
https://t.co/JH2pZ8GcmL
You need to learn to read from reputable sources.
Washington had no biological children and did not “enslave children” by personal paternity or abduction; children at Mount Vernon were born into slavery under the legal rule that status followed the mother, were controlled via inheritance, purchase, or marriage, and those he personally owned were freed by his will, unlike a fixed religious precedent.
So please spare us the constant stream of lies and nonsense!
"Congress cannot set up a national religion or stop you from practicing your own."
Yet that is the purpose of Islam. You can't separate Islam into a religion and a separate government.
That was the purpose, to keep religions OUT of our government like Islam!
@ScienceBlog3@RuthSulliv24916@TuckerCarlson You must really hate the American constitution, especially the part where Congress cannot set up a national religion or stop you from practicing your own.
@JudicialWatch@TomFitton Yeah, if you bring this up, they keep going back to what he claimed on our paperwork, not what the people in Somalia claimed Omar's father did.
Two former top FBI officials were just charged with lying to Congress about the Hunter Biden laptop. The evidence suggests they were part of the FBI scheme to rig the 2020 election by surpressing and censoring the Hunter Biden laptop story.
“Our atmosphere is broken…If the atmosphere could speak, it would just say, ‘Help.'”
🤣
In ancient times, charlatans would claim to hear voices from the heavens and would warn them that what they did effected the weather too. Made a lot of money that way.
@TomANelson “Our atmosphere is broken…If the atmosphere could speak, it would just say, ‘Help.'”
🤣
In ancient times, charlatans would claim to hear voices from the heavens and would warn them that what they did effected the weather too. Made a lot of money that way.
The IPCC problem is not accepting 3–4 W m⁻² per doubling it's the larger climate response (utter nonsense) they've built on top of it. The part they don't mention.
The ~3–4 W m⁻² figure for a doubling of CO₂ is the instantaneous (or adjusted) radiative forcing from the gas itself, calculated from line-by-line radiative transfer. It is a relatively narrow, technical result about how much the top-of-atmosphere energy balance changes when CO2 rises, before the climate system responds.
Because the forcing is logarithmic, successive doublings add roughly the same ~3–4 W m⁻². The first few hundred ppm of CO₂ produced most of the total greenhouse contribution of the gas; further increases occur on the flatter part of the curve. Acknowledging the per-doubling value does not change the fact that we are already well into the regime of smaller incremental effects.
The IPCC’s agreement on the radiative forcing is agreement on a small, spectroscopy-based number or scale.
The policy-relevant claim is that this forcing will drive large, dangerous warming, but rests on feedback assumptions and model behavior that remain contested. Dare I say ludicrous.
Saturation: In short, the wing mechanism is the qualitative explanation for why the forcing does not go exactly to zero, but the quantitative magnitude is (to say the least) modest, partially offset by water-vapor overlap, sensitive to uncertain far-wing line shapes, and already deep into the regime of diminishing returns.
The large warming projections rest entirely on amplifying feedbacks, not on the size of the wing contribution. Which in many ways, sets the unrealistic expectations.
Personally, I don't think CO2 matters in the grand scheme of things.
Yeah, I've always had a problem with "extra forcing".
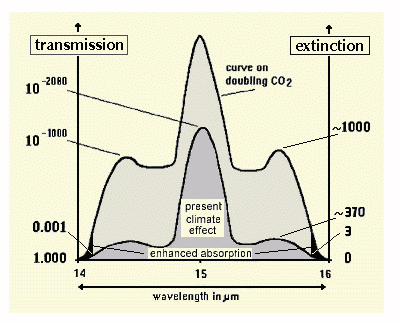
The standard claim is that the core of the 15 μm CO2 band is already optically thick (saturated) at current concentrations, so nearly all the additional radiative forcing from more CO2 comes from slight broadening into the weaker wings. The diagram is a typical schematic of that idea: the tall central peak is the saturated core (present effect), and the shaded shoulders represent the incremental absorption on doubling.
Although I'm not a fanboy for CO2 warming, I can copy this from one of my unfinished papers.
Theoretically this produces only ~3–3.7 W m⁻² of clear-sky forcing for a doubling (roughly 280 to 560 ppm or 400 to 800 ppm).
That is ~1.5 % of the ~240 W m⁻² of absorbed solar energy.
So, without large positive feedbacks, the no-feedback surface response is on the order of 1 °C.
William Happer and William van Wijngaarden’s line-by-line work (using HITRAN) yields essentially the same ~3 W m⁻² figure and emphasizes how little the spectral flux to space changes between 400 and 800 ppm.
The “enhanced absorption” region in diagrams like this is the thin residual after the main band is already filled; integrating it against the Planck function does not yield a large number.
Furthermore, the water-vapor overlap reduces the wing contribution.
The shoulders of the 15 μm band sit in spectral regions where the water-vapor continuum and rotational lines already absorb.
Water vapor is already orders of magnitude more abundant than CO2 in the lower troposphere (50x higher). Overlap means a substantial fraction of the photons that CO2’s wings could capture are already removed by H2O.
Pure-CO2 or dry-atmosphere calculations therefore overstate the incremental CO2 effect. Once realistic humidity profiles are included, the additional opacity from the wings is smaller than the isolated-band picture suggests.
Far-wing line shapes are uncertain and often overstated.
Most climate-model radiative codes rely on Voigt (Doppler + Lorentz) profiles. In the far wings, precisely the region that supplies the “extra” forcing, real lines are suppressed relative to a pure Lorentzian.
Collisional interruption of the phase produces a pedestal or roughly exponential cutoff.
Happer has argued that using pure Voigt profiles without this suppression overestimates the wing absorption and therefore the forcing by several tens of percent (on the order of 30–40 % in some estimates).
Laboratory and atmospheric spectra show less emission or absorption in the extreme wings than the unadjusted Voigt prediction. Because the entire additional forcing lives in those wings, line-shape error is not a minor correction; it directly scales the claimed effect.
How we visualize this matters. Graphs of this type usually plot transmission or extinction on a logarithmic or heavily compressed scale so that the saturated core and the wings are visible on one plot.
The visual area of the “enhanced absorption” shading can look more consequential than the energy-weighted integral actually is.
So the present-day climate effect of CO2 is already concentrated in the core; the doubling increment is the small difference.
Pressure broadening also changes with altitude: lines narrow in the upper troposphere, so the effective widening is not uniform through the column. The net result is a modest rise in the emission height in the wing regions, not a wholesale new absorption of surface radiation.
The first few hundred ppm of CO2 account for the large majority of the total greenhouse effect which is currently almost entirely saturated.
The IPCC mentioned this in the first and second assessment, and then stopped talking about it because it undermined the whole narrative. But, I would say, it's one of the most relevant discussions.
This is one of the reasons why, I have no respect for the IPCC assessments. This is a very important omission.