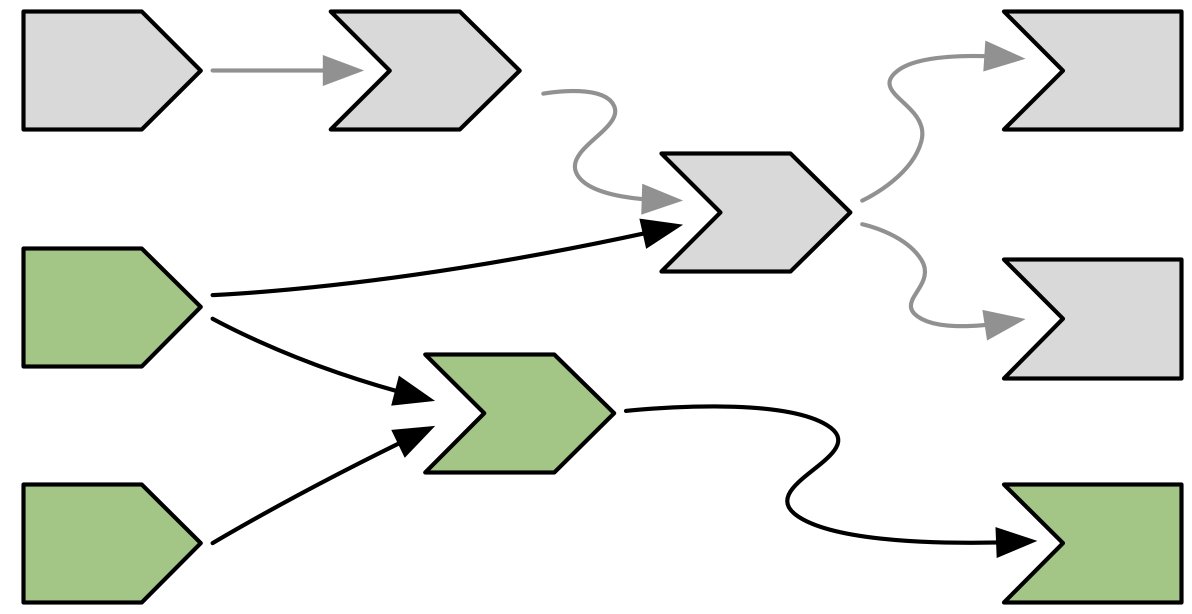
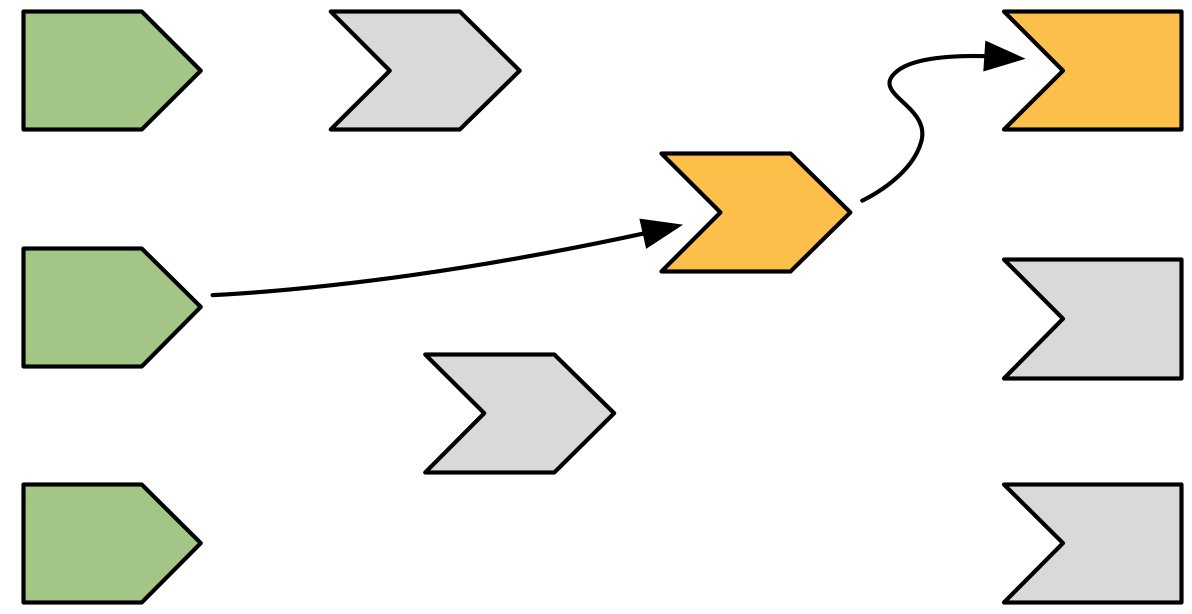
In stats, we talk about the data generating process (DGP), yet data validation is often conducted without a theory of error generation
This post explores some failure models in ELT and implications for #data consumers on effective validation
https://t.co/B8KxBuNd9u
🧵(1/6)
Few activities at work are as invigorating as rapidly programming a feature you can’t wait to use! That feeling of wizardry: I hereby summon the code I wish to run 🧙♂️🪄
Lamar Jackson reached a top speed of 20.52 MPH on this 48-yard TD run, the 7th-fastest speed by a quarterback this season.
Jackson is responsible for 3 of the fastest 7 plays by a QB this season (21.01 MPH top speed).
#BALvsTEN | #Powered by @awscloud
With coronavirus cases rising in the U.S., Europe and many other places across the globe, wearing a mask is more important than ever.
In our animation, we’ll show you how effective a swath of fabric can be at fighting the pandemic. https://t.co/8NuIYjLVTf
If you've ever wondered exactly how Shiny's reactive graph works, I have new "Mastering Shiny" book chapter up: https://t.co/VnFLQdS1Xk #rstats. As always, your feedback is much appreciated!
This animation illustrates the geographic patterns of COVID-19's spread over time in the continental United States. Particularly striking how quickly things shift, and how many cities are fast growth now compared to the initial wave of growth. Made with #QGIS#Blender3d#RStats
LEGO Seinfeld is coming! LEGO Ideas announced today that a set based on the project by Brent Wall will be on store shelves soon
@JerrySeinfeld@IJasonAlexander@OfficialJLD