CBA employees gotta turn vibe-co bro's or their role is going to Bangalore.
Meanwhile the CEO warning about hollowing out is ...checks notes... the guy doing the hollowing out.
Just got to vibe code those boomers a technology to collect their pension digitally somehow. maybe using the internet or an automatic teller machine? Innovate!
What else $CBA going to do, sell more debt?
Utterly nothing of substance in the business except the mortgage book of an overlevered, unproductive workforce, whom the bank and the rest of the bigger players are now completely undermining.
RIP Aussie's.
Oh I'll take some at 3x book, save haven right?
$MYX.AX sold to Gideon Richter for $6.4/share cash. Strong outcome and validated the push by all shareholders - especially Brett, but also others - to maximize value for shareholders.
https://t.co/anwPAAzFgK
I hope you all made buckets of 🤑🤑
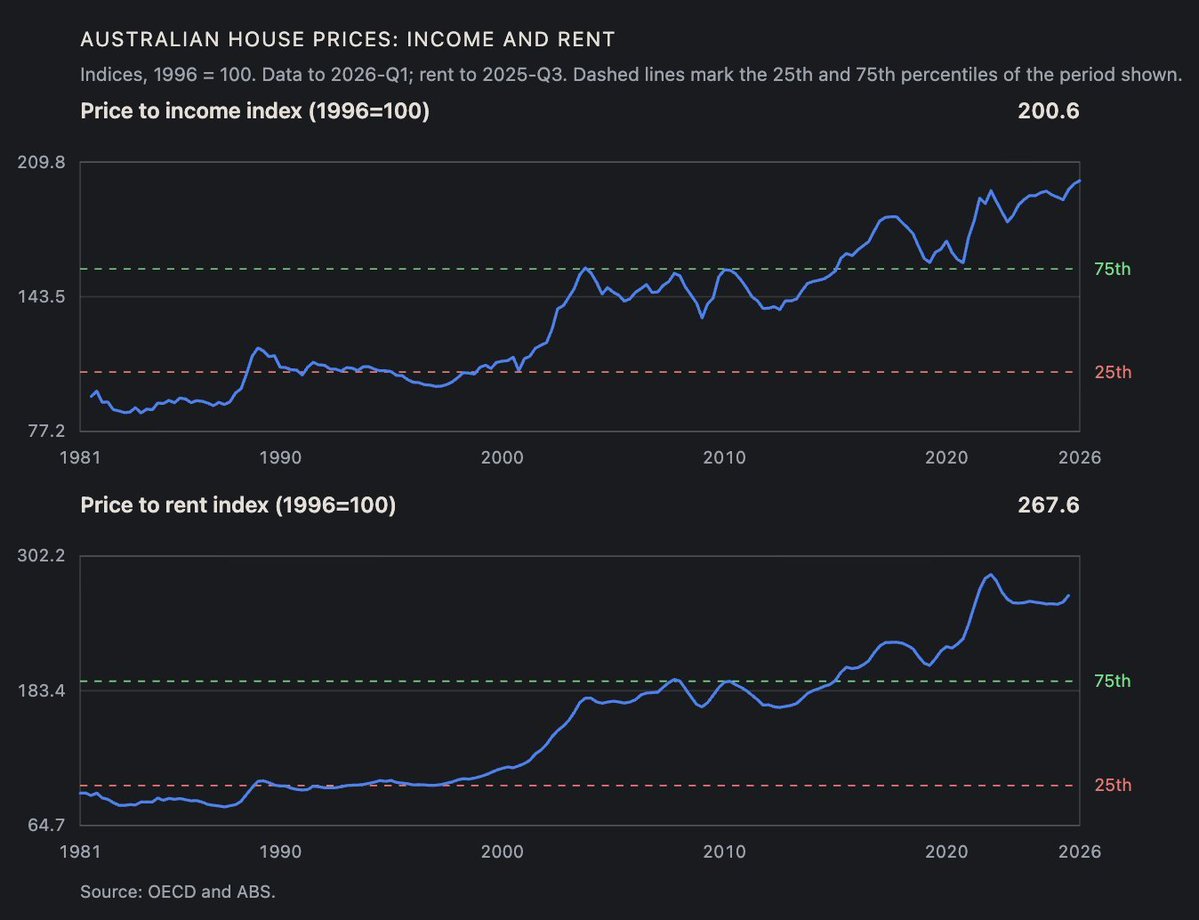
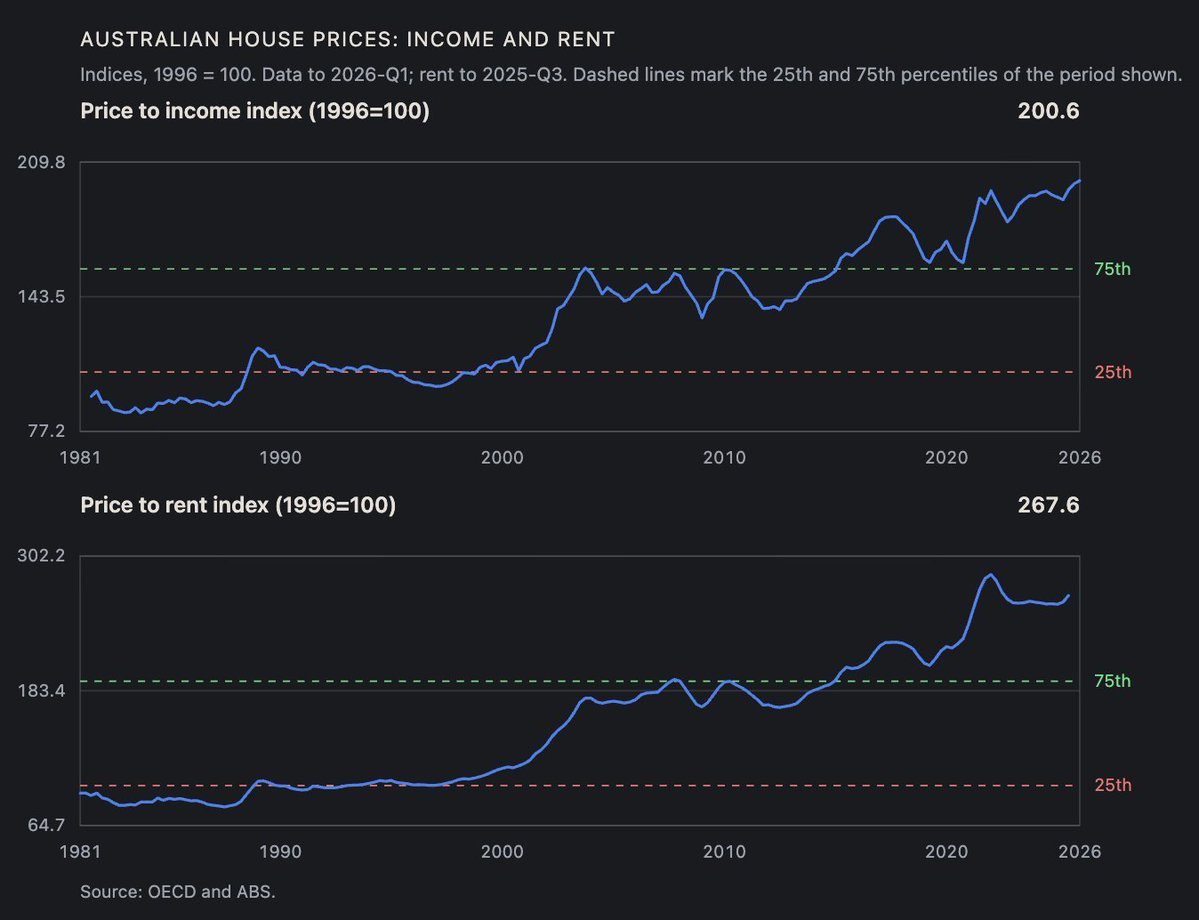
Both measures sit at the top of their history: 100th percentile on income, 98th on rent. A return to normalcy is a 50-63% fall, or two decades of catch-up.
Price-to-income is 2x its 1996 level. Price-to-rent is 2.7x. Closing the gap takes a 50-63% fall, or 20-25 years of flat prices while income/rent catches up.
I know normalcy is no longer normal, but I thought I'd run the numbers anyway:
https://t.co/oeqvcPflpV
Price-to-income is 2x its 1996 level. Price-to-rent is 2.7x. Closing the gap takes a 50-63% fall, or 20-25 years of flat prices while income/rent catches up.
I know normalcy is no longer normal, but I thought I'd run the numbers anyway:
https://t.co/oeqvcPflpV
Australia’s housing correction is now the worst decline on record, as Coolabah projected. Cotality’s five-capital city index has fallen 8.8% from its March 2026 peak, eclipsing the 8.6% decline of 2017-19, previously the deepest nominal drop since the series began in 1980. The daily index passed that mark on 9 November.
What sets this episode apart is its speed. The 2017-19 downturn needed 19 months to reach its trough. This one went further in under eight. The other major corrections, in 1982-83, 2022-23, 2008-09 and 1989-91, bottomed between 6.4% and 8.5%.
The second chart asks whether the falls are slowing. They are not. Measured over rolling 30-day windows, the five-capital index has been declining at an annualised pace of 16% to 19% since late July. It sits at 17.2% today, barely below the 18.6% reached in early August. That is a plateau, not a deceleration.
Beneath the aggregate, the cities are moving in sequence. Melbourne, the first market to turn, is the only one that has clearly eased, with its pace halving from 17.8% in July to 9.2%. Sydney has moderated from 21.1% to 17.5% and has held near that rate since September. The later-peaking markets have taken over. Brisbane is falling at 23.9% annualised, its steepest rate of the cycle and the quickest of any capital. Perth is running at 19.9%, only modestly off its September high.
Relief in Melbourne has therefore been offset elsewhere, leaving the national rate of decline essentially unchanged for more than three months.
While you can blame higher interest rates, the real driver is Australia’s globally elevated inflation, which is in turn being propelled by reckless public spending and some of the developed world’s worst productivity growth. This dismal performance is itself a function of Aussie governments suffocating Main Street (aka private enterprise)...